"In his new message to investors, Grantham forecasts the broad S&P 500 index to drop up to 48 percent from its January 4th peak, to around 2500 points. The technology-heavy Nasdaq could fall even more. It has already fallen 10 percent from its December 27th peak. More than a third of the index’s stocks have already dropped 50 percent or more from their peak last year.
“We are in the fourth superbubble in the United States in the last hundred years,” Grantham writes.
Previous superbubbles that have burst include the stock market crash of 1929, the bursting of the tech bubble in 2000, and the stock market crash of the financial crisis in 2008."
A bit sensational, and I strongly disagree. I don’t see how it would drop more than 25% from here, and probably not even that. I would be very surprised if the composite index crashed below 10,000 points.
I find it more likely that we will see a maximum of 15% lower than now. There’s nothing in the economy right now that would cause a 50% crash.
Interest rates are just normalizing, corona is almost over (hopefully), the employment situation is good, and bottlenecks are moving in a better direction.
The threat is Russia’s rattling or a full-scale war.
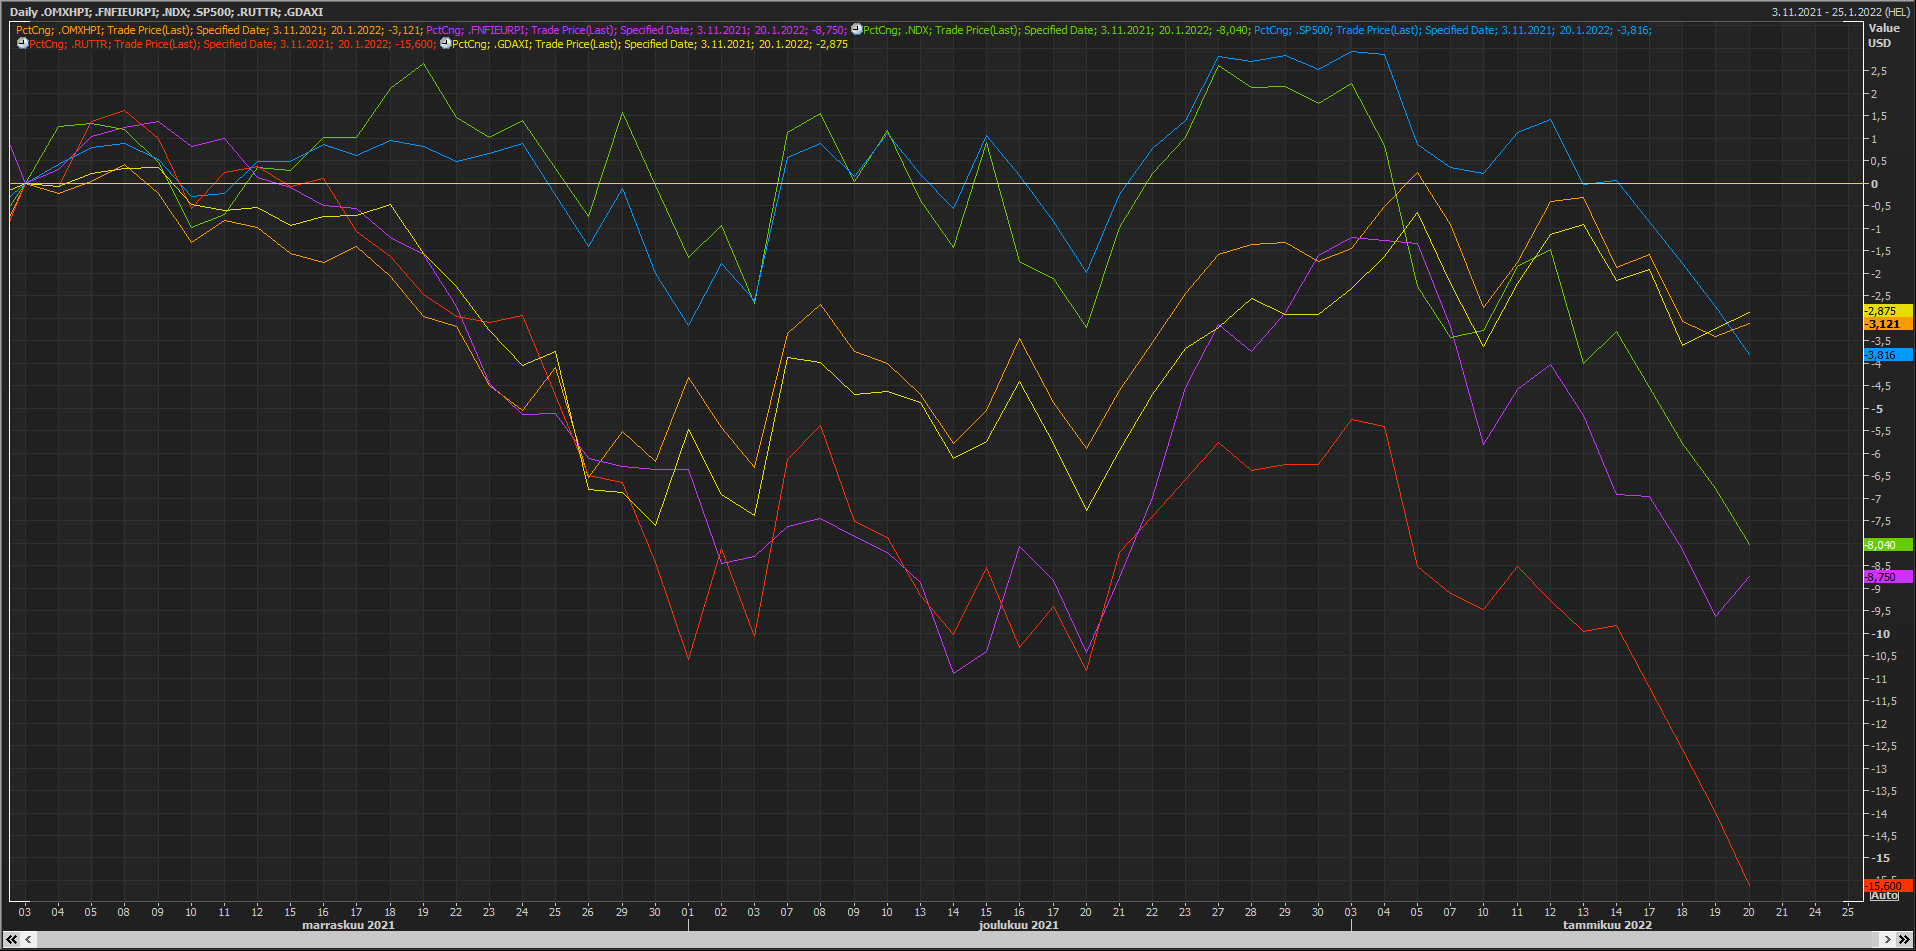
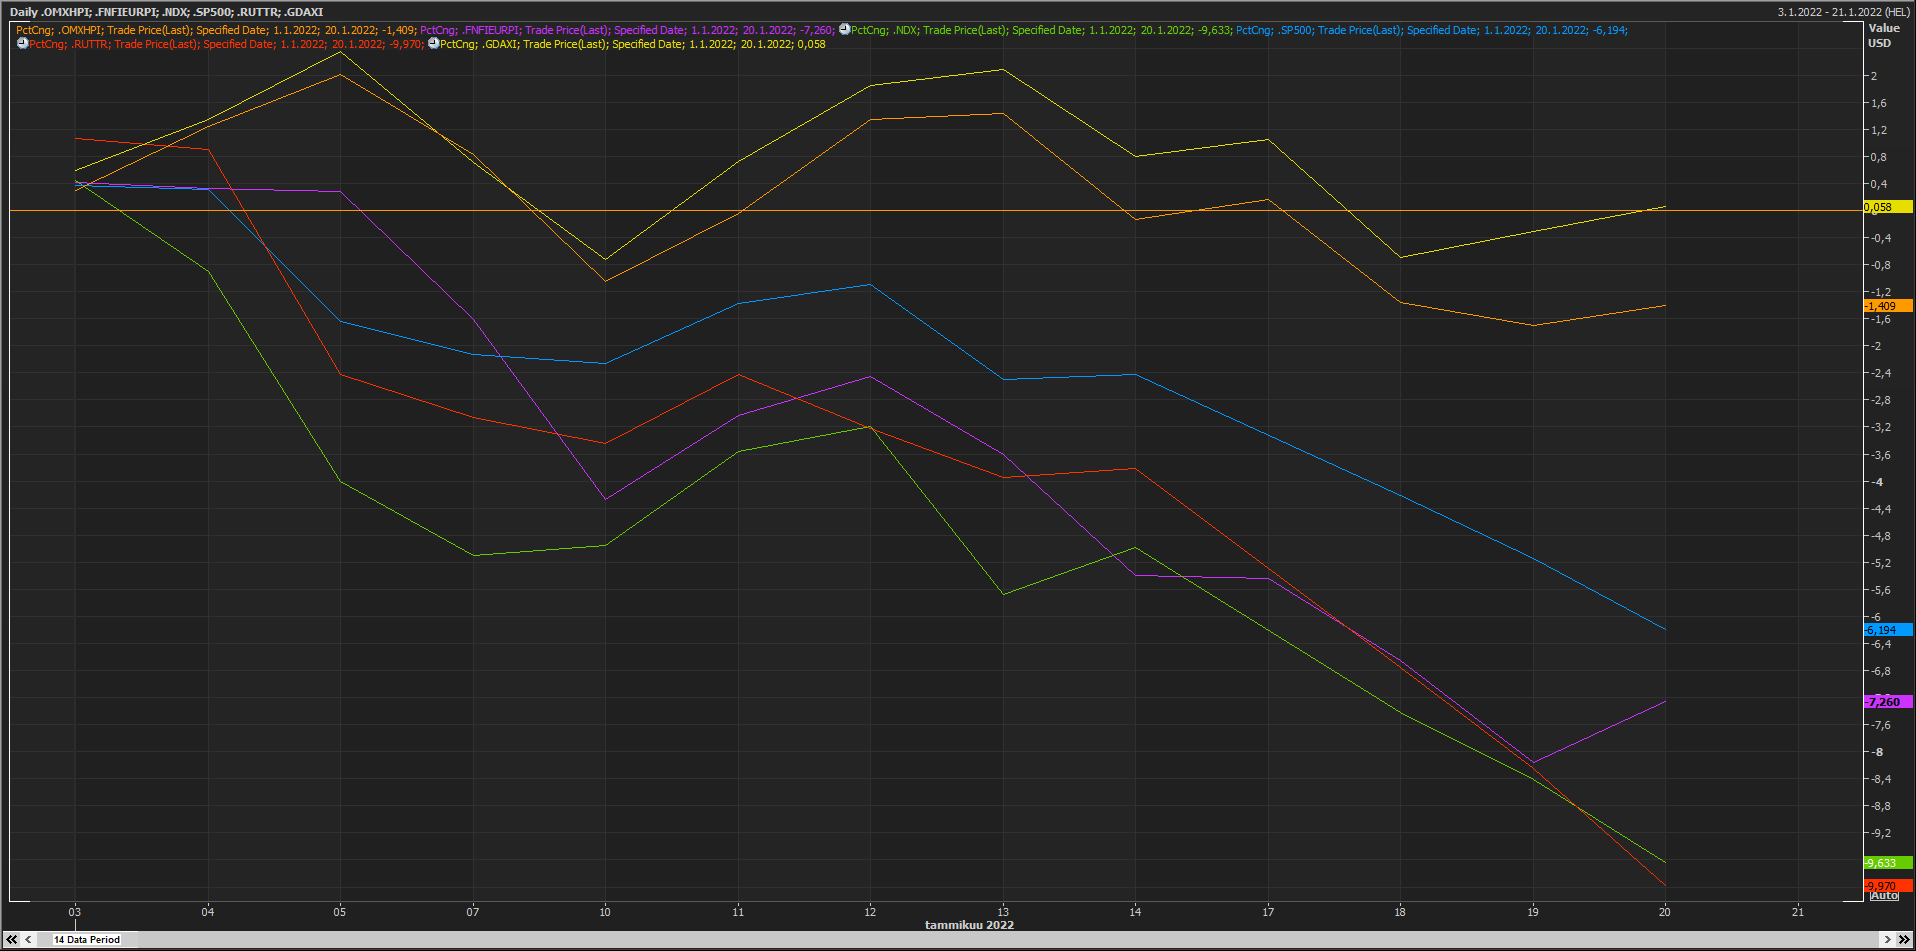
I re-examined my own 2-month-old graph.
Russel has taken a real beating; Nasdaq is starting to follow. Surprisingly, Europe is quite strong. We’ve gotten a little too used to the idea that when the S&P retreats 2%, Helsinki follows with 3%.
I’ll bring it up again that those guidelines and earnings drops are not in the prices, which I mentioned a week ago
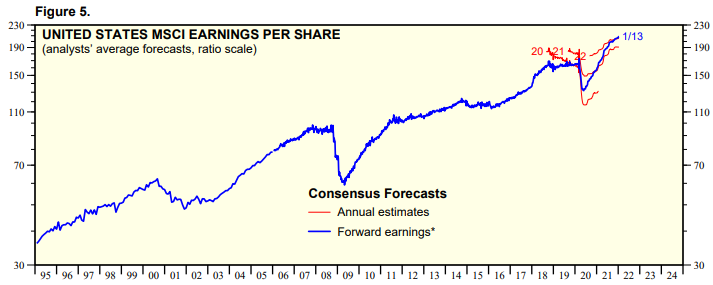
Almost all FAANGs are expected to show YoY negative figures in the coming quarters. On top of this, Fed rate hikes, QT perhaps? and historically high valuations in the stock market.
Retail investors are still buying expensive stocks with wet heads, so there’s not enough fear in the air, imo. Everyone is still buying COVID winners, even though the cycle has already turned and they should be looking elsewhere.
I personally expect a turnaround in February-March when the bad results are over and the first rate hike has been announced.
The markets will breathe a sigh of relief and the sun will start shining again; we’ll be able to look towards the end of the year where we’ll start seeing nascent YoY growth even in FAANGs.
I agree. Grantham is a highly skilled expert, and listening to his insights is very educational. However, I disagree with his “bubble of all time” theory (though one should give more weight to actual economists than to an anonymous forum poster).
Regarding stocks, the IT bubble appears significantly more expensive by all metrics. Furthermore, interest rates were 4% then, against which stocks were indeed in a bubble.
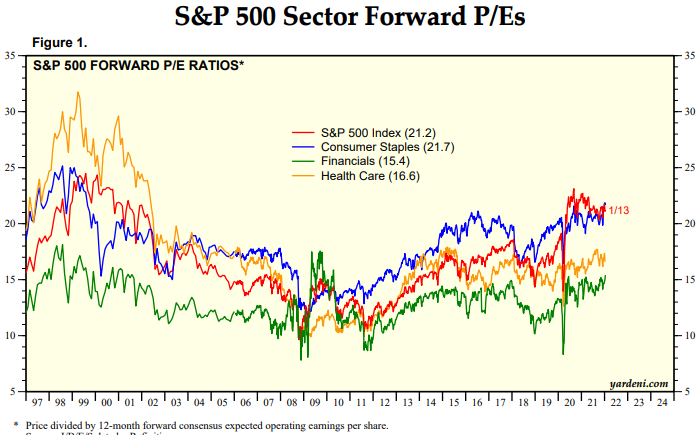
Now, in my opinion, the valuation level is still quite high. Neutral in some places, very expensive in others.
There were indeed bubbles in small pockets of the stock market at the beginning of last year, but those have been neatly deflated without causing widespread panic.
The S&P will not fall to 2500 points without the economy starting to falter badly. Stock markets rarely collapse while the economy continues to grow.
The 2022 forecast for the S&P is about 223 – > P/E 11. The S&P has only reached such numbers during severe fear and when interest rates were completely different.
Interest rates rising above 4%, S&P margins falling to 8-9%, an economic recession, or even a depression – > With these ingredients, we would surely reach the 2500 level.
On the other hand: the current debt bomb, high margins, structurally weak growth due to demographic changes – > It’s possible to paint horror scenarios that make equity investors envision decades of nightmares.
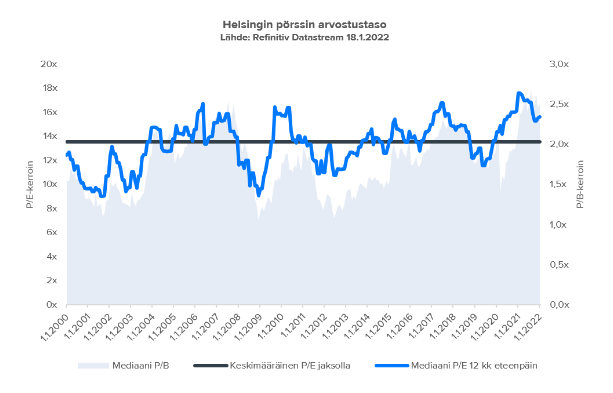
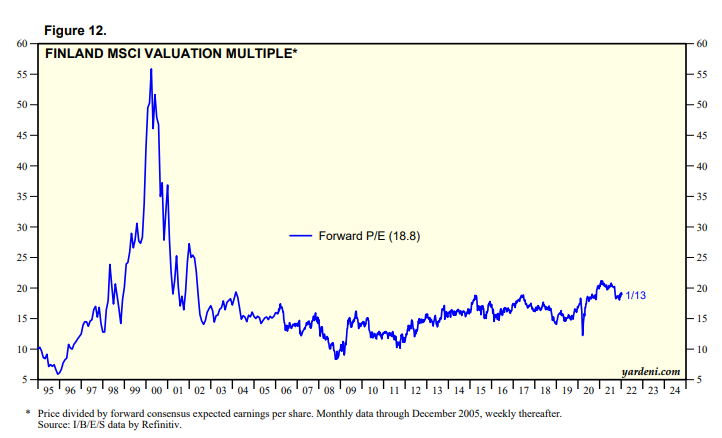
Where could I dig up the current P/E or P/B ratio for OMXHGI? It would be nice to compare the current valuation to “normal” levels..
How well does it correlate if, for example, many new growth companies with higher P/E ratios enter the stock market? Wouldn’t it then be harder to compare to history?
The latest earnings season preview had valuation as median figures. The median is perhaps more descriptive for the Helsinki Stock Exchange, but still, the general index’s P/E is also the same 16x looking forward.
I’m spamming a bit since I got into the swing of writing.
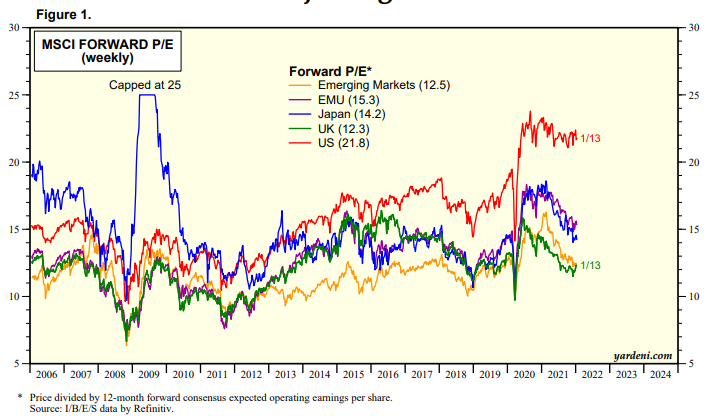
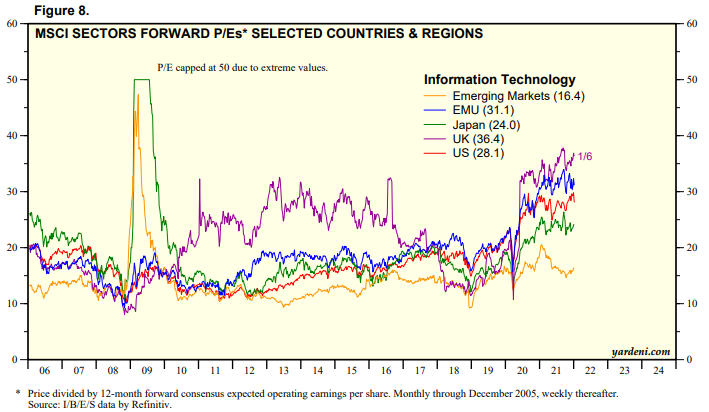
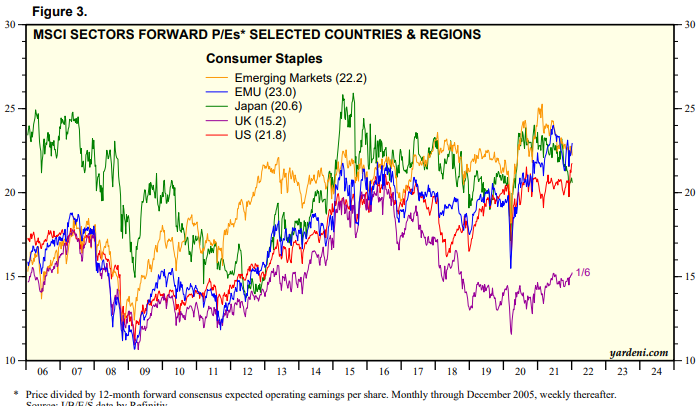
I’ll also mention that for US vs. EMU, it’s well-justified that the US is considerably more expensive.
A big difference lies in the stock market sectors. The US has many growth sectors.
In individual highly valued sectors, valuations in Europe might even be higher. These are relatively smaller in the EU and thus don’t boost the valuation of the entire index. However, a fair amount is paid for those few IT firms..
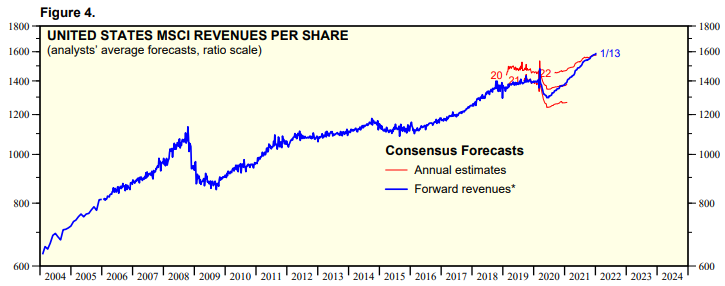
If European companies put the same percentage of money into buying back their own shares as they do in the US, EPS development could be in a completely different league. Are there similar charts for pure revenue development?
I was actually referring to world-ex US.
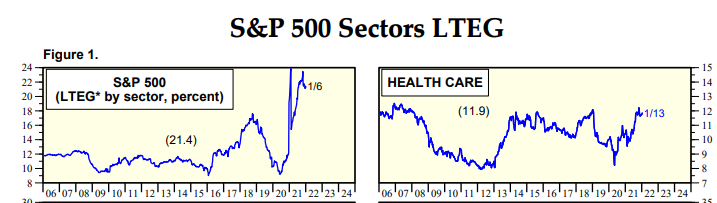
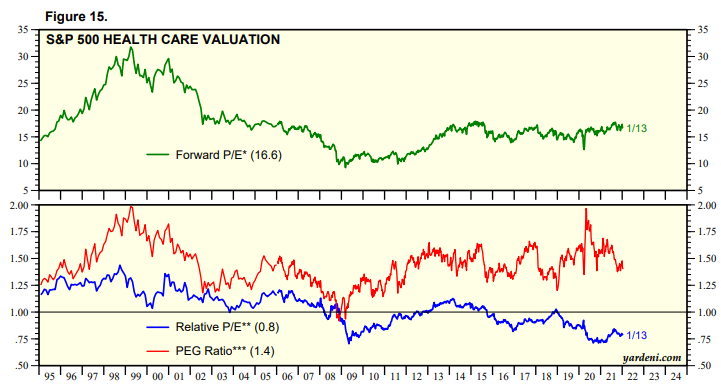
There are probably individual companies and sectors in the US that are at acceptable prices. For example, I think healthcare is reasonably priced. Very stable, almost cycle-independent high single-digit growth and a PE of around 17 now.
Edit:
healthcare
No unrealistic long-term earnings growth expectations included:
At 10.7%, Brazil’s 12-month inflation rate is the third-highest among the major developed and emerging economies that form the Group of 20, after Turkey and Argentina, according to the Organization for Economic Cooperation and Development.
My portfolio is down about -10% YTD, and there’s still nothing really worth buying on my watchlist. On the other hand, a nice dividend spring is coming, and I can sleep well.
It’s good to see the market working in both directions. It’s sad to see many paying tuition fees. I paid mine in 2009.
But all in all, now it’s again meaningful to follow the market. 2020-2021 stuck in my mind as a time – buy anything and stonks to the moon, profit is for wimps.
Now it’s a little old-school again, where if there’s no growth, the stock can even fall. And along with the bathwater, some perfectly good companies can go down too, which is where the big opportunity in this downturn lies.
Looking at the current valuations from the linked list, the market cannot be considered very overpriced in many countries, especially when compared to historical data. Only a few countries, such as the Netherlands, New Zealand, and India, stood out on the list.
No, but many things can change within a year, such as margins, which were also too high in forecasts, and interest rates will start trending upwards in the coming years. Typically, markets tend to look quite far ahead.
That’s a double combo, difficult to assess its likelihood.
I agree that in a situation where the prices of many risky assets contain a lot of optimism, such a boring, defensive, well-diversified and high-quality set like the S&P 500 health care sounds quite reasonable at that valuation.
One potential pitfall there is how the forward 12m margin might not quite correspond to normal.
The sector’s forecasts now show the highest margin since 2005. And back then, did pharmaceutical companies with structurally higher margins have a larger weighting?
EDIT:
The 500 companies can be divided into 11 sectors. Each sector contains different number of companies.
Greasy tech stocks can’t withstand even the slightest earnings disappointment. Valuations are stretched so tight relative to distant future profits. The whip comes down immediately if earnings disappoint expectations.
After a long period of stimulus, there’s more than enough capital in the market. This capital has to move to something productive. Mika Heikkilä and Aki Pyysing come to mind as those who expect the rotation to continue and capital to shift from expensive growth to cheap value.