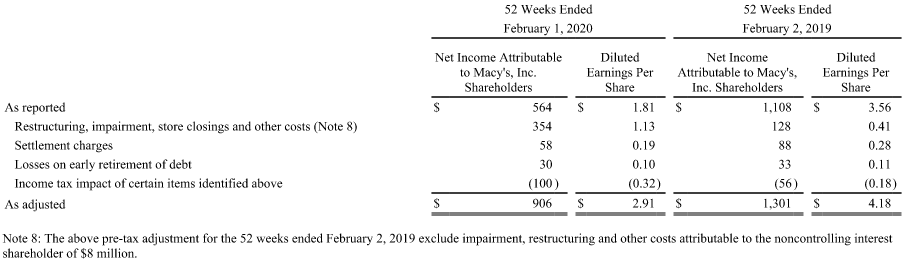
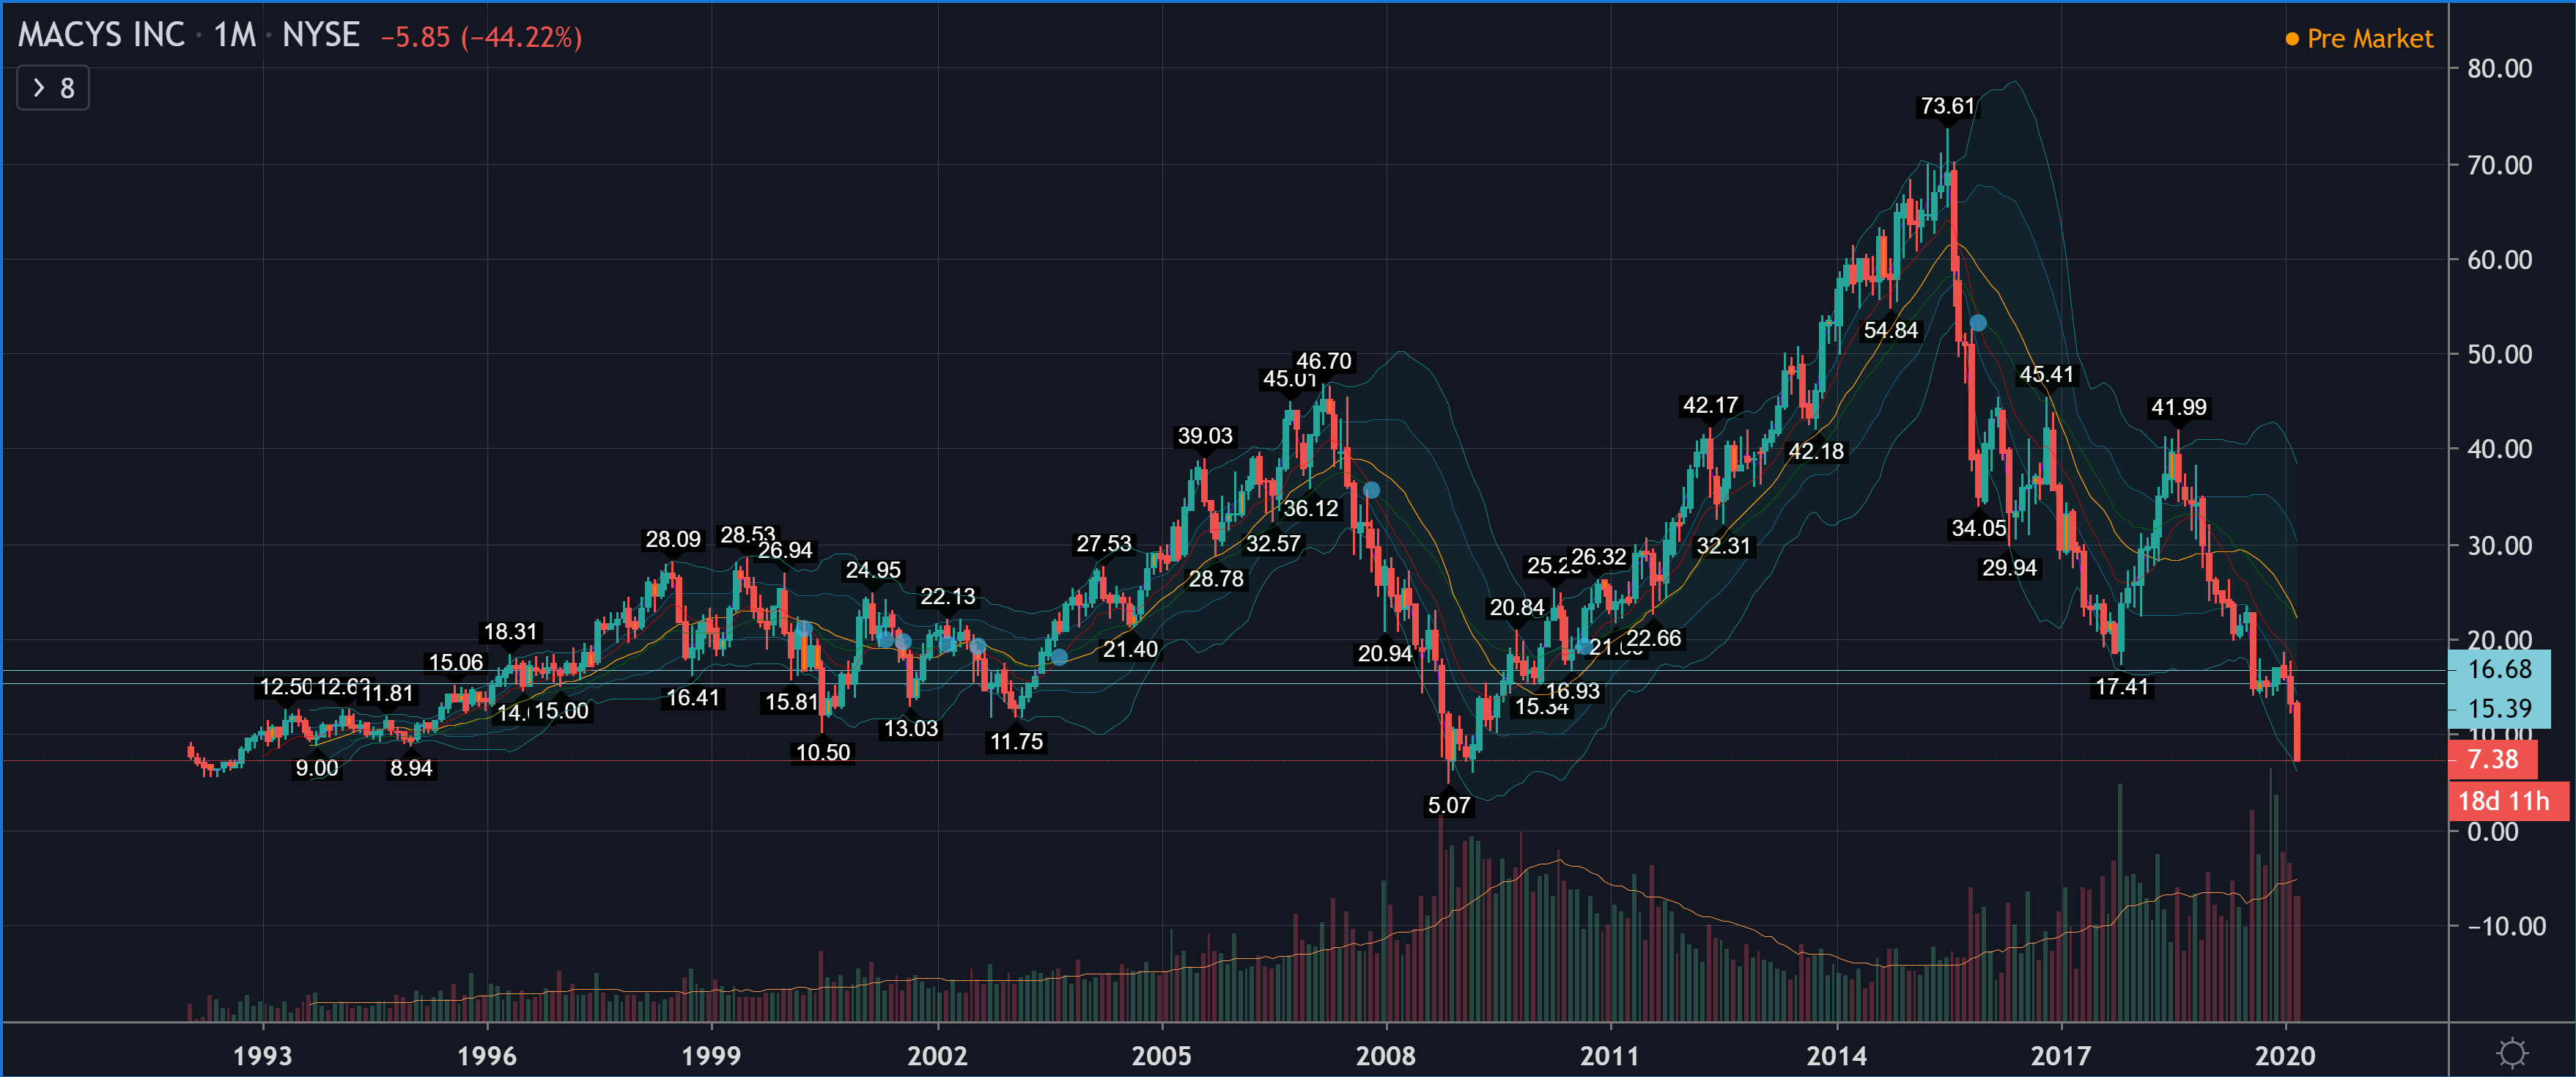
Macy’s Inc is a traditional American department store chain whose market value has plummeted amid the current coronavirus panic. The company sells fashion apparel and cosmetics in its department stores, online, and via mobile app. Last year’s reported earnings per share (EPS) was $1.81. The company has launched a three-year cost-saving program to overhaul its organizational structure. Past performance can be tracked through this link to the Macrotrends website. As a side note, Macy’s generated a pre-tax profit of 444 million (receiving a tax refund) during the fiscal year ending January 31, 2009, in the midst of the financial crisis, excluding goodwill write-downs. With a share price of $9.5 and 309 million shares outstanding, the current market capitalization of the equity is $2,935.5 million.
Let’s address the elephant in the room right away. This company is very similar to Stockmann, with the distinction that Macy’s is profitable, whereas Stockmann’s entire business collapsed and its investors lost their money permanently. To make contrarian investing sensible, one must know whether the markets are right and efficient. We must answer the question: is Macy’s path the same as Stockmann’s? The balance sheets of both companies are frighteningly similar due to large amounts of goodwill. Macy’s equity, minus goodwill and intangible assets, is 2,030 million.
An essential factor is the demand for the company’s products, on which all business is based. Demand normally depends on the quantity of the company’s assets—meaning if you open or close locations, your revenue naturally grows or shrinks. Revenue growth is not an end in itself; the purpose of an investment is to generate profit for its owners. This development is well illustrated by the Asset Turnover ratio, where the fiscal year’s revenue is divided by the average total assets at the beginning and end of the fiscal year. The resulting figure depends heavily on the industry and the company, so a sensible benchmark is the company’s internal development over time.
The following table shows Macy’s Asset Turnover values, which I have calculated from the company’s reports:

In some companies, demand truly changes with the business cycles. Demand for Stockmann’s products has withered throughout the 2010s (see Stockmann’s company page, PDF), making it difficult to cover fixed costs.
Macy’s equity ratio is 30.1%, and its liquidity, measured by the Current Ratio, is 1.18.
For 2020, Macy’s provides guidance for an adjusted result of $2.20 - $2.40, excluding gains from real estate sales. This guidance was issued on February 25, 2020, while the coronavirus situation was ongoing, but it does not account for the effects of the virus. According to the latest data, 95% of the company’s factories in China have already resumed operations. The company generates the majority of its profits in the fourth quarter, from November to the end of January. According to management, the first quarter and the first half of the year will be weak, with earnings improving toward the end of the year.