Criticism of eternal investment truths

Thousands of thoughts are swirling inside me that need to get out before it’s too late. The goal is to go through the rules of thumb in the investment world and the pitfalls of thinking in general. Many rules of thumb are sometimes vague and contradictory, and they don’t work all the time. However, it’s worth learning the rules forwards and backwards, after which you can start breaking them if necessary. If you want to achieve better than average results, you need to master things thoroughly, and rote learning is not enough for that.

I will first outline a table of contents in the opening post, after which I will begin to dissect, ponder, assemble, or destroy all kinds of truths. All of this will take time, and patience will be required, both from the writer and the reader. I reserve the right to edit texts afterwards and even change my mind. The reader should therefore browse the text again even after long periods. Repetition is the mother of studies, as my late religion teacher enlightened me.

I don’t particularly crave actual discussion or dissenters, because my biggest critic and fan lives inside my head. Comments are, of course, welcome. This will probably become such a long thread that readability will inevitably suffer, but for now, this format will suffice. After all, no one reads books anymore.

Questions about general investment truths are worth throwing out right from the start. The table of contents can evolve as new things to ponder emerge.

I do not use references in the text, as a large part of the material has been refined in my own head over the years. Material has been collected from here and there, so the origin is impossible to trace. In addition, a large part of the thoughts originated completely outside the financial world. It is up to the reader to weigh whether the thoughts have weight or use in their own toolkit.

Markets
Information
News
Long vs. short perspective
Cyclicality
Continuous (eternal) growth
The market is always right/efficient
The stock market anticipates x months/years
Market timing
Fundamentals/sentiment
Indices
Interest rates
Inflation

Portfolio management
Key figures
Growth
Value
Dividend
Penny stocks
Buy what you know
Price vs. value
Diversification
Portfolio rebalancing, percentage limits
Selling limits

Investment psychology
Fear
Greed, insatiability
Satisfaction
Falling in love with a stock
Repeating the same thing expecting a different outcome. Stupidity or digging open a dam?

Technical analysis

Do you want to be a millionaire (or even a professional)?

I apologize in advance for the slow progress of the writing, following which is like listening to paint dry. However, I think it’s better to write little by little in front of a live audience than to write hundreds of pages of text in silence for three years and upload it all at once.
Here, however, you get to see individual brushstrokes, even the erroneous ones.
92 Likes

Even though interviews may have given the impression that I don’t follow macro or that my work is solely about digging into company-specific details, macro factors played a very significant role, especially in the early stages of my career. An interest in business cycles drove me toward stocks, and the scale of my thinking has evolved from the larger picture toward the smaller details. I glance at indices every now and then to keep myself oriented regarding the general mood and level of the market. Especially as cyclical peaks and bottoms approach, my gaze shifts more toward macro factors than individual companies. Investment decisions and actions are formed as a synthesis of micro and macro. There are no valuation levels carved in stone; rather, macro serves as the backbone around which decisions are or are not made.

It is worth remembering that indices themselves are nothing more than a collection of stocks etc., from which a point value is derived. They have a history, but no memory and no will. All the meanings people attribute to them exist only in people’s minds. They are the tail being wagged by the dog—the dog whose location and shape we are supposed to figure out.

In investing, studying the history of indices is like studying old maps that resemble today’s terrain, but something about them is off. Borders shift, roads lead to different places at different times, yet bodies of water and the contours of the land likely remain in place.
Index history should therefore not be literally transposed as a guide for today, but much can be drawn from it when trying to grasp where on the map we are moving today. It is wise to familiarize oneself with the terrain before considering potential travel companions.

Let’s stare at these for a moment.

I quickly looked for index charts from the history of the domestic stock exchange. These were the most useful ones I came across with a fifteen-second Google search. Both have their flaws, but they will have to do.

Before I continue, I’ll let the reader ponder what flaws these might have.

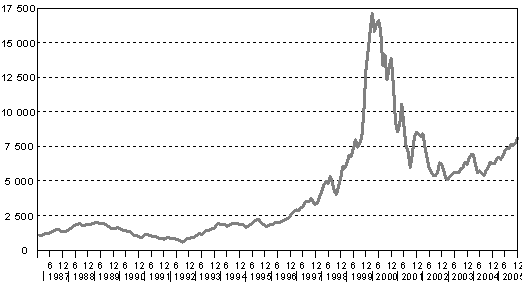
The history of the Helsinki Stock Exchange from roughly the time I’ve been aware of the existence of investing. The image shows a price index (not weight-capped), so the Nokia bubble appears disproportionately large. The curve is startling in the sense that no new peak has been seen in over twenty years, and one won’t be seen anytime soon. I have promised myself to pop a bottle of champagne when the record is broken, but I doubt the grape variety for that bottle has even been invented yet. I do believe, however, that a new peak will be reached in my lifetime—after all, I intend to live a long time.

If I had seen this specific curve in advance, I might not have entered the stock market with the same enthusiasm. However, the long history of the stock market has shown that it is a game where everyone can win. When you clean the impact of Nokia’s peak years out of the index, the picture looks less bleak.

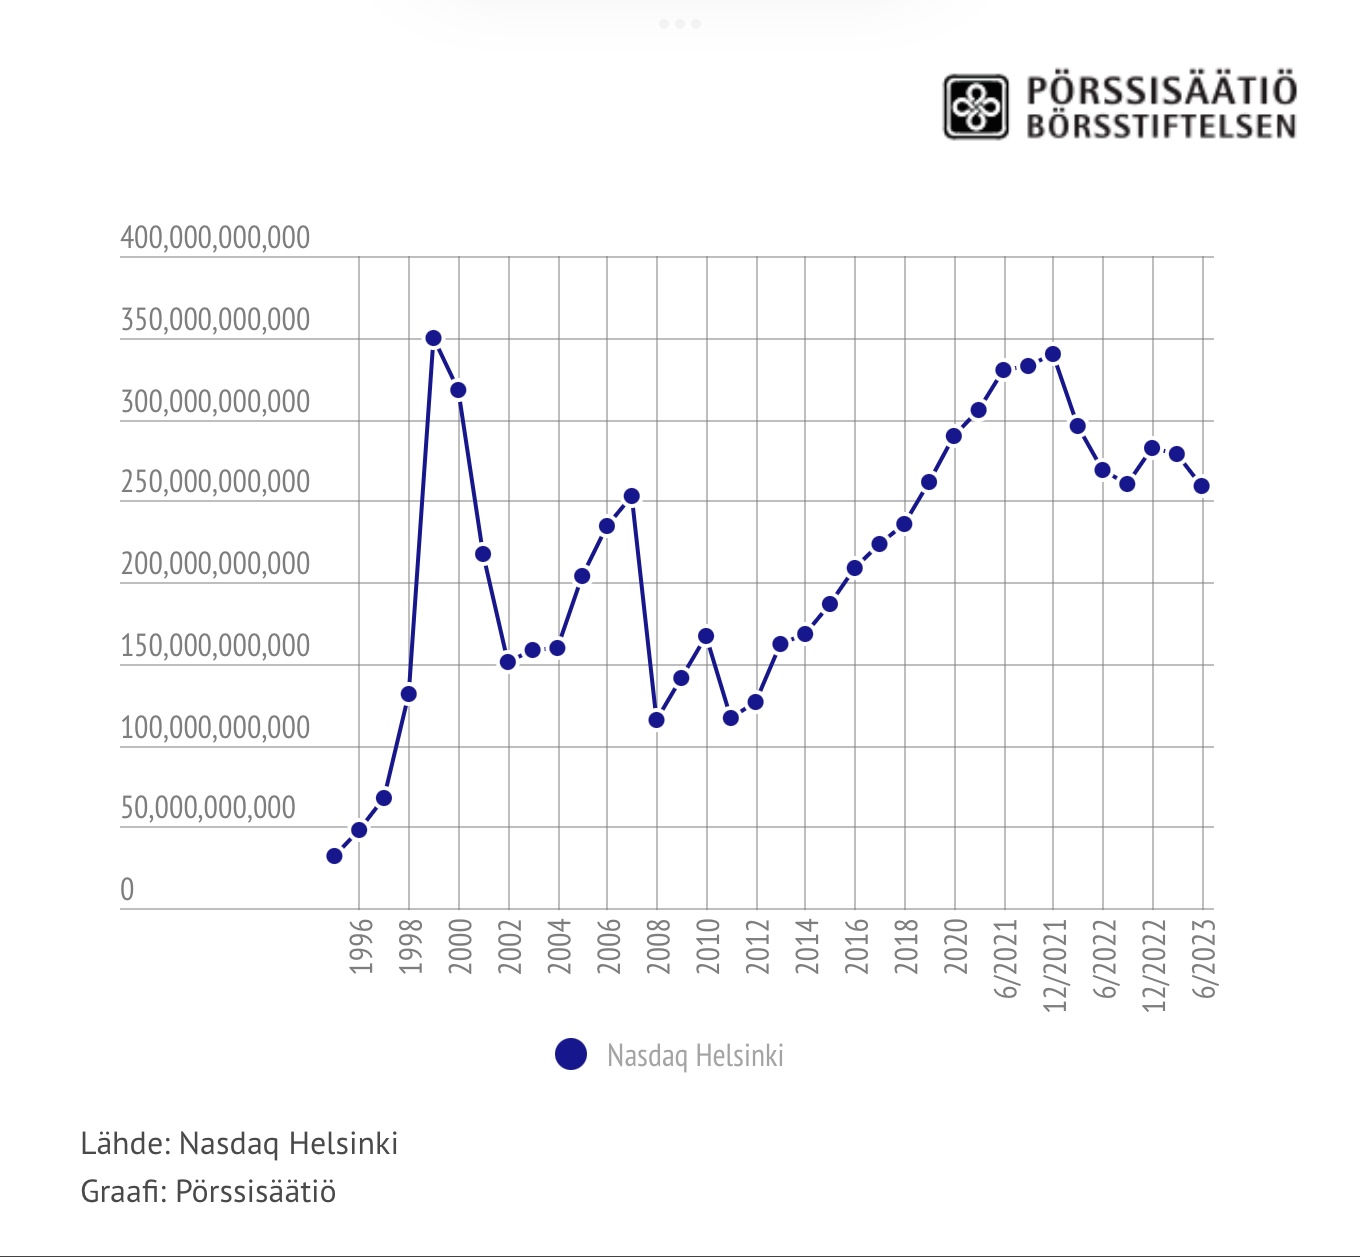
Measured by market values, the Helsinki Stock Exchange has already come very close to the tech bubble levels, which isn’t a flattering development either. Despite everything, I still manage to stick to investing only in domestic stocks. Our home exchange offers enough variation between cycles from which to seek returns. I am not looking for great global success stories, but for sufficient relative appreciation (i.e., percentages). I want to utilize a sort of home-field advantage. Furthermore, many listed companies are already so international, and a large portion of sales comes from outside the borders, that the domestic market alone does not determine the possibilities for success.
I am also a person who likes to take the easy way out, if possible. I only do the necessary amount of work relative to the end result. Sometimes that means an endless amount of work now to enable lying around tomorrow.

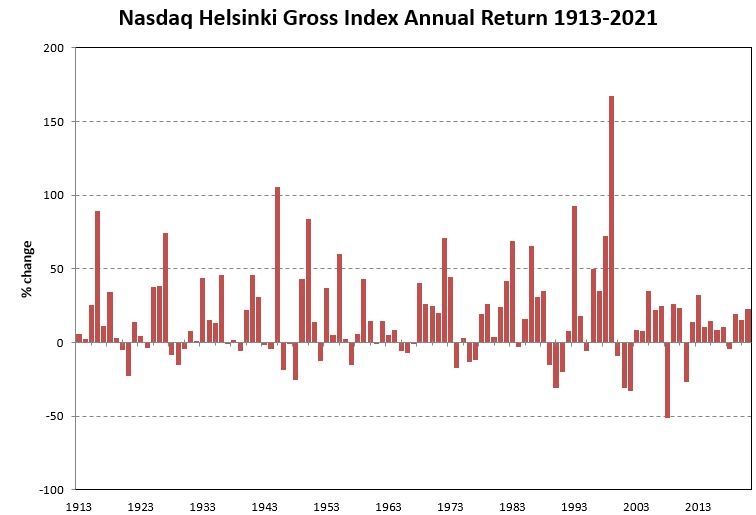
Stock market annual returns throughout its entire history. The years are categorized as either up or down years according to the calendar. This is a slightly distorting practice, but over the long term, it gives some kind of picture. Even the COVID year seems to be in the black, even though I feel we experienced some kind of dip during the year.

At a quick glance, there are more up years than down years, and the up years are stronger than the down years. This is influenced by the fallacy of stock market mathematics, which is why percentages cannot be directly compared with each other. -50% and +100% are equal in value.

41 Likes