By popular demand, a separate TA thread for cryptos is being opened so that other crypto threads don’t get lost in pure TA. In this thread, as the name suggests, cryptocurrencies are analyzed from a technical analysis perspective.
I’ll start the game in this opening post and make a couple of observations about BTC’s TA.
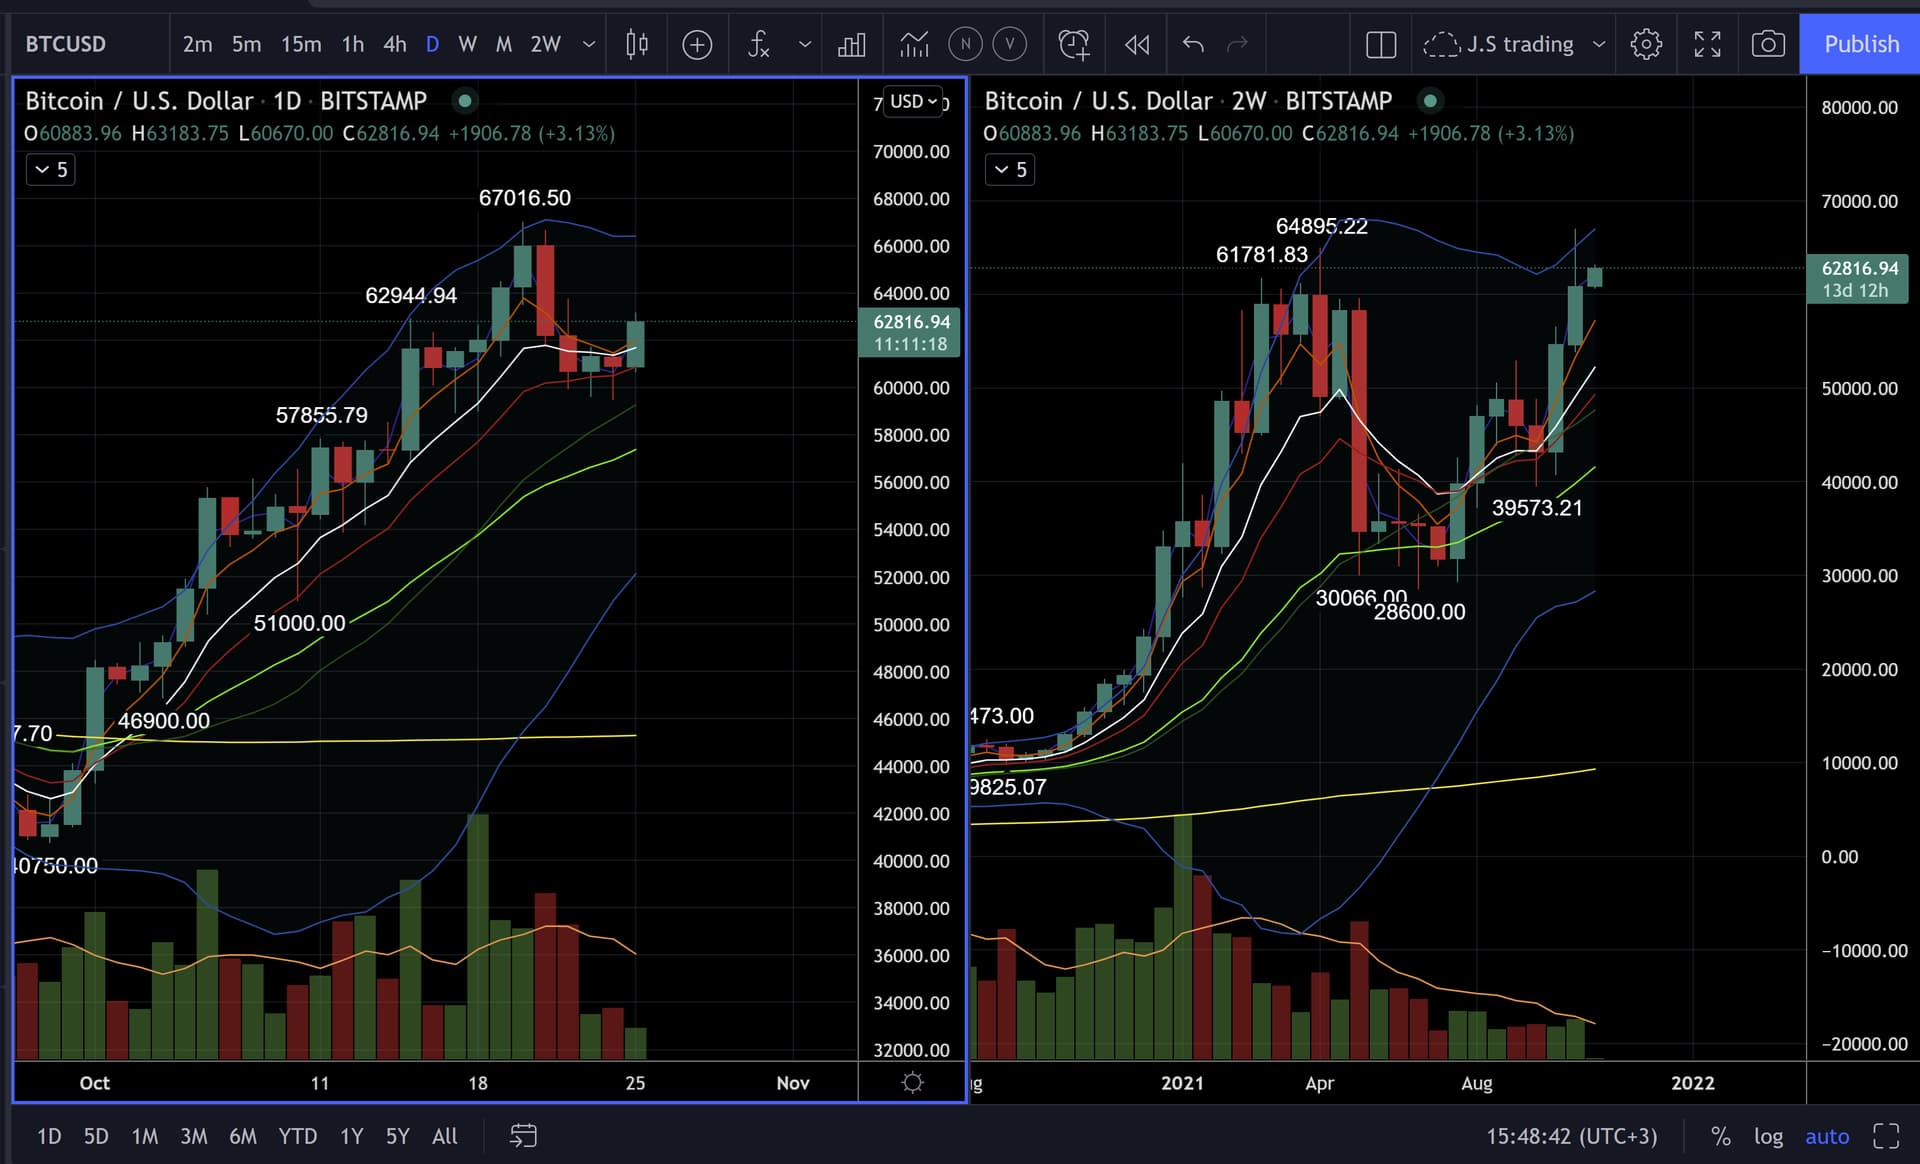
Daily HL set at approx. $59.5K, daily EMA12 supports the price.
On a weekly level, there is a so-called “optional” bull flag according to my criteria, so the two-week TF gives more clarity here: from a 2W bull flag directly to a resistance test (previous ATH). We’ve already broken above the previous ATH, but in such a volatile name, ~3% follow through from breaking the previous ATH is not enough yet - more follow through is definitely needed.
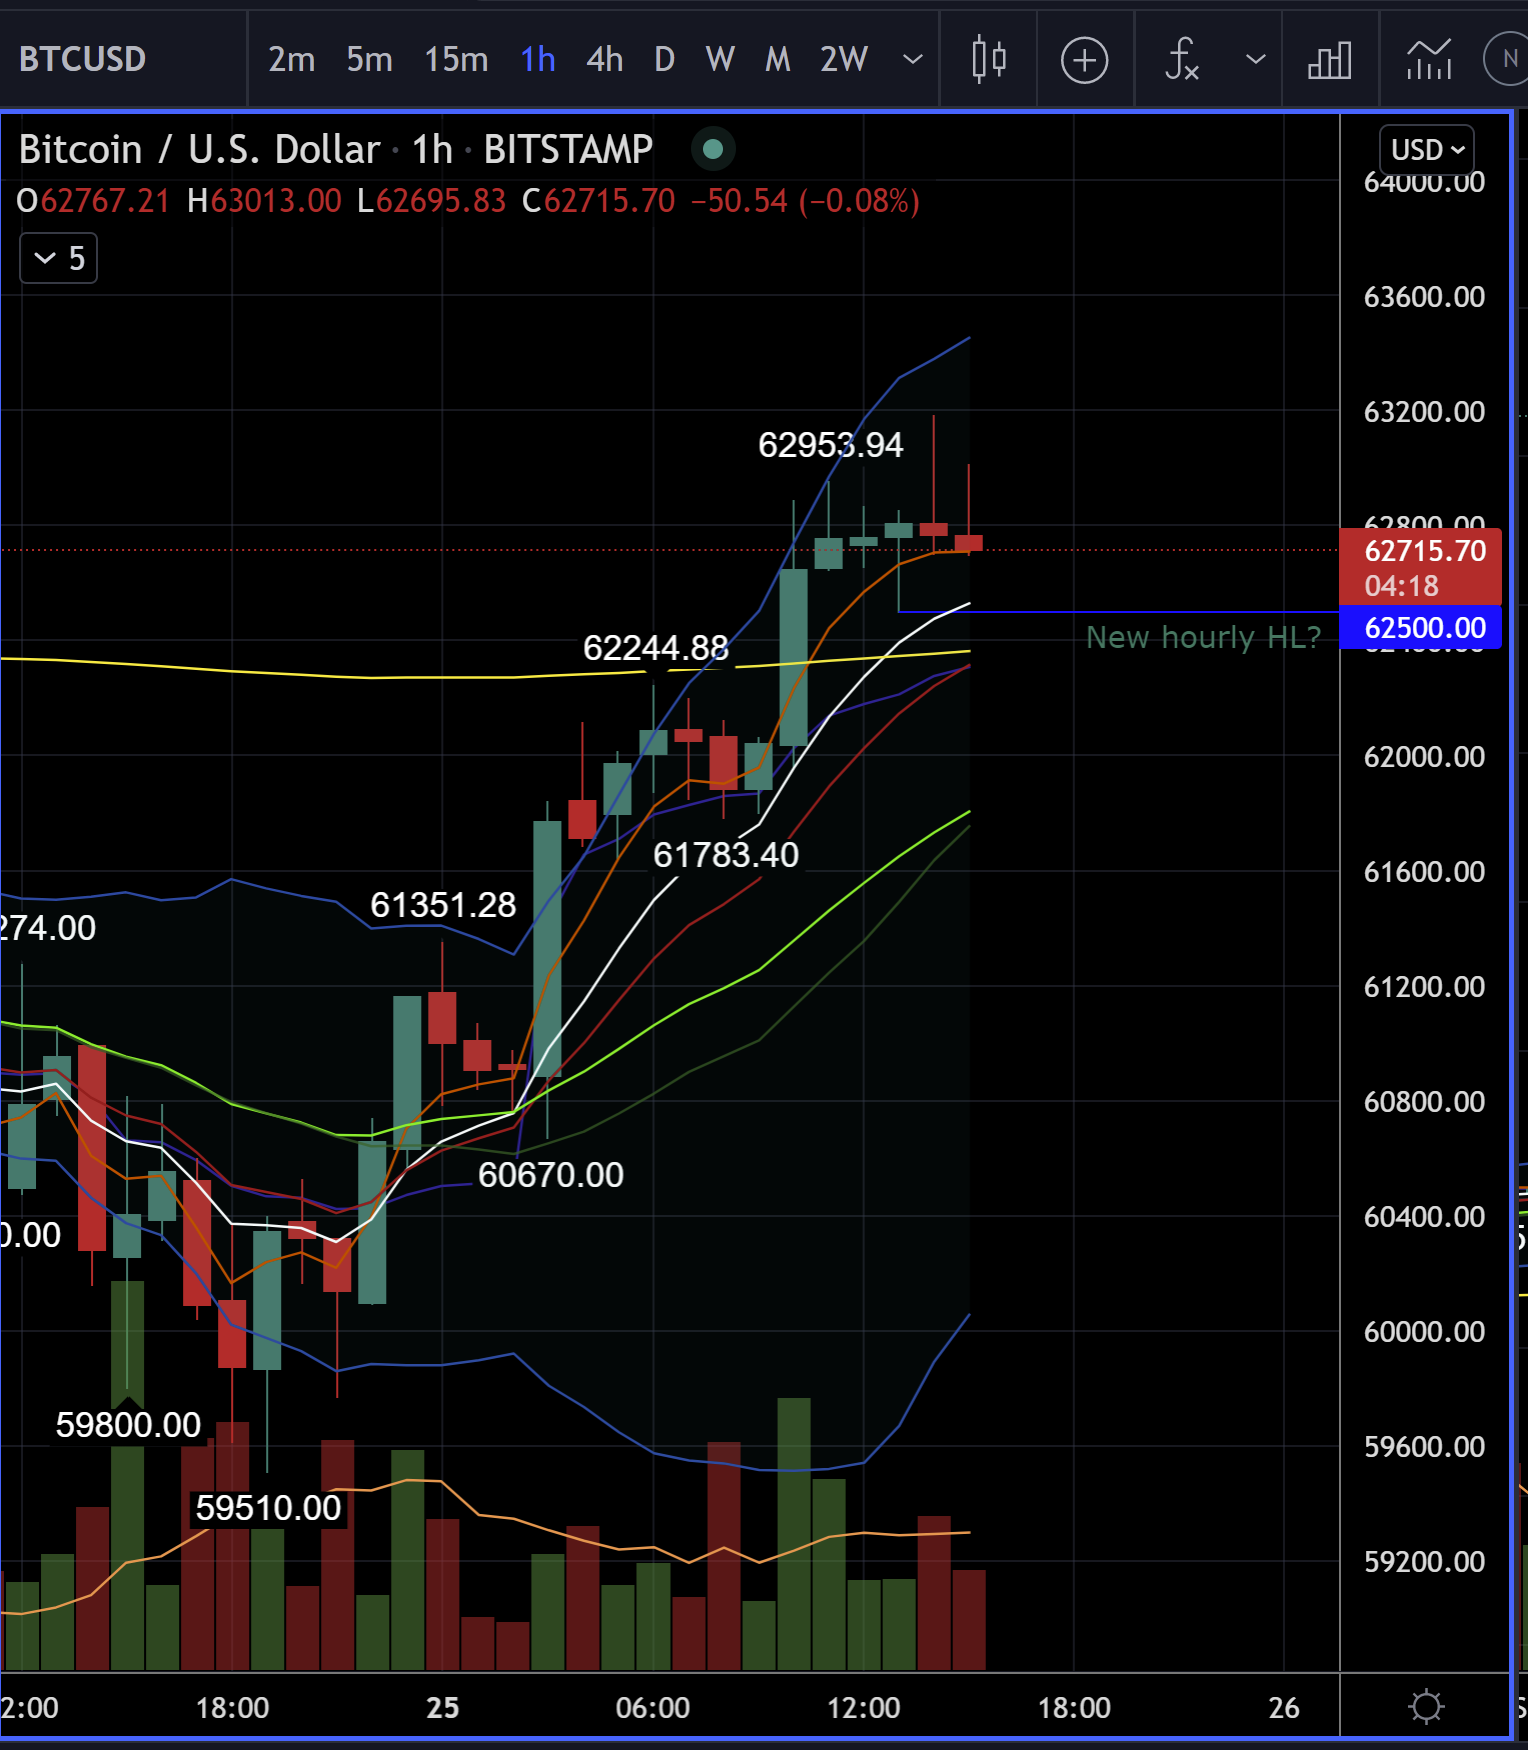
1h bull flag potential still alive if the low formed at ~$62.5K holds and the ~$63K level is clearly surpassed. The 1h uptrend is still clearly in effect for now.
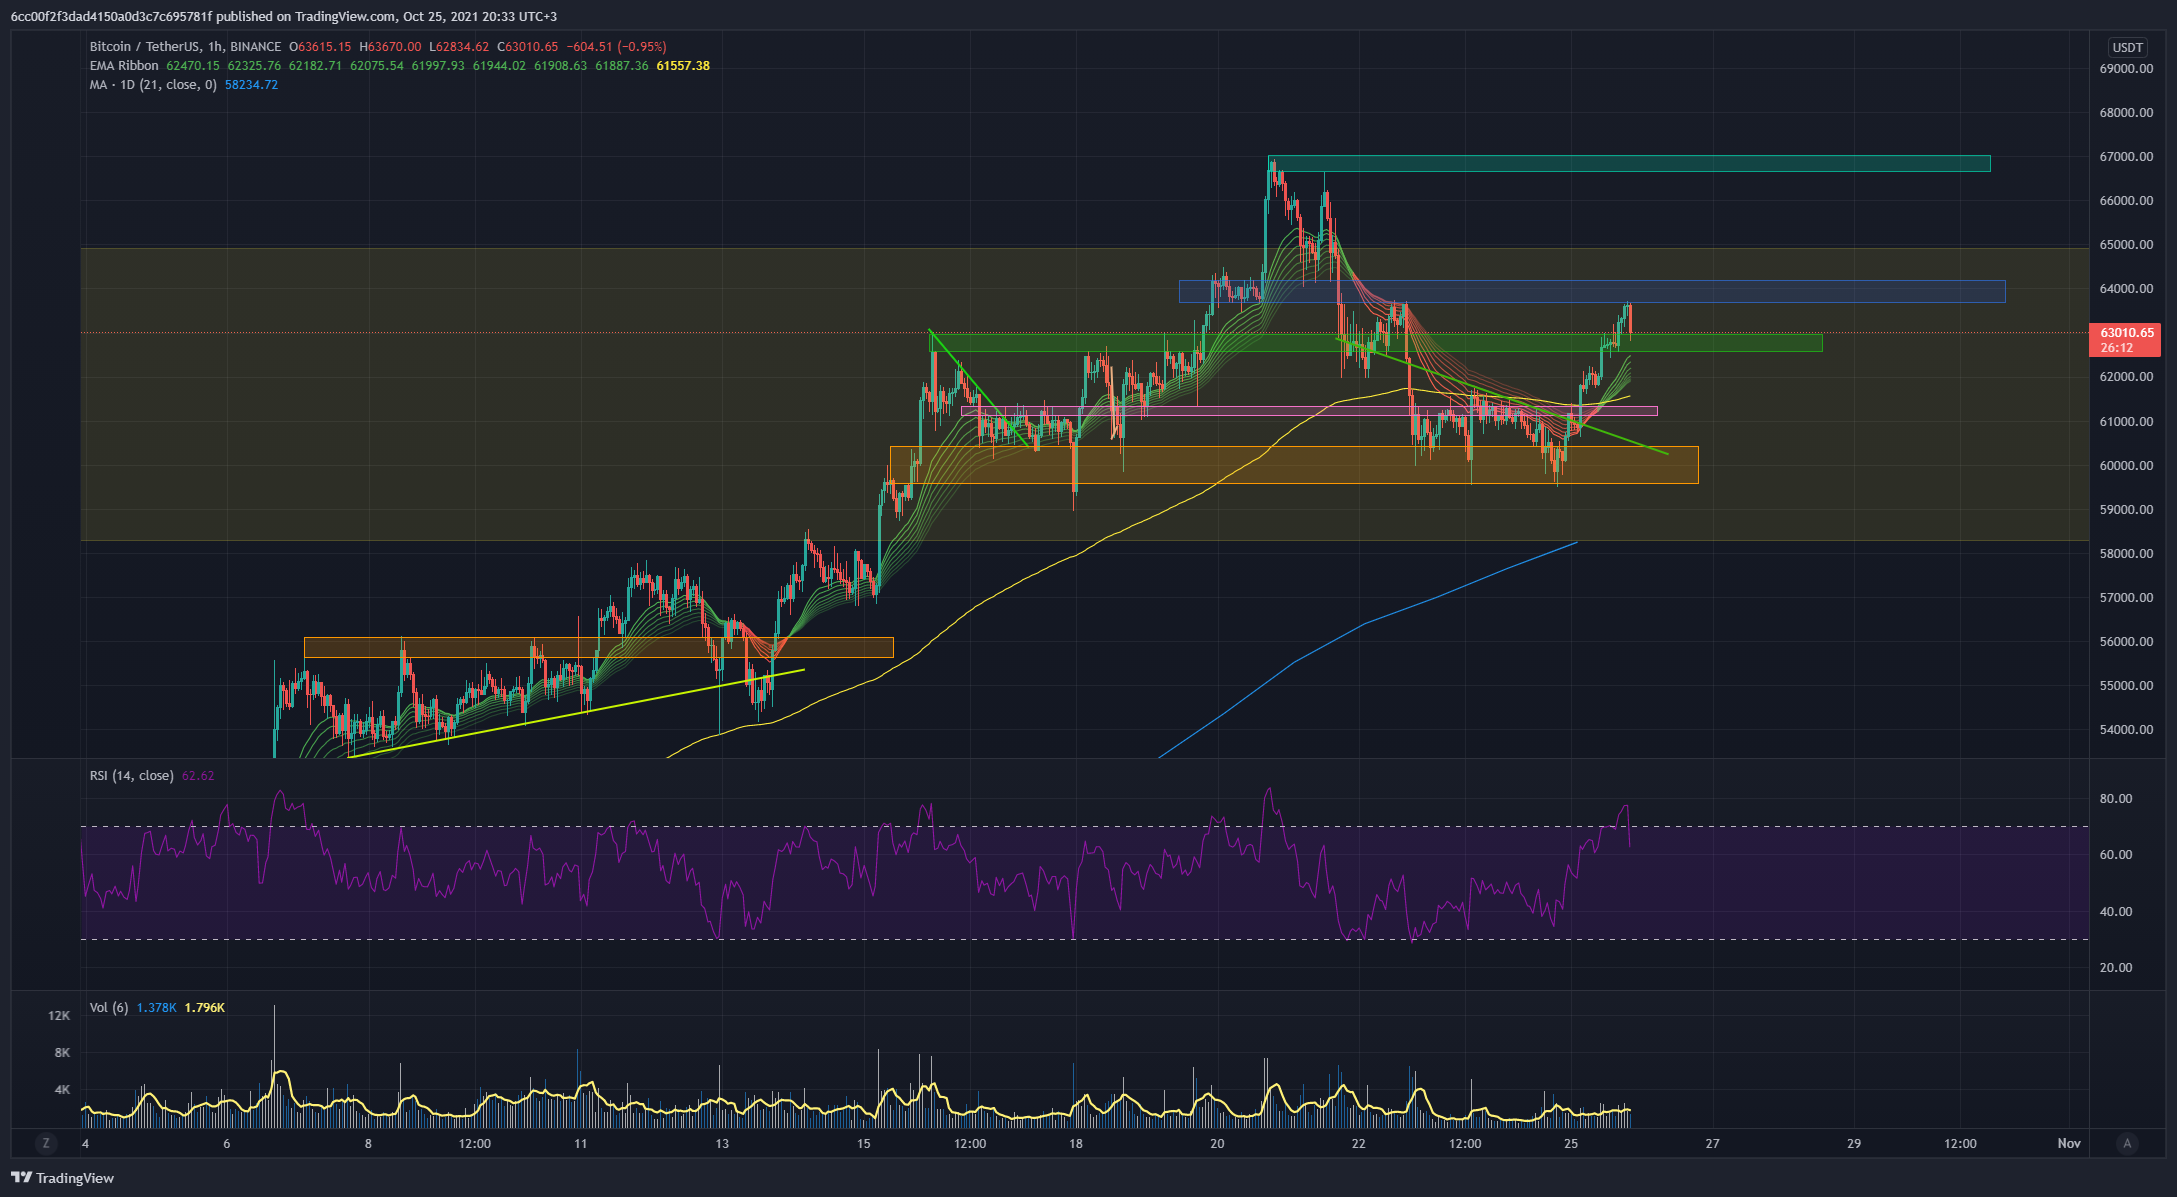
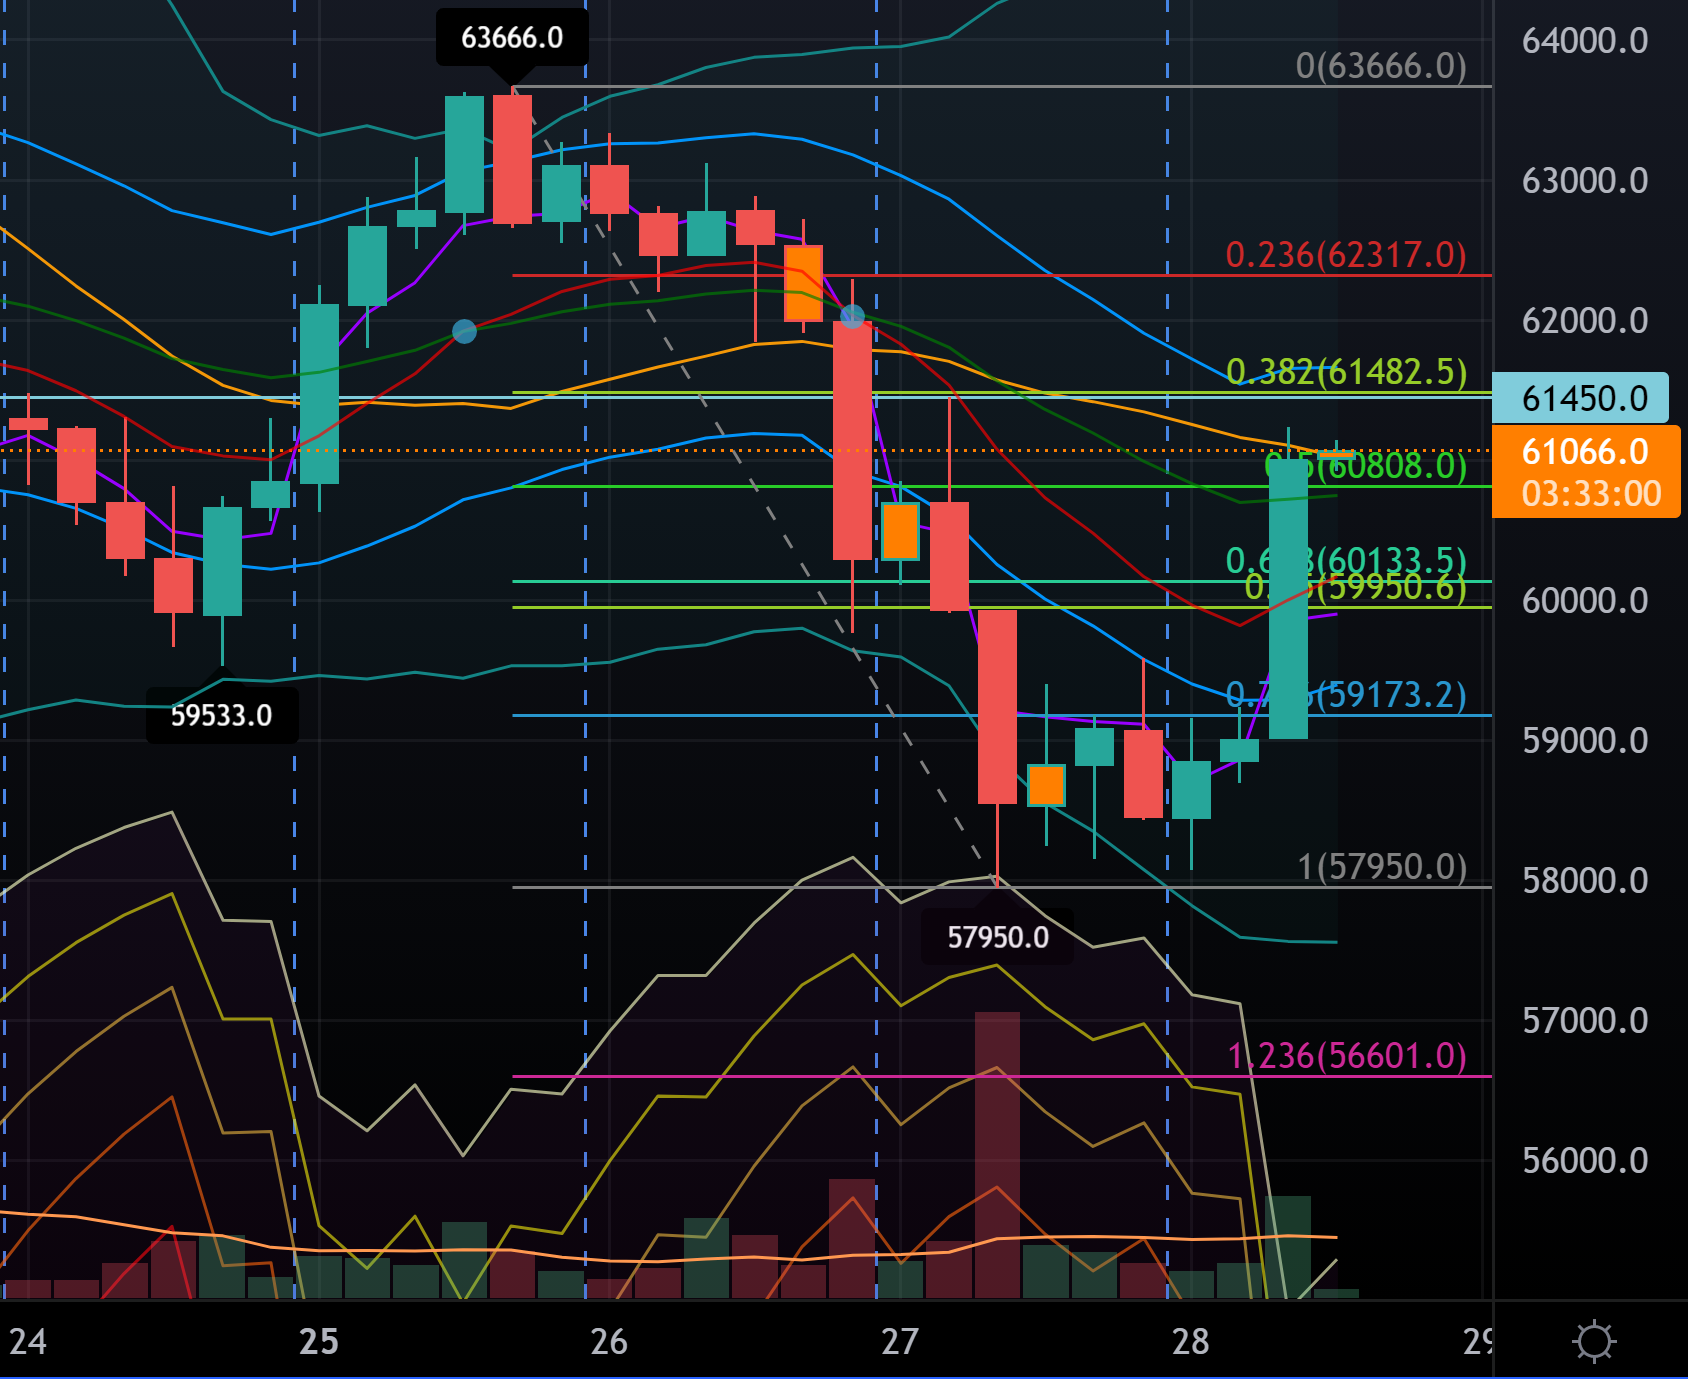
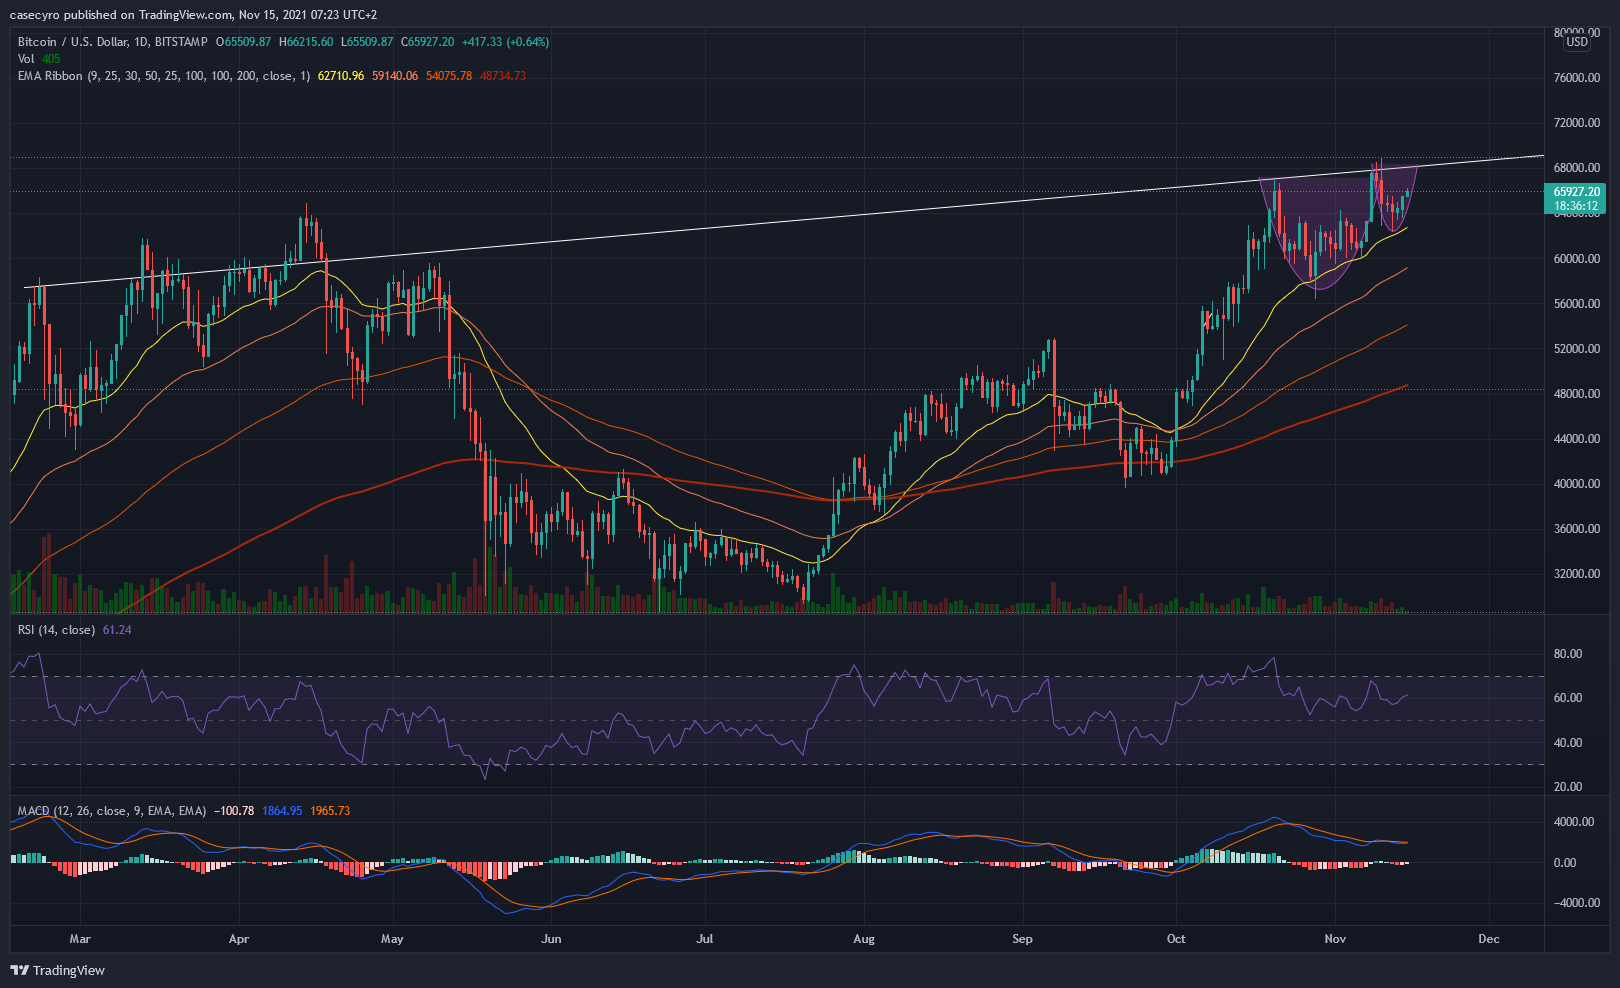
To celebrate the new thread, here are my even more bullish views on BTC’s candles than Bull Mentula. Actually, the 1-hour candles look very interesting based on the RSI. At the $63,700 level, we hit a blue resistance box, which has previously supported and resisted the price. The RSI on the hourly candles is almost 80, from which it has corrected slightly downwards. Usually, such numbers for the hourly RSI have indicated a top as the overbought market begins to stabilize.
If, in the upcoming short-term correction, the green box below the blue box manages to support the price, I would guess that the $63.7k level would next be broken with new force, after which we would probably test the previous ATH readings in the turquoise zone. However, in this scenario, it would probably take a couple of days to fluctuate between the $63k and $63.7k levels.
Regarding this possible retesting of previous ATH levels, I wouldn’t be afraid at all even if the ATH resistance was too much and the price corrected downwards somewhat in a C&H theme.
In addition to a very bullish perspective, one could also consider a bearish scenario, where the price still corrects significantly lower, perhaps to the 21dMA. When examining the volume of different brokers, in this latest rally that started in August, the volume has not shown the same retail frenzy as last autumn. Perhaps the demand has come more from the institutional side?
It would be easier if I could see the timeframe, but it looks like 4H. Too unclear in my opinion. What is clear, however, is that daily support at 59533 (Bitfinex) was broken and we moved into a daily downtrend, meaning weekly consolidation is ahead. We barely touched 4H OS, but the bounce that followed has been very weak so far. Further decline is possible, hourly is a bear flag. A 15min TC (trend change) and an EMA12 breakout would be needed next.
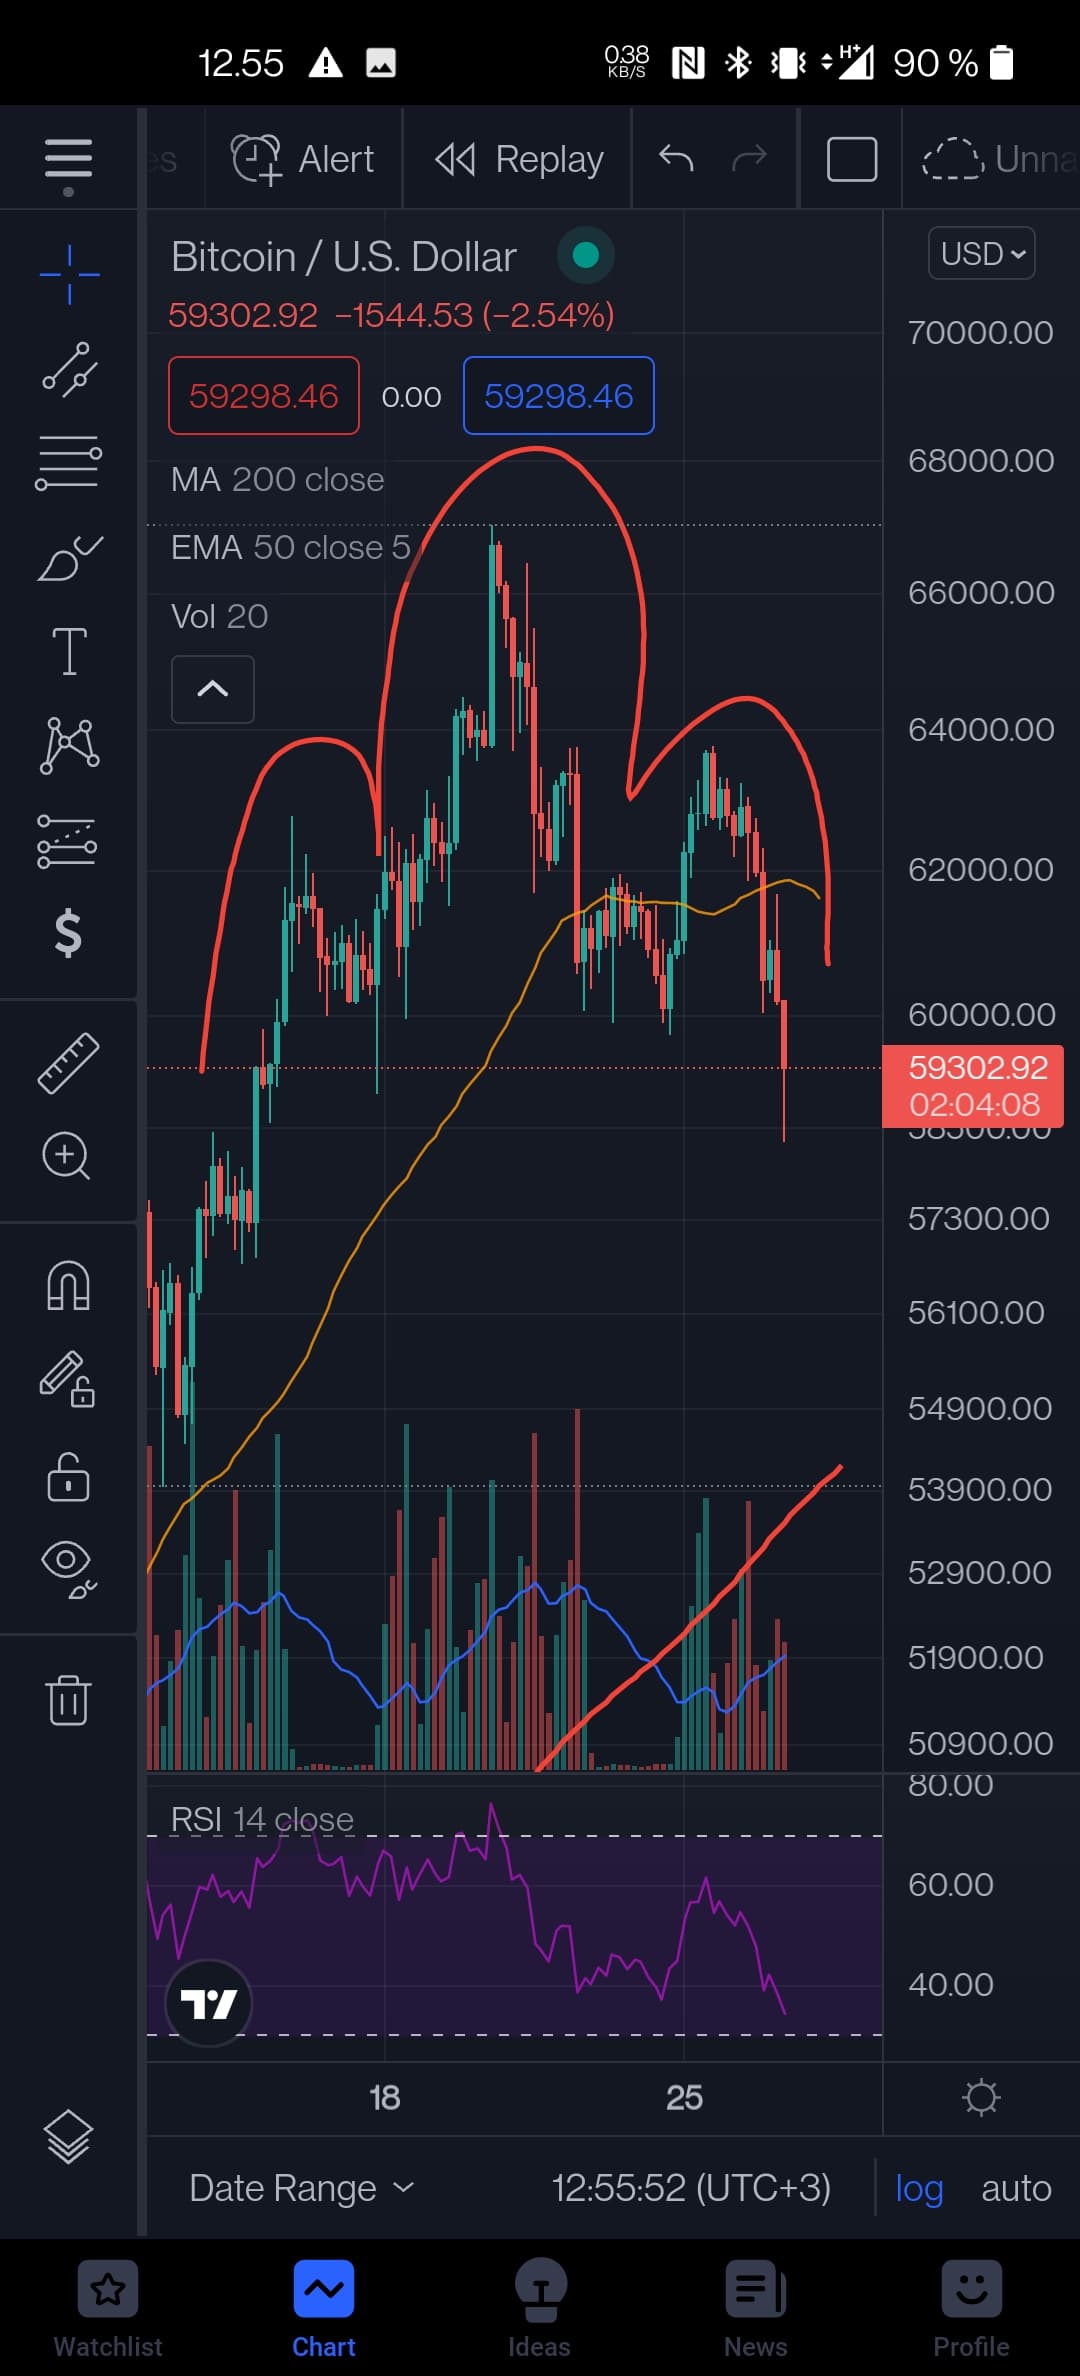
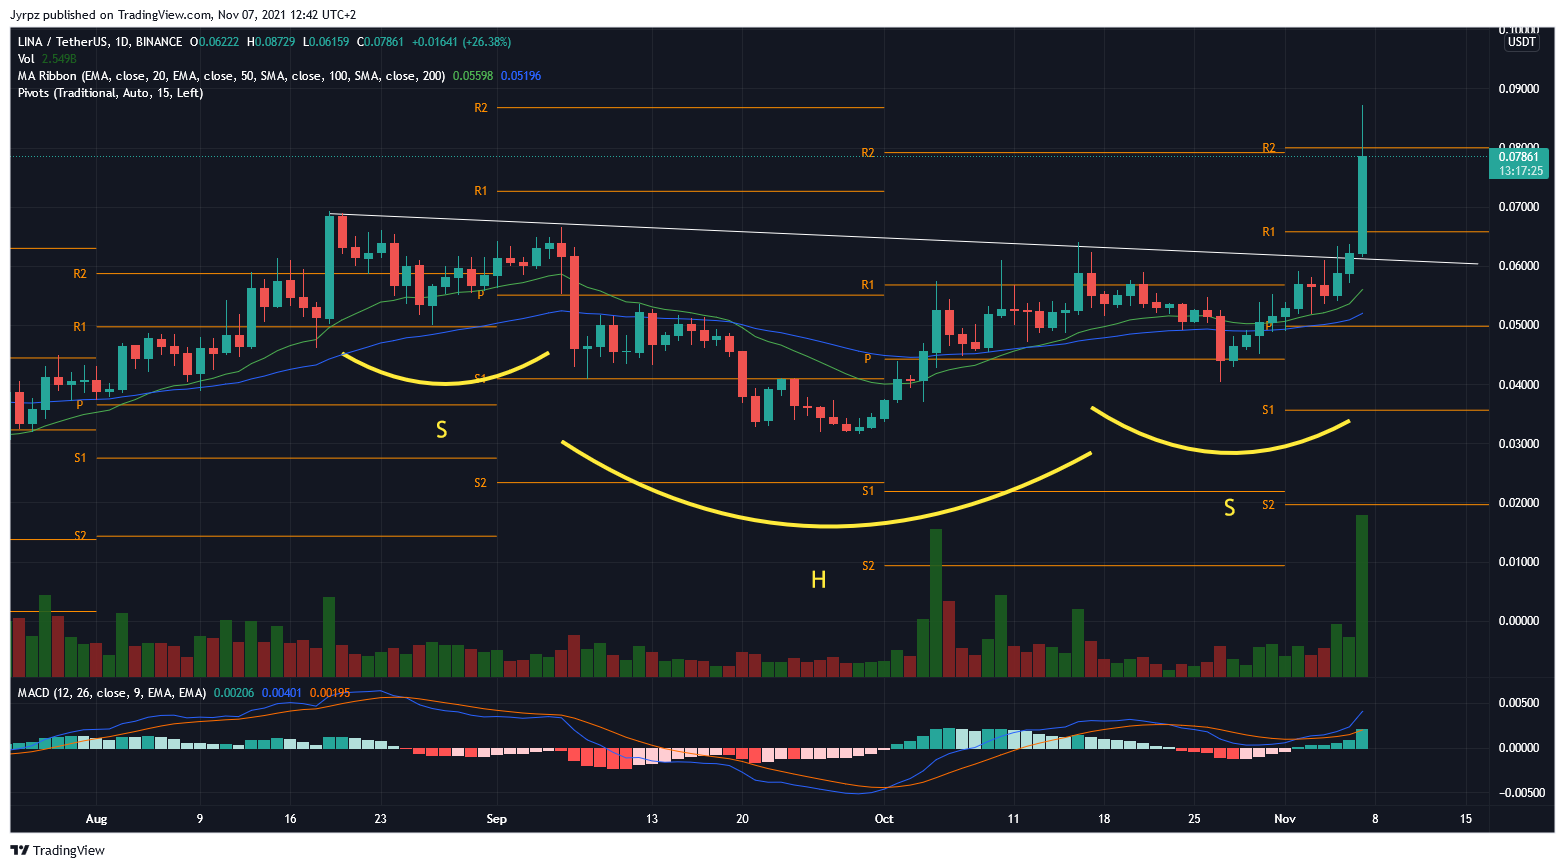
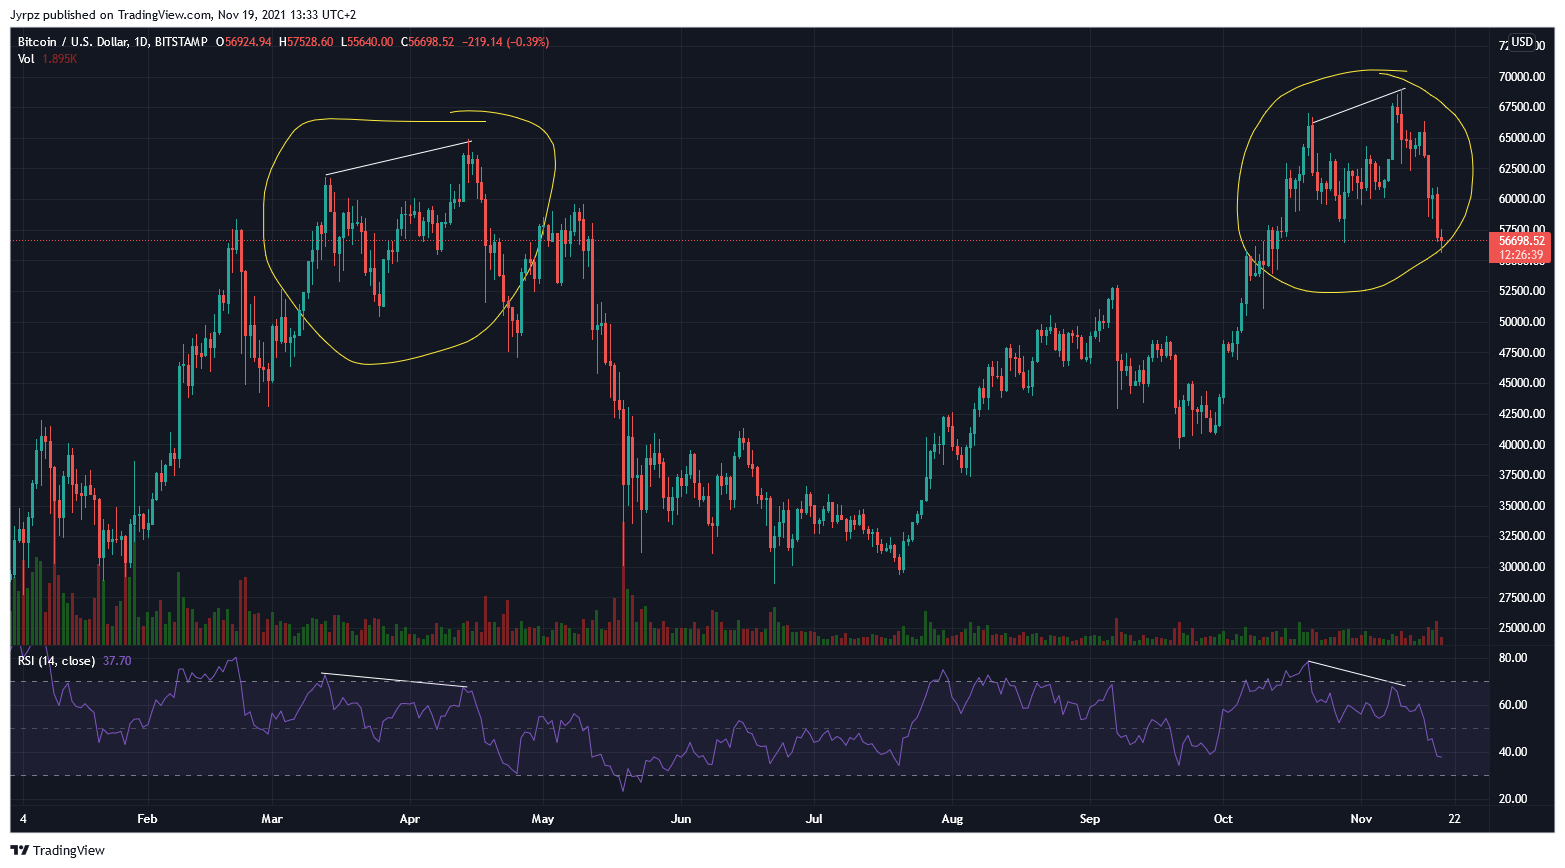
That could very well be a H&S (Head and Shoulders pattern). Based purely on my own feeling, H&S is a bit tricky because it’s actually easy to see whenever you just bother to dig out the right spots on the curves.
Somewhat, I would personally like the H&S to represent the current situation more clearly through volume as well. I would like the three peaks of the H&S to more clearly reflect the market situation; three times peaks are taken from about the same level, and on the third time, sellers take the initiative from buyers before new peaks are formed.
In the current situation, I only see peaks followed by a correction downwards for that week, as always after significant peaks are taken. RSI on daily and 4h levels is starting to be at typical target figures for a correction. I could cautiously estimate that the greatest momentum of the correction is behind us. However, I could very well be wrong.
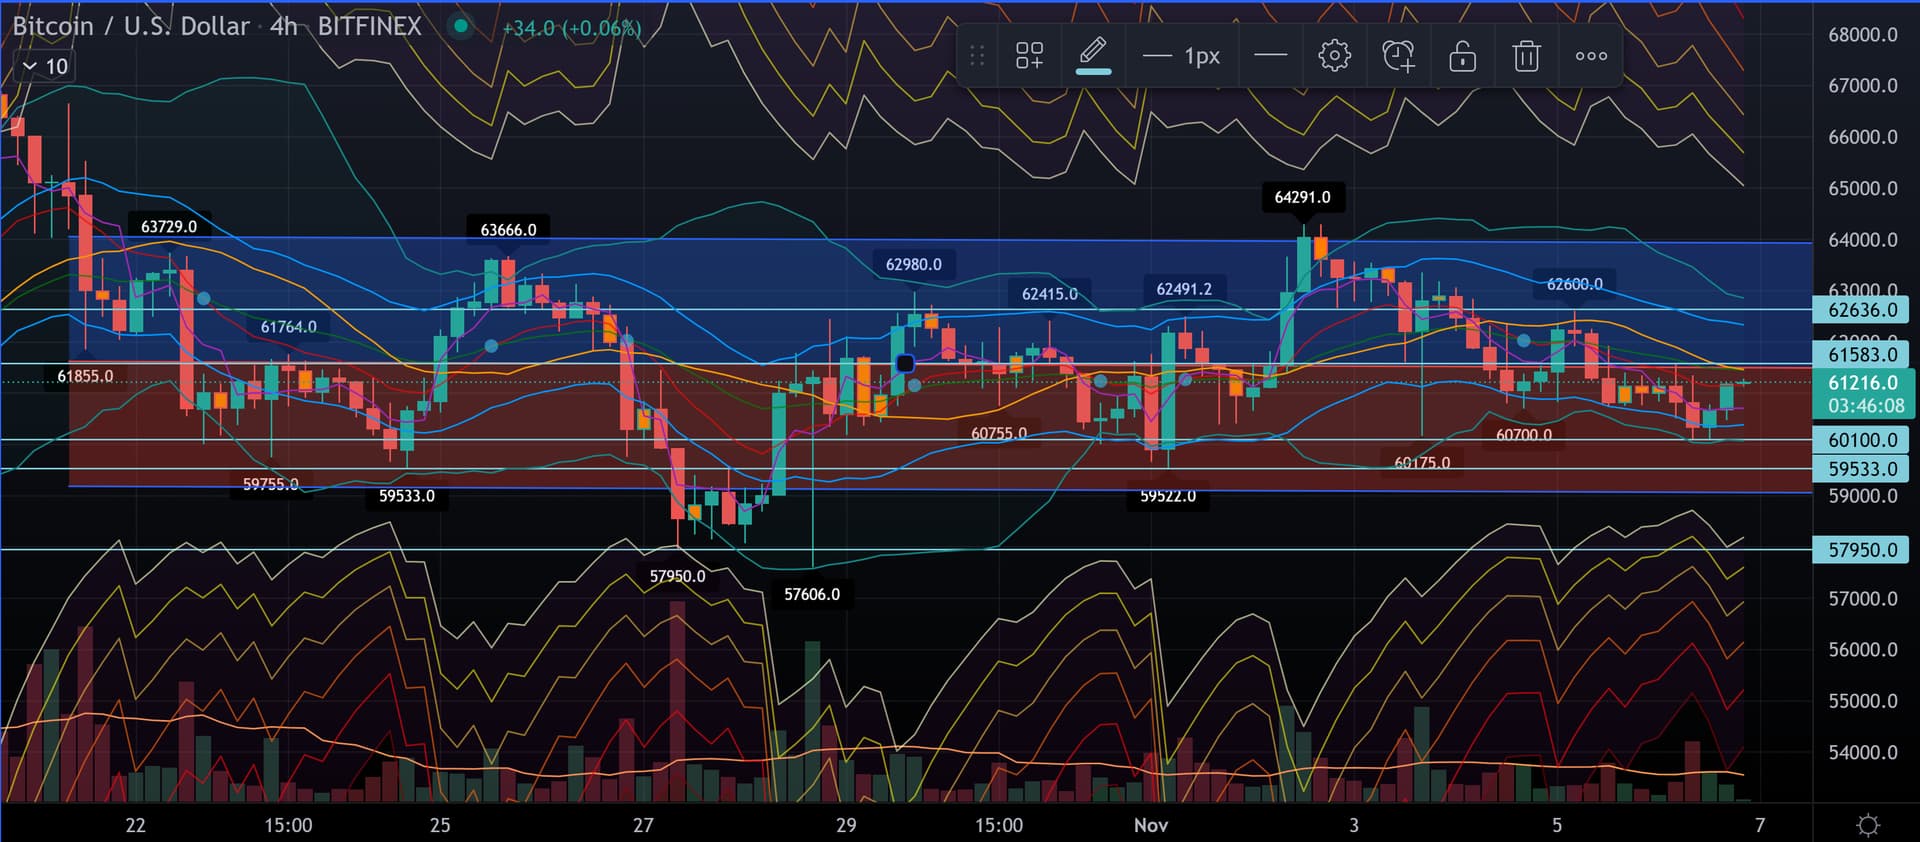
Times have changed, we no longer see V-shape recovery bounces. Today at 11 AM, a stronger buying wave began, causing the bounce to rise above fib 0.5. Next, we wait to see how far a potential 4H lower high forms. The previous daily LH is 61450. Breaking that would already show strength before cooling down (chart 4H).
Well, it depends on how you look at it. In my opinion, a V-shape recovery bounce only indicates an overbought market condition, which always resolves with a sharp downward movement. Temporarily, such a recovery is quite bullish, but within a couple of weeks, the underlying overbought condition usually starts to unwind.
I would consider a correction lasting one to two weeks, where the biggest selling pressure has already been seen, to be very bullish. This would be quite normal after new All-Time High (ATH) figures. By this, I don’t mean a continuous decline but rather steady fluctuation above previous lows (57k USD) and perhaps, at the end of the correction, a retesting of numbers starting with 5, from which momentum would then be gathered towards new ATH figures.
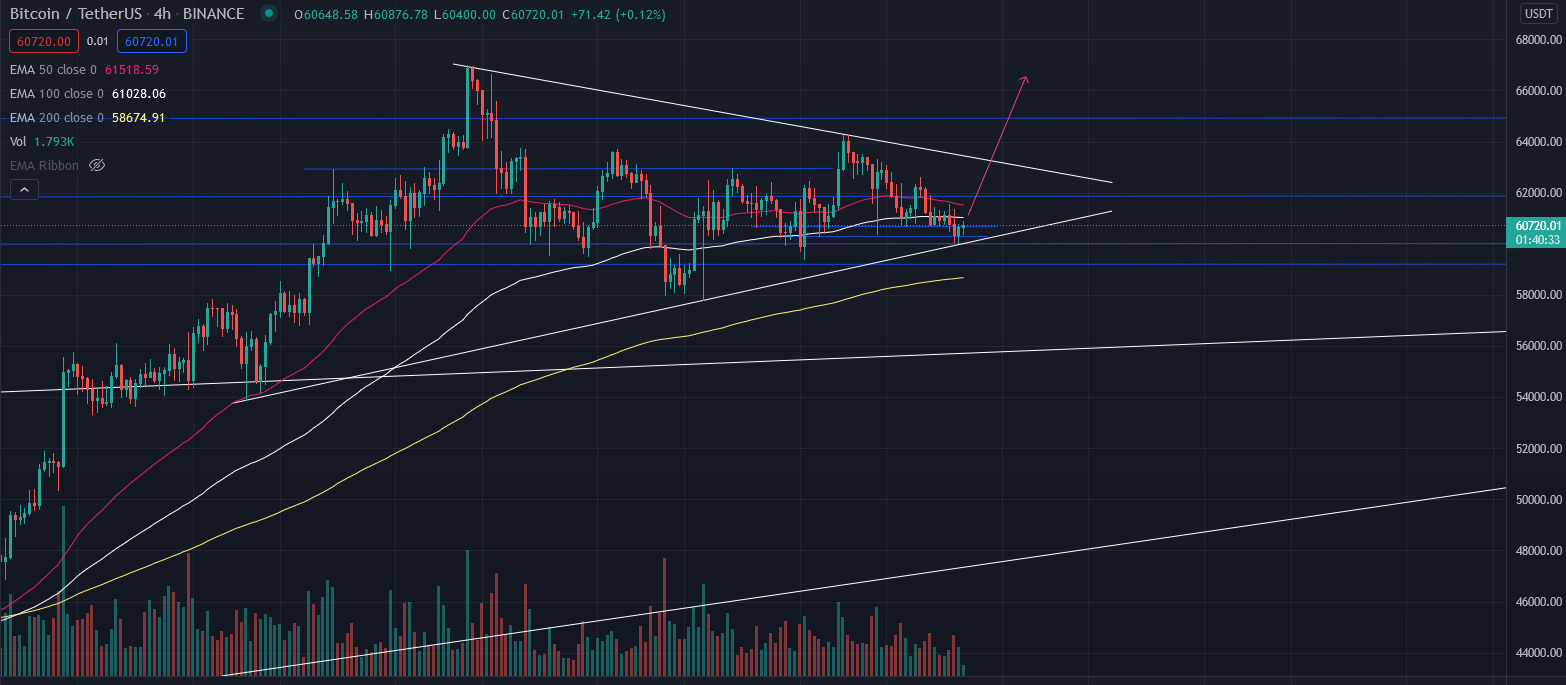
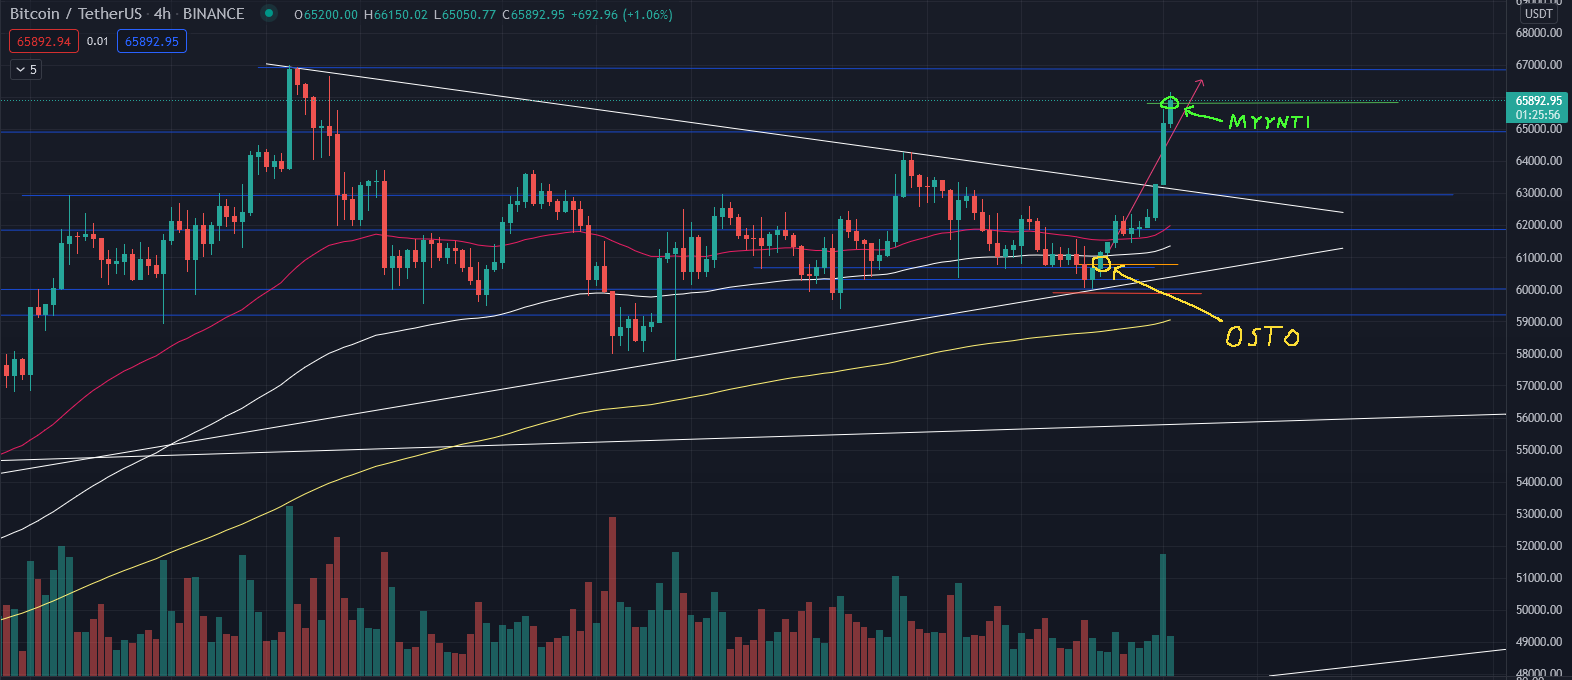
On Bitcoin’s 4-hour candles, my favorite pattern, the triangle, is visible. Since we entered it from an uptrend, there might be a chance to break upwards towards the previous ATH figures…
An update to my forecast from the night before last: Bitcoin indeed broke up from the triangle and posted some nice green bars on the 4-hour candles. I had a successful trade from this with a Stop Loss of -1.6% and a Profit Target of +8.0%, making it a trade with an excellent risk-to-reward ratio.
Next up, the previous ATH, or the $67,000 price level, will act as resistance.
After breaking out of the triangle, new ATHs (All-Time Highs) were reached beautifully. However, the correction was very strong, pulling the price down almost 10% on the same day. What’s happening now?
The upper resistance of the red triangle I drew now seems to be acting as support. The yellow descending resistance level appears to be forming a dWedge with the red resistance level of the previous triangle. New ATHs were made within this chart, but I don’t think that’s misleading, because the momentum was too weak.
Currently, BTC is characterized by the price hitting against descending resistance levels (yellow lines). After a breakout, these yellow levels I drew may or may not act as support.
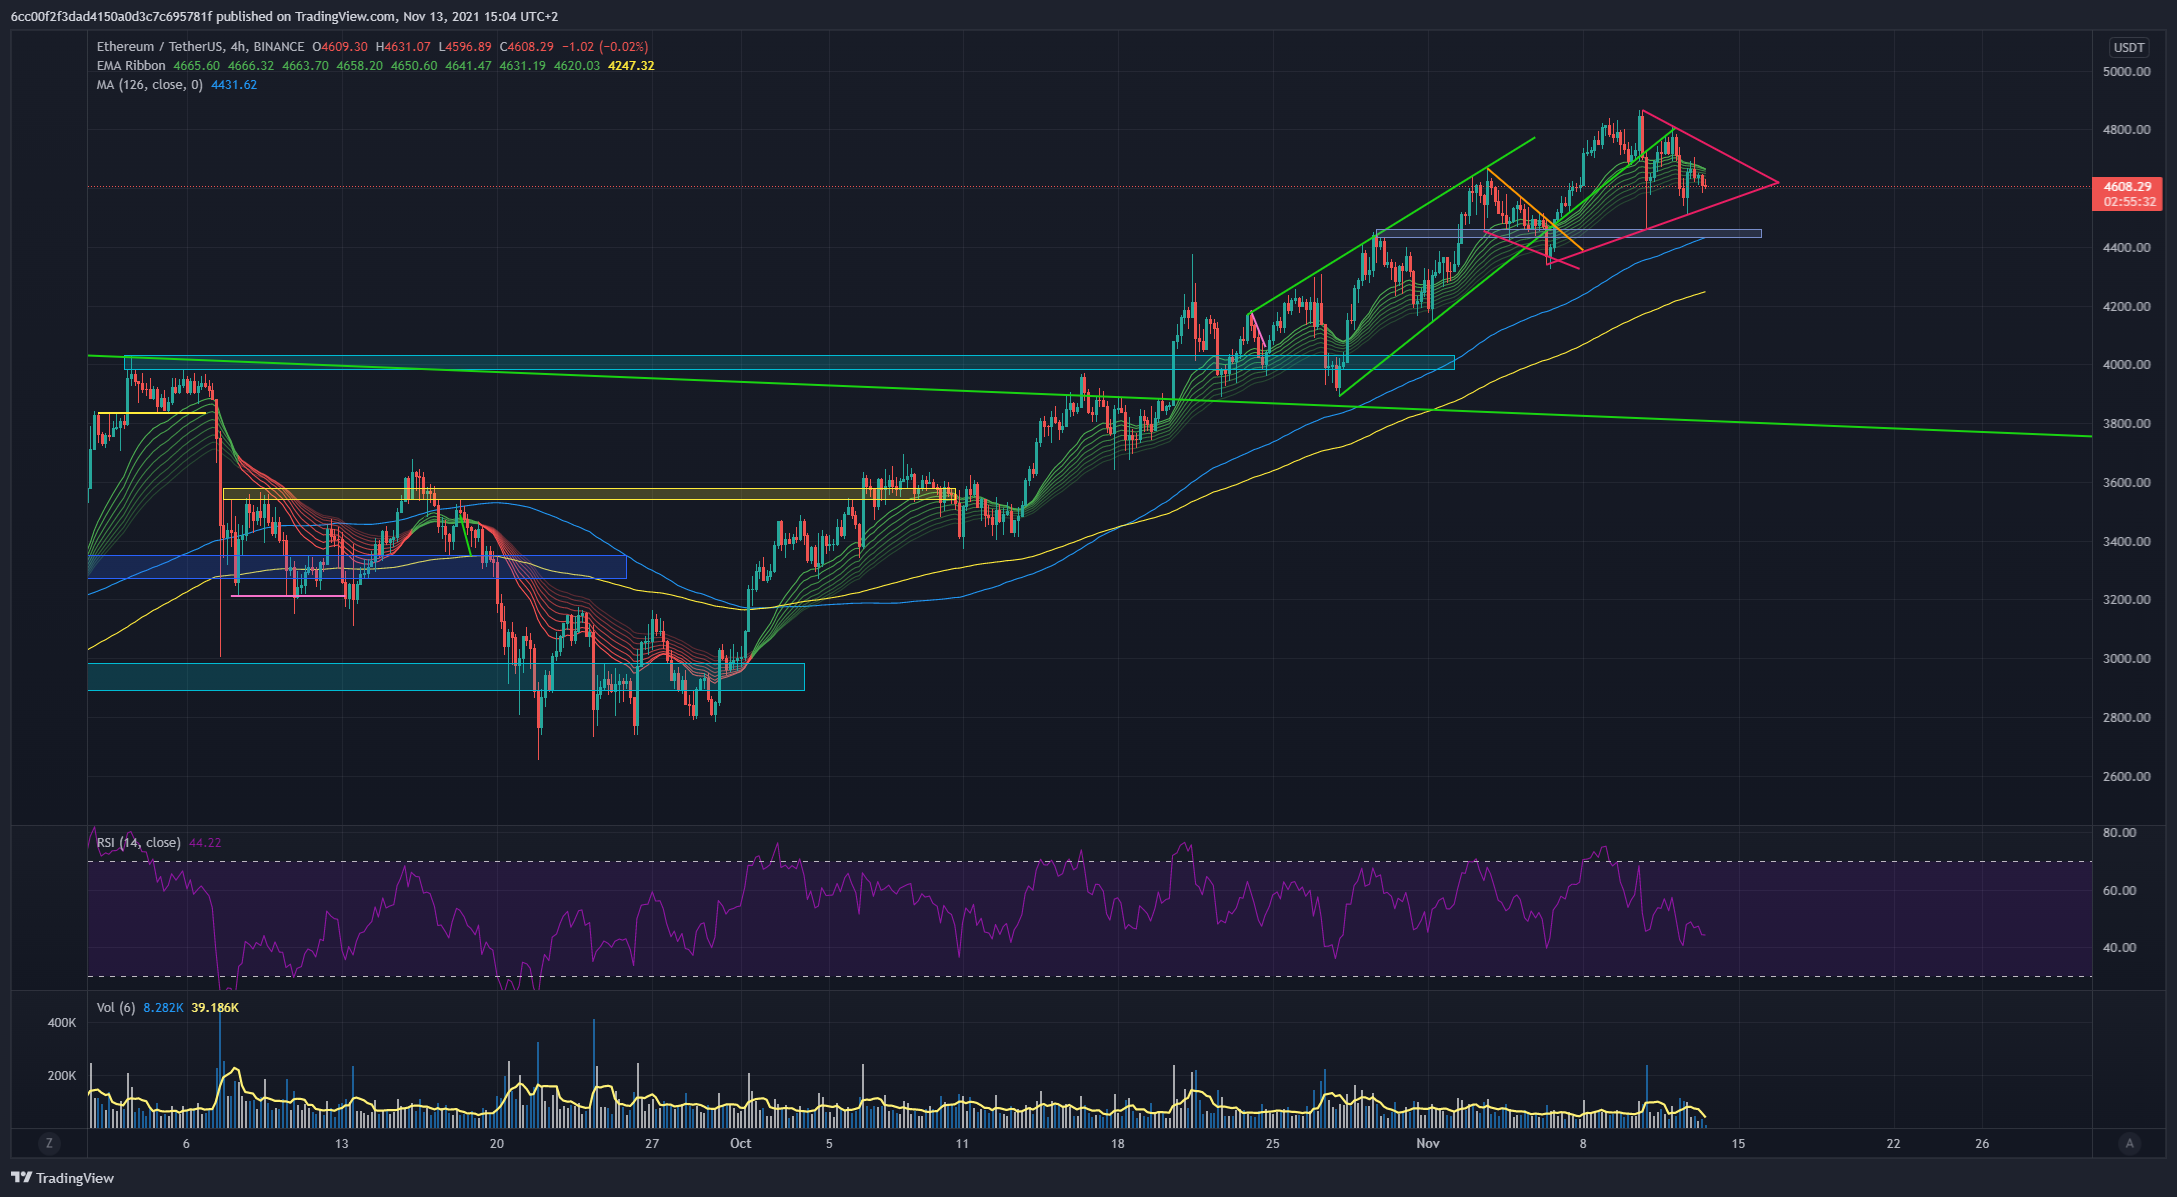
What do the curves currently tell the bulls? Possibly, the descending fan will break within a couple of days. In principle, this chart would be bullish in nature. In the most recent correction, the 21dMa seemed to support the price. In principle, the price could even dip below the 62k USD level to gain strength.
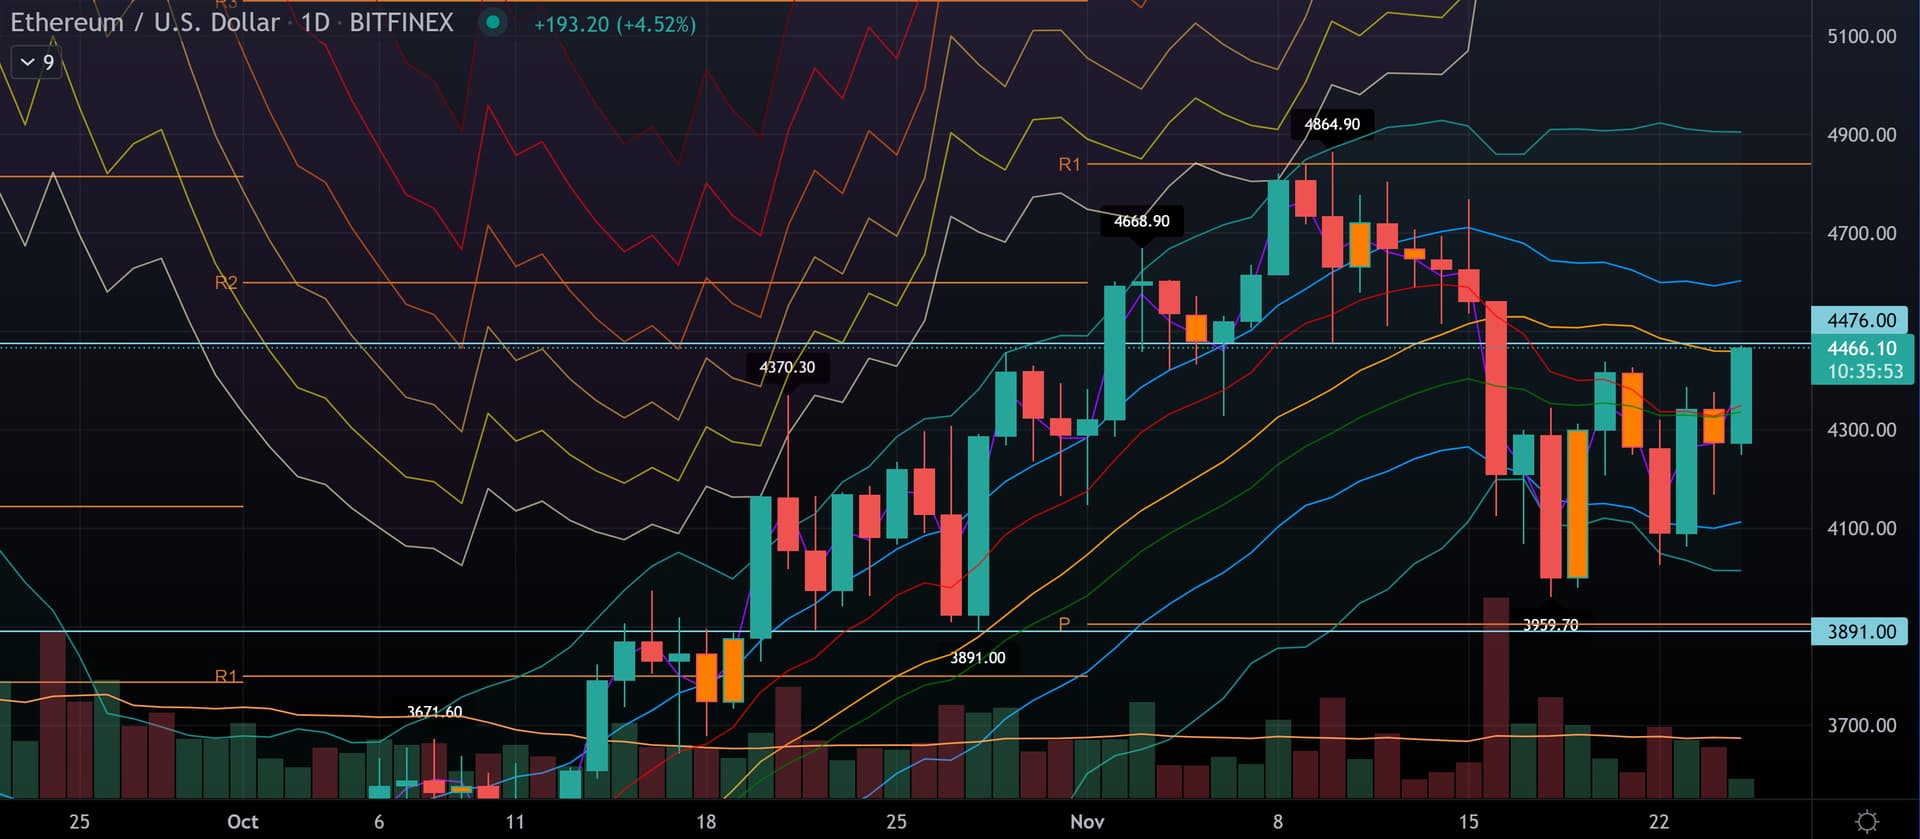
From the perspective of BTC’s price, Ethereum’s behavior within the red fan looks very interesting. ETH and BTC seem to be living the same life, meaning investor attention is in both of these in a reasonably similar cycle at the moment. For example, this was not the case in the spring.
In my opinion, the market for BTC and ETH is not overheated. Price movements do not show manic behavior and the RSI (4h and 1d) are at a moderate level.
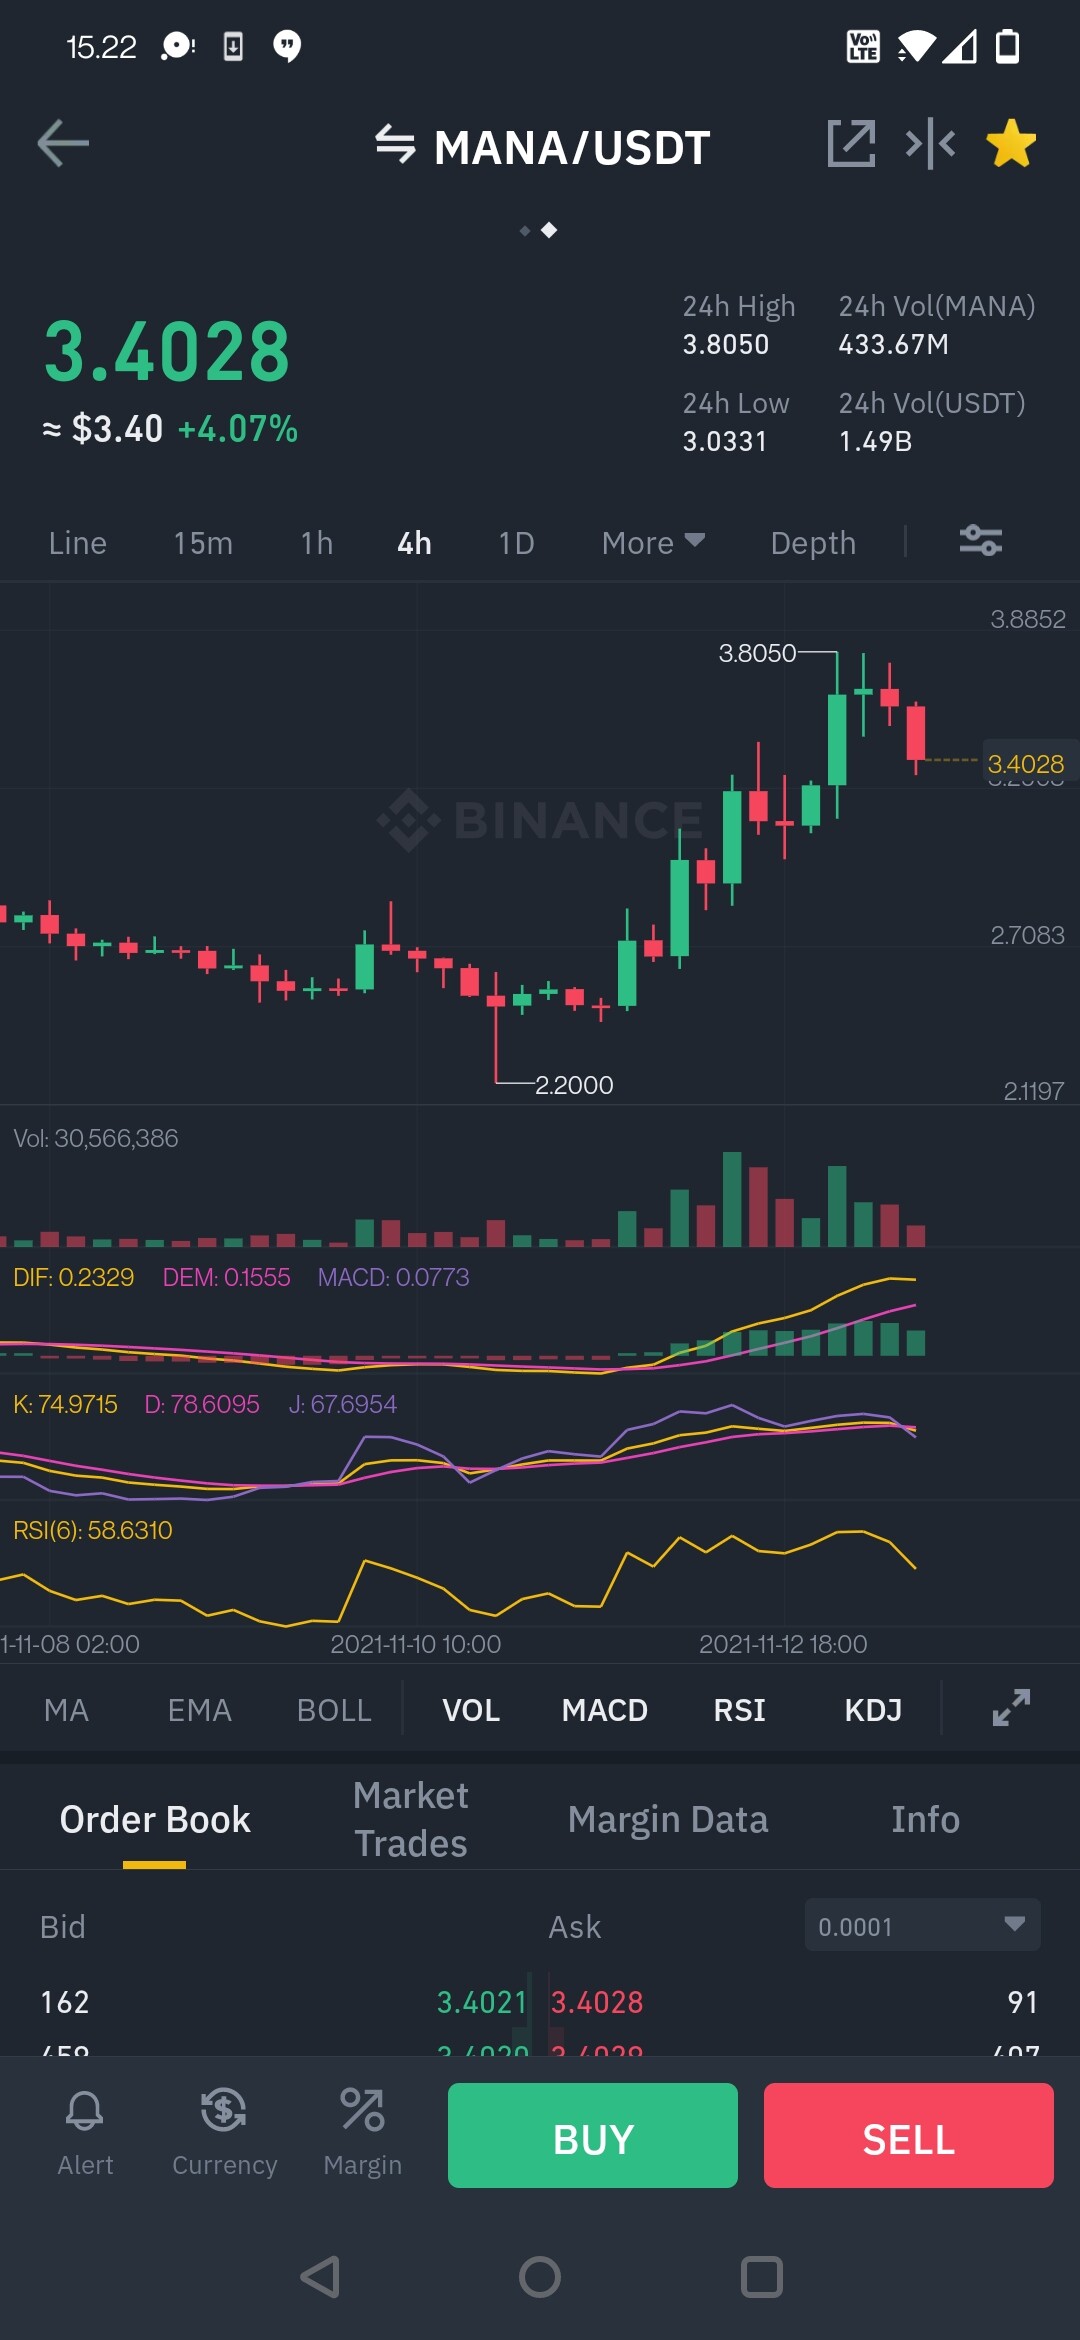
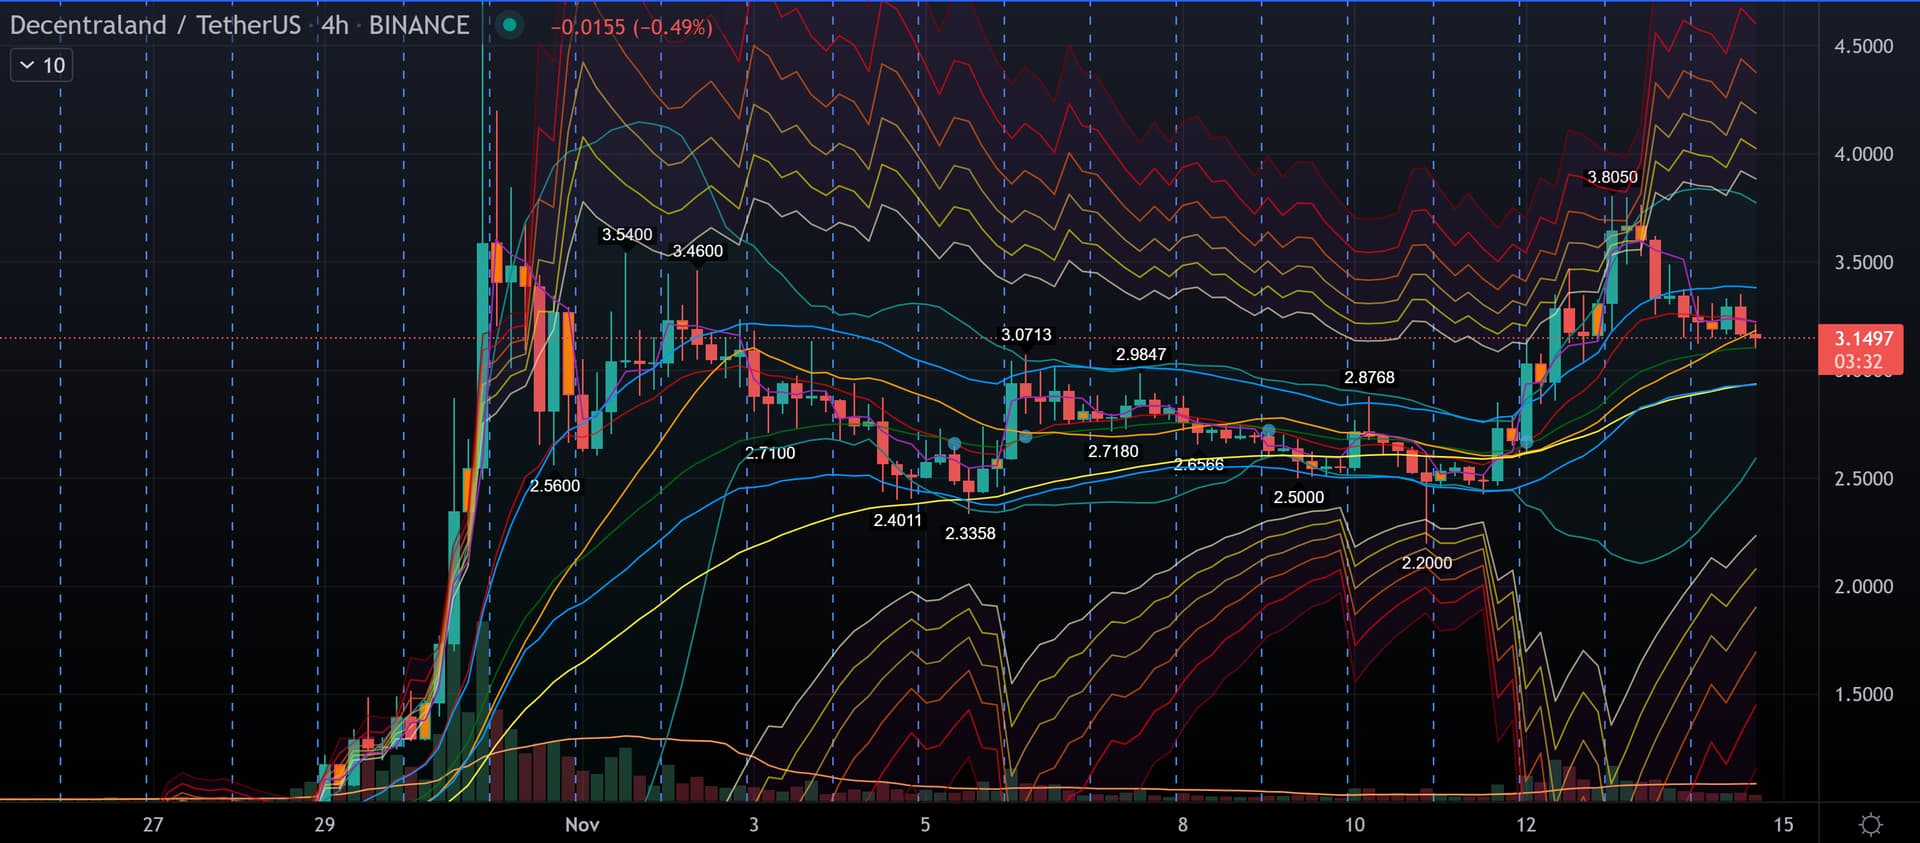
First, you need to define the timeframe you trade or invest in. Call it what you want. If it’s 4H, and you’re looking for confirmation of daily level movements, then MANA just dropped into a 4H downtrend. The break is still small, so we need to monitor whether it was just a stop-loss hunt or if a larger correction is starting. For development, a daily HL is sought, but it’s not about the level it forms at or whether the previous 2.2 might even be broken.
Whether we go up or down is a completely irrelevant question. For these current hot stocks, additionally: SAND, LRC, KEEP, ALGO - you name it - sharp movements are typical. They have entered the genre in a short time. And new ones seem to be constantly coming, and those were just a few of the ones that generated more trading volume. If I didn’t understand TA, I would focus on securing profits rather than thinking too far ahead.
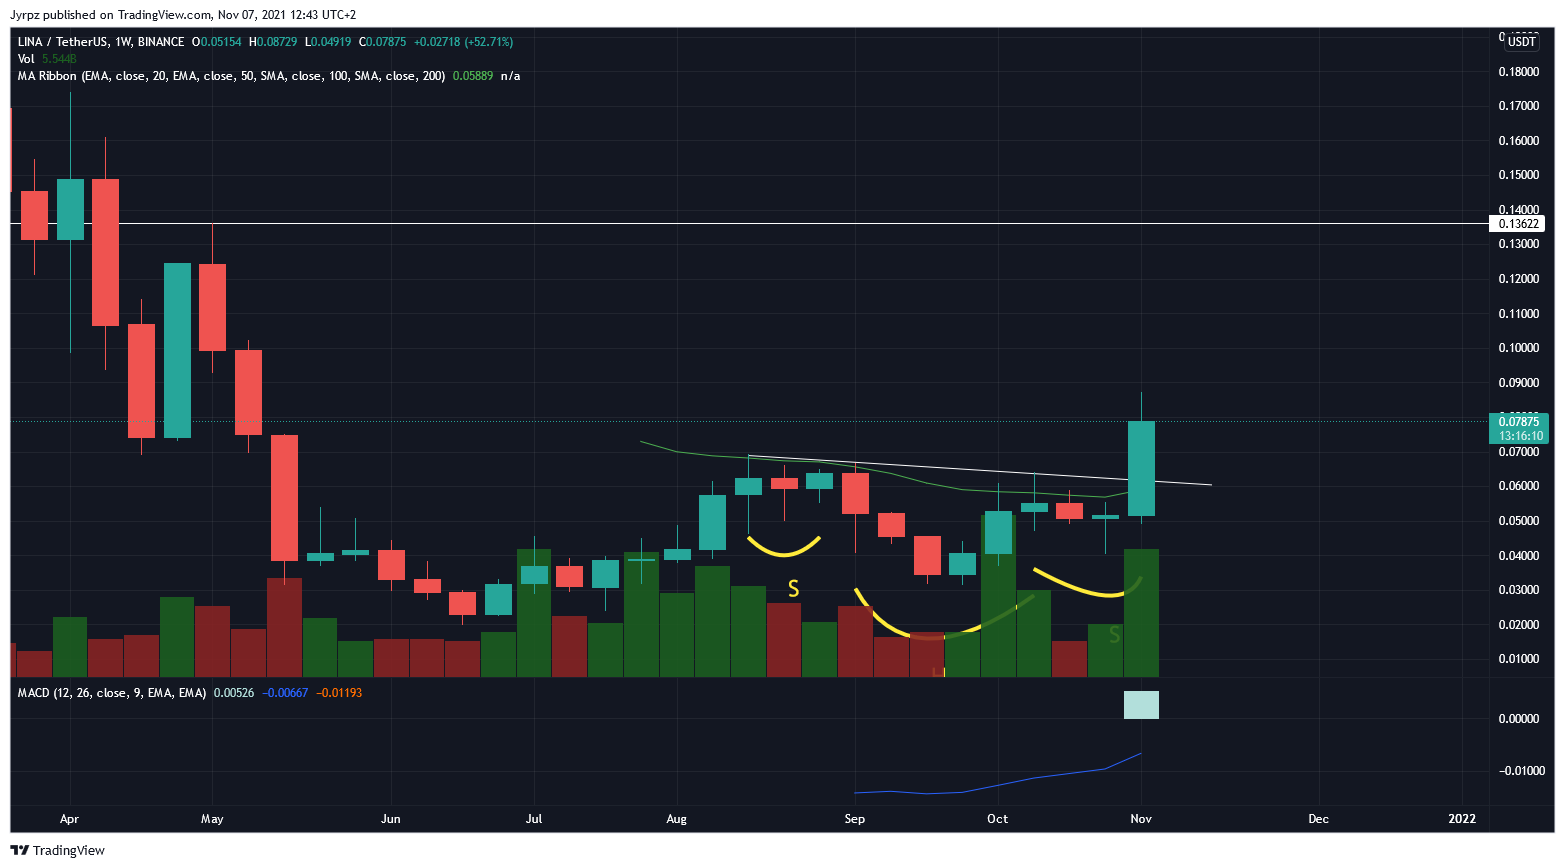
The most enlightened among you correct me if I’m wrong, but could that be interpreted as a C&H (Cup and Handle) pattern? The edges of the cup are not exactly even, but otherwise, the conditions should be met, right? If it materializes, it would break the level drawn from February, around which it has been fighting since last spring.
I’m also a diligent user of RSI. As is well-known, the RSI calculation formula compares the average rise and fall of candles over a 14-unit period. So, in principle, RSI doesn’t add any extra value to the candles themselves but certainly makes it easier to observe momentum.
In principle, RSI is very easy to assess just by looking at the candles, but it still tells a lot about the market’s state, and 4h and 1d RSI have historically given very good buy signals.
Signs of danger are in the air. BTC has once again moved in tandem with the stock market, where large tech companies have kept the markets afloat. BTC hit 12H oversold - weekly, daily, 4H down trend. The bulls still have a lot to do to turn things around, and what happens if the tech stocks falter?