This thread is for questions and answers regarding company X’s situation from a TA perspective. Questioners could kindly add a picture alongside the question, for example, of the company’s chart.
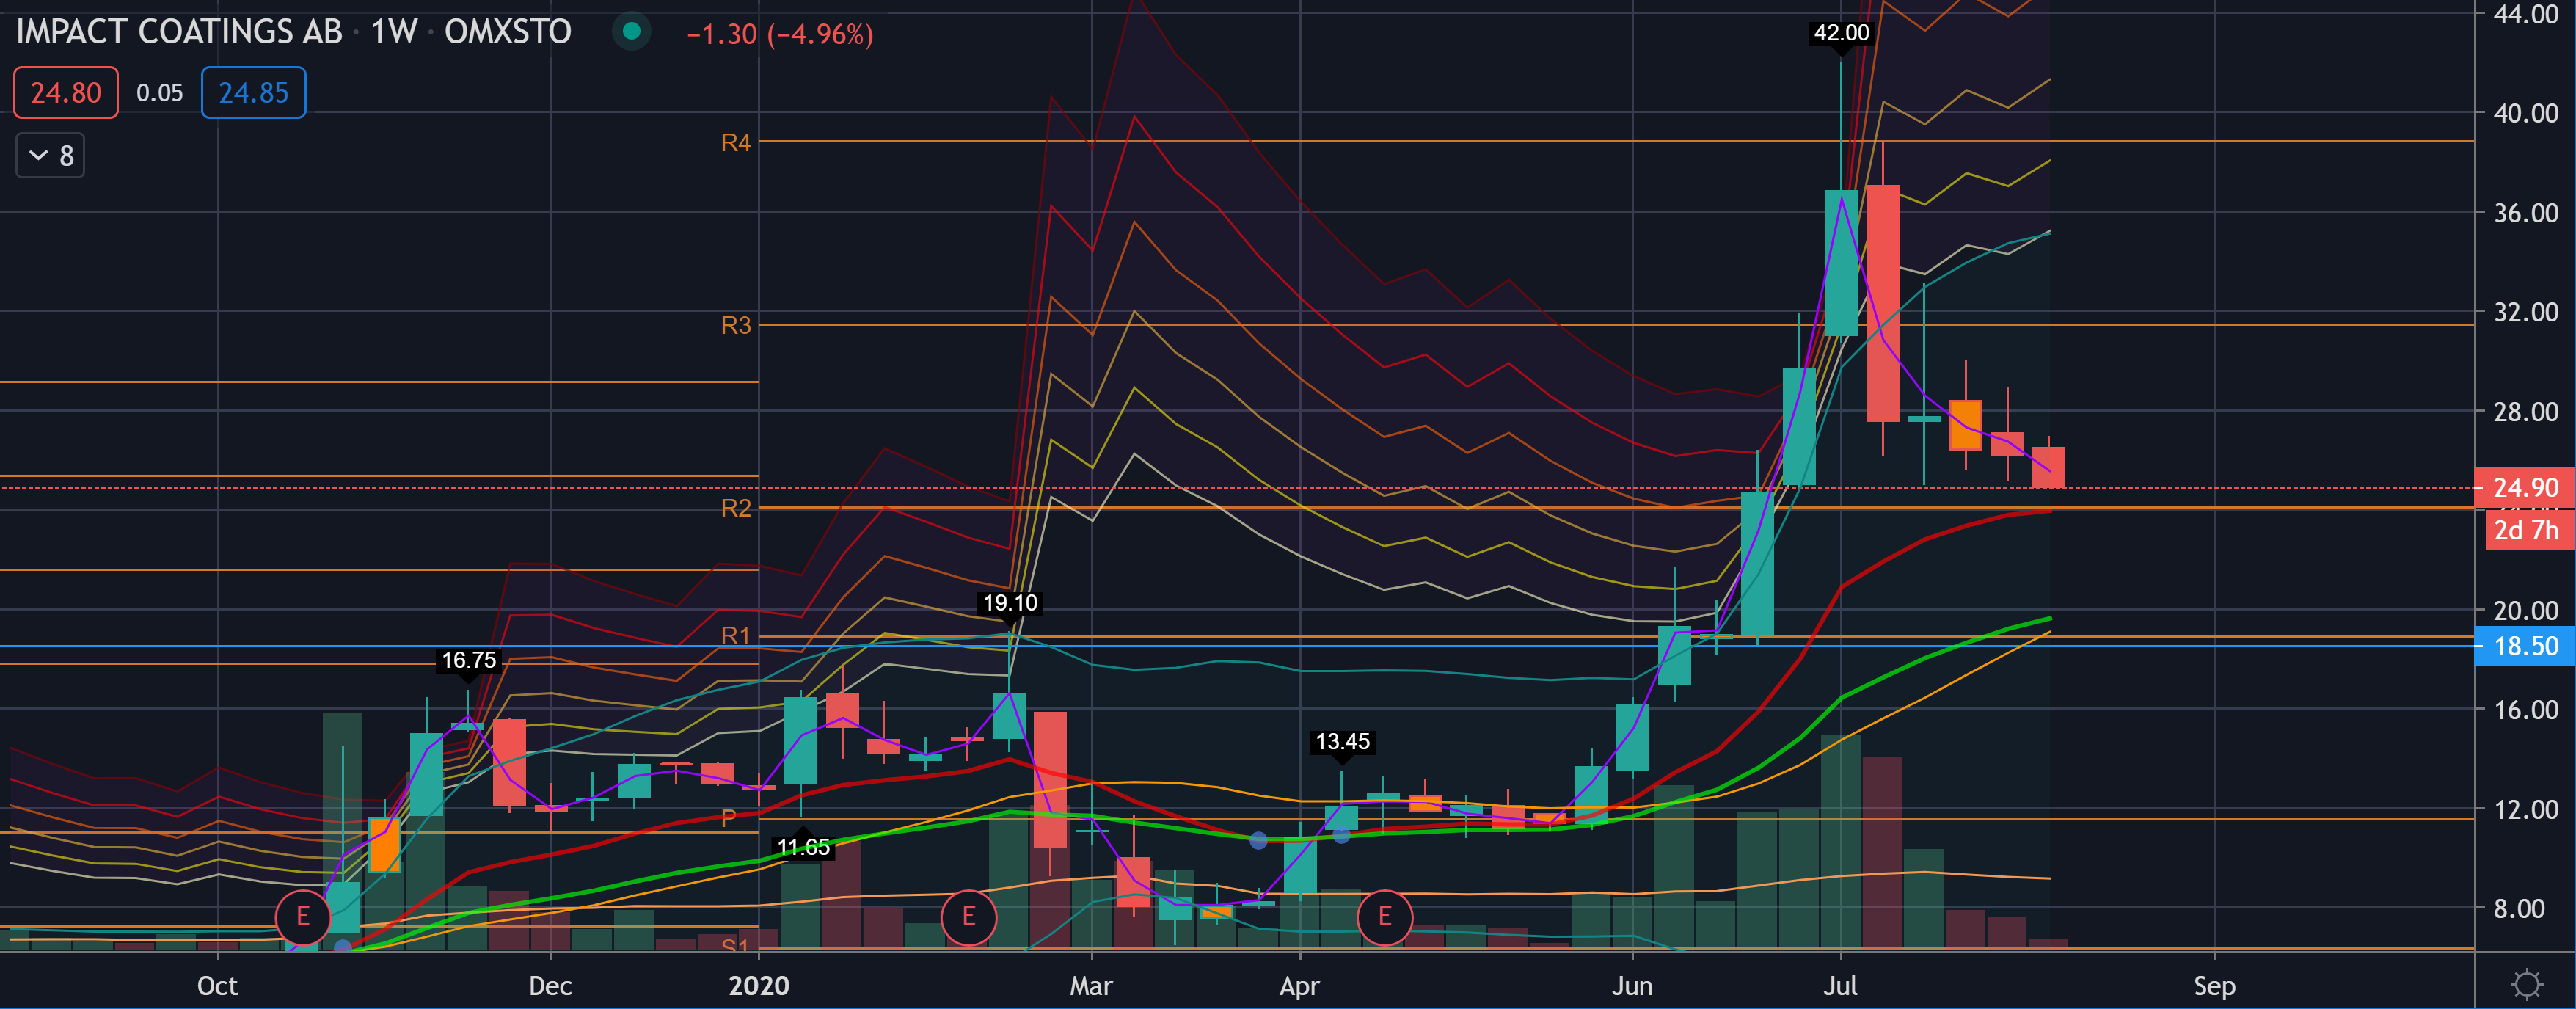
Daily support at 25 was just broken, and at the same time, the weekly downtrend began. Now, it’s significant how it continues - whether it remains temporary or if more selling volume comes in.
The closest support, EMA12, is at the 24 level, and after that, support is only found at 18.50. It’s about your own risk tolerance/appetite. You can follow the discovery of bottoms, for example, by looking for a trend reversal at the 1H level, which can predict the discovery of a daily-level bottom.
What about Powercell Sweden right now? There was some discussion about it in the TA thread a while back, but those levels seemed to have been broken, at least temporarily. I tried to look a bit and found some resistance around 280 SEK and support from below either at 250 or 270… But that lower end remained unclear.
After a longer decline, the price has been hovering around 260-280, with daily fluctuations of up to 4% continuously. Is there some kind of “search” for a change of direction coming, where a more significant breakthrough in one direction or another is expected?
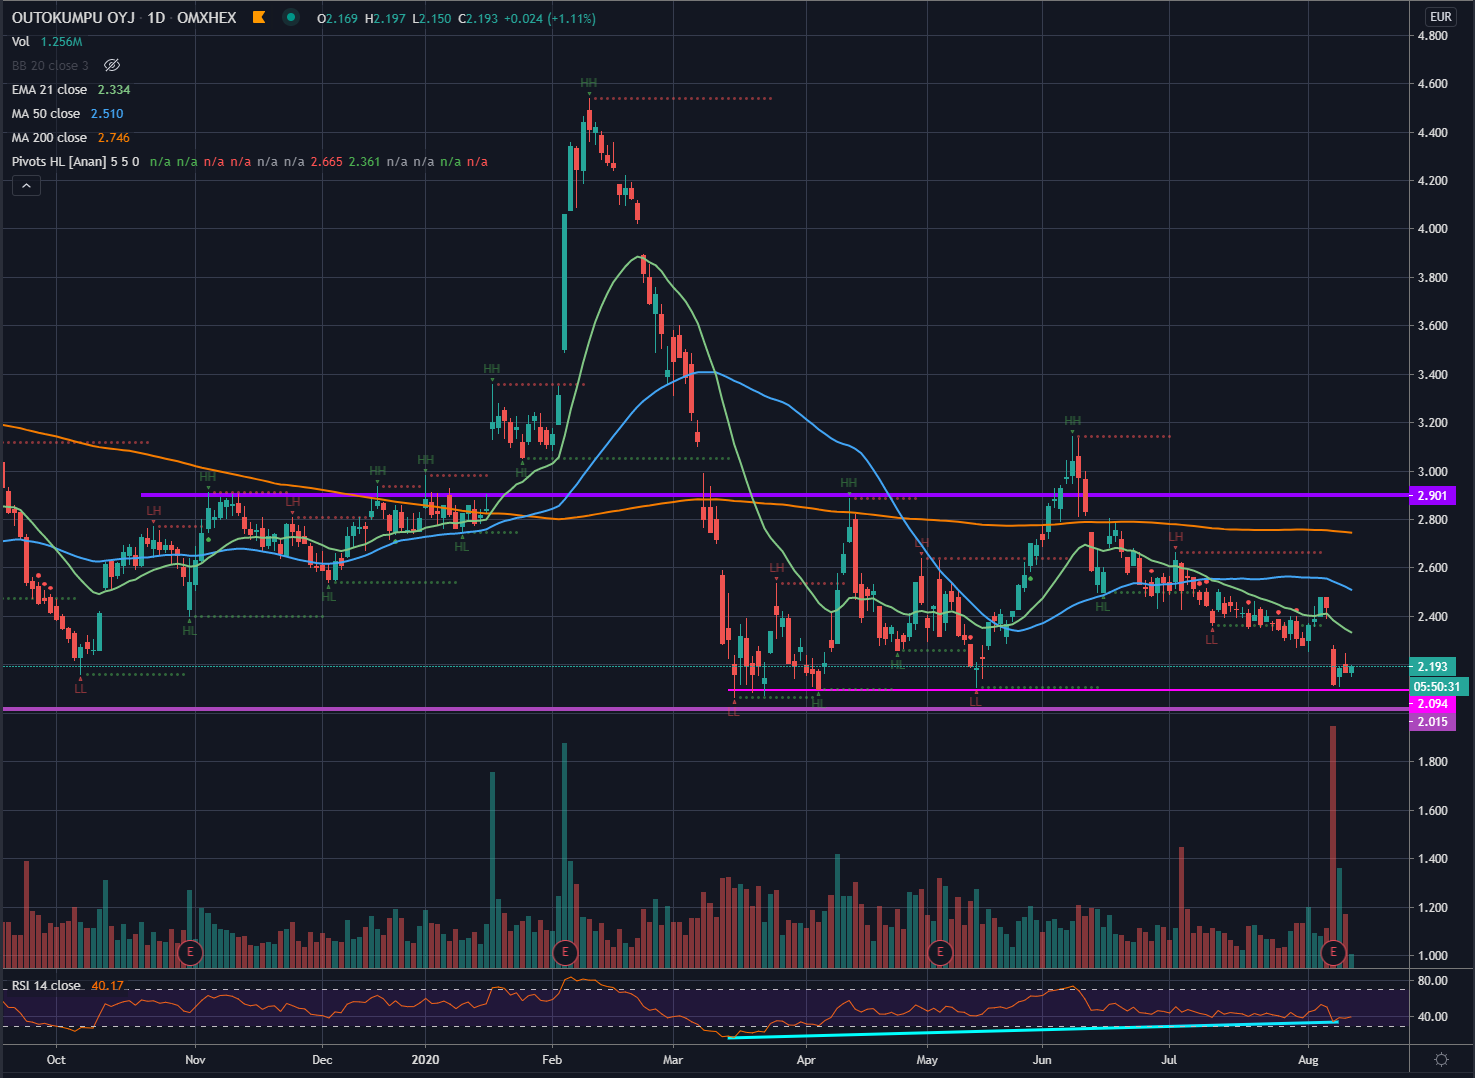
Outokumpu has strong support at 2.094 and a support level of 2.015 from four years ago. The RSI divergence signals an upward reversal. I already bought Outokumpu on Friday based on fundamental analysis (funda), and technical analysis (TA) supports this. Virtual stop loss at 1.90.
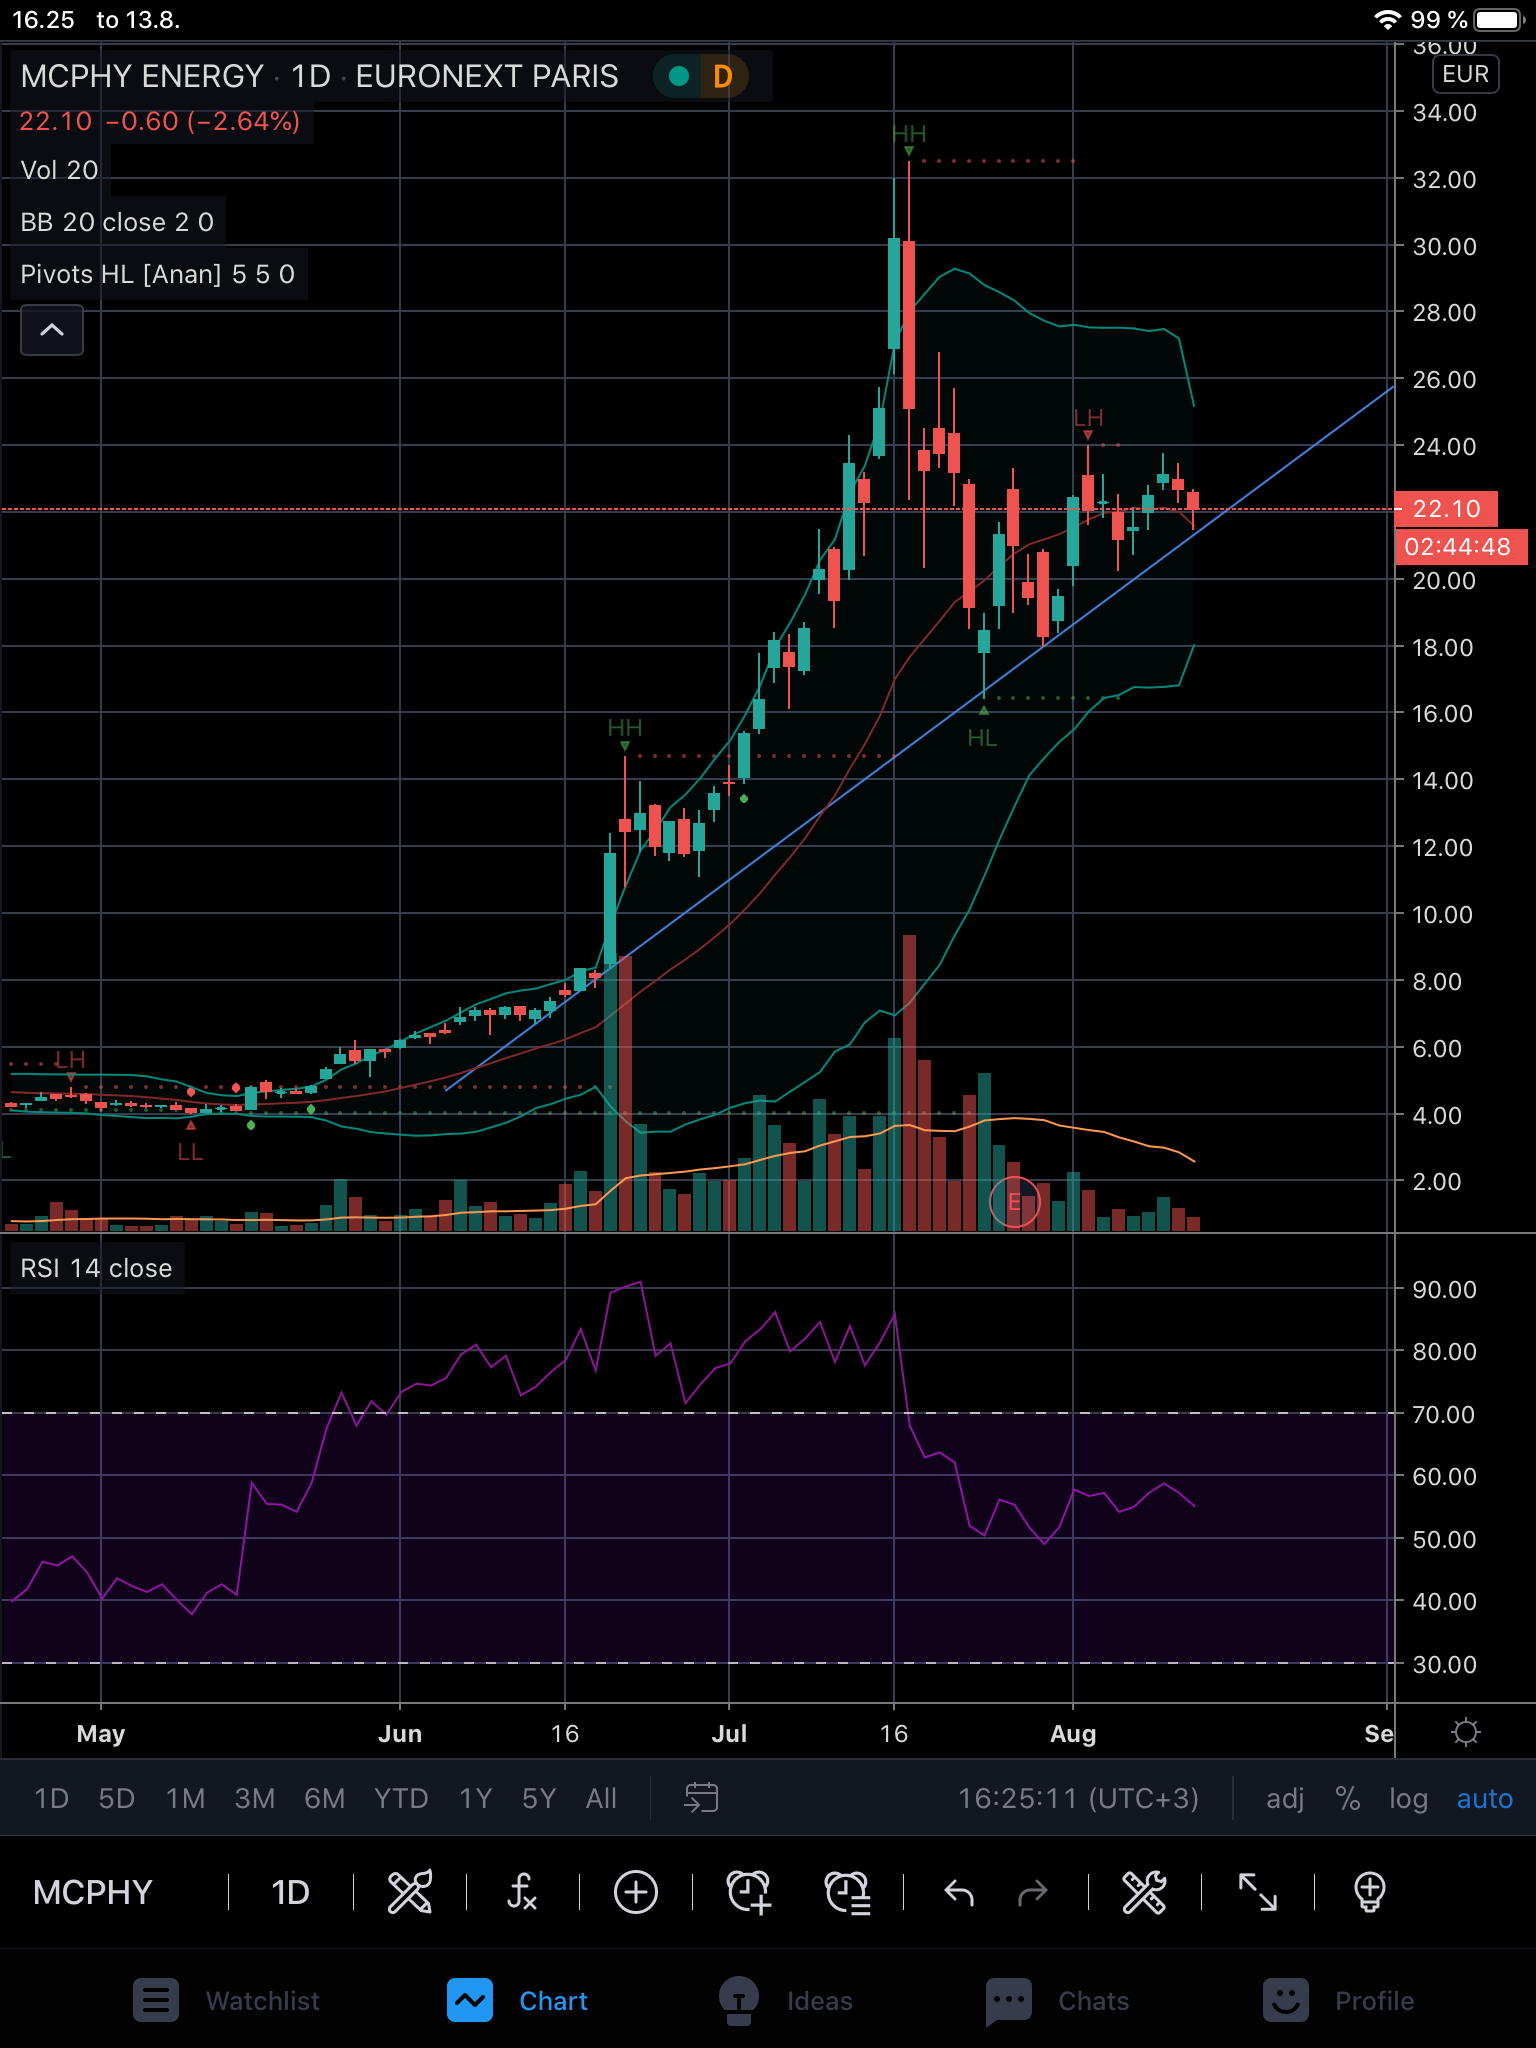
Could someone knowledgeable check McPhy’s situation from a TA perspective? I’m interested in buying more, but is there room for a drop back to around 18-19€?
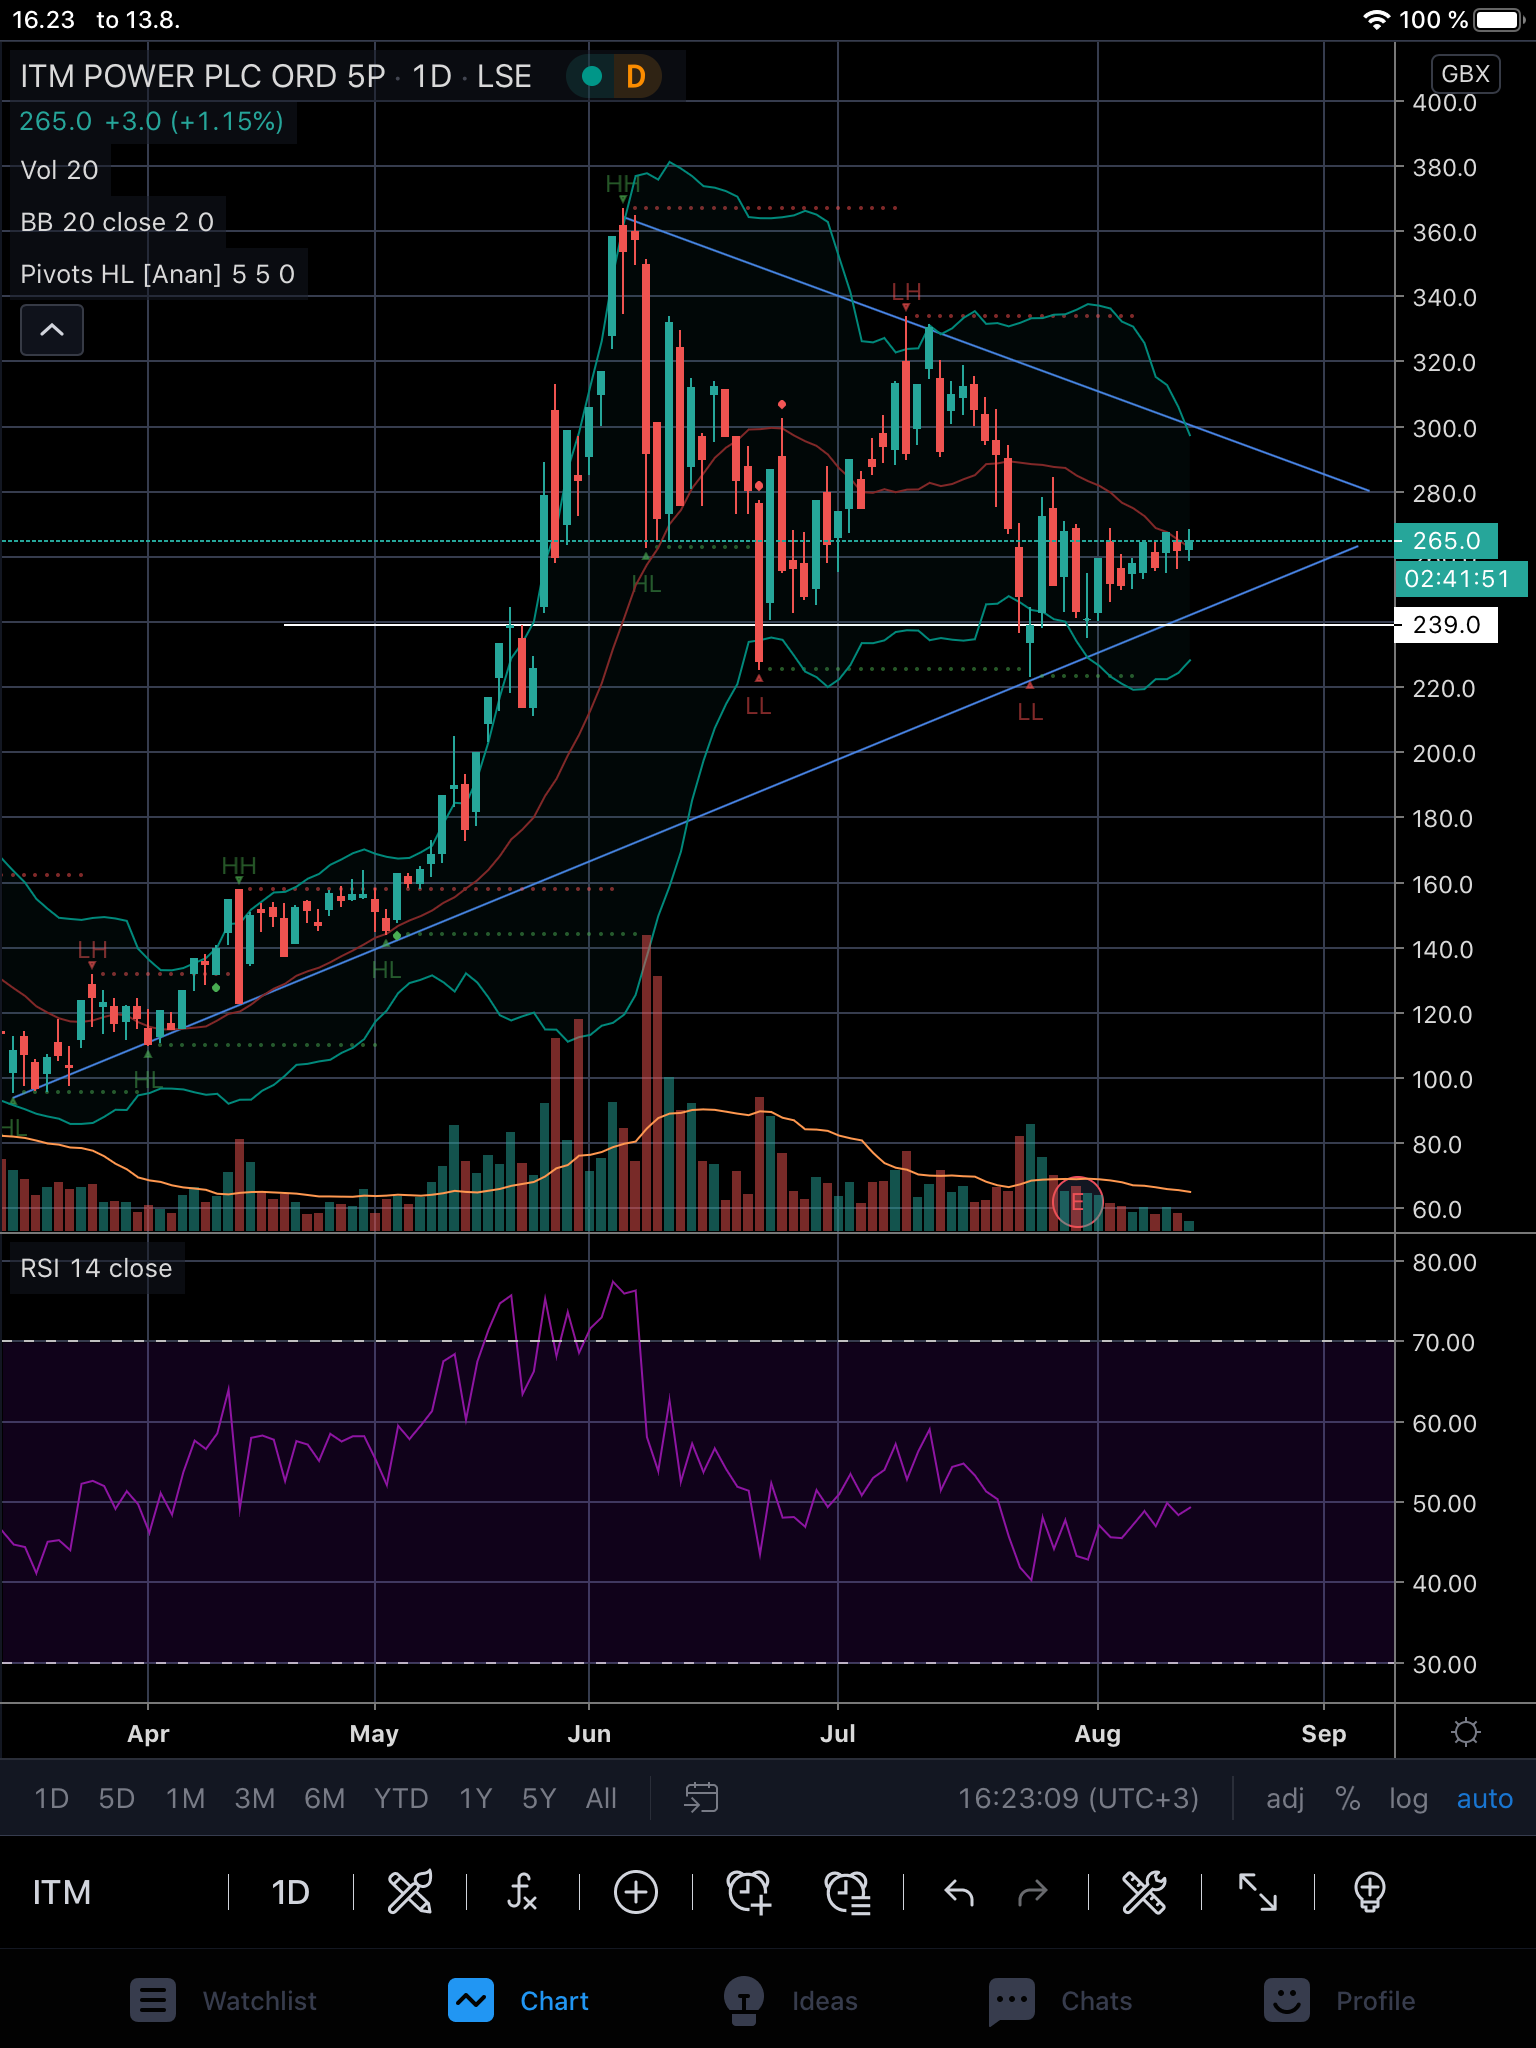
PCELL broke down from daily support at 264.6, so there is downward pressure on the uptrend. The next support is at 248, so hopefully, a higher low will form above that. Looking at today’s daily candle, a bullish reversal/hammer is forming, so it’s possible that the bottom has been reached.
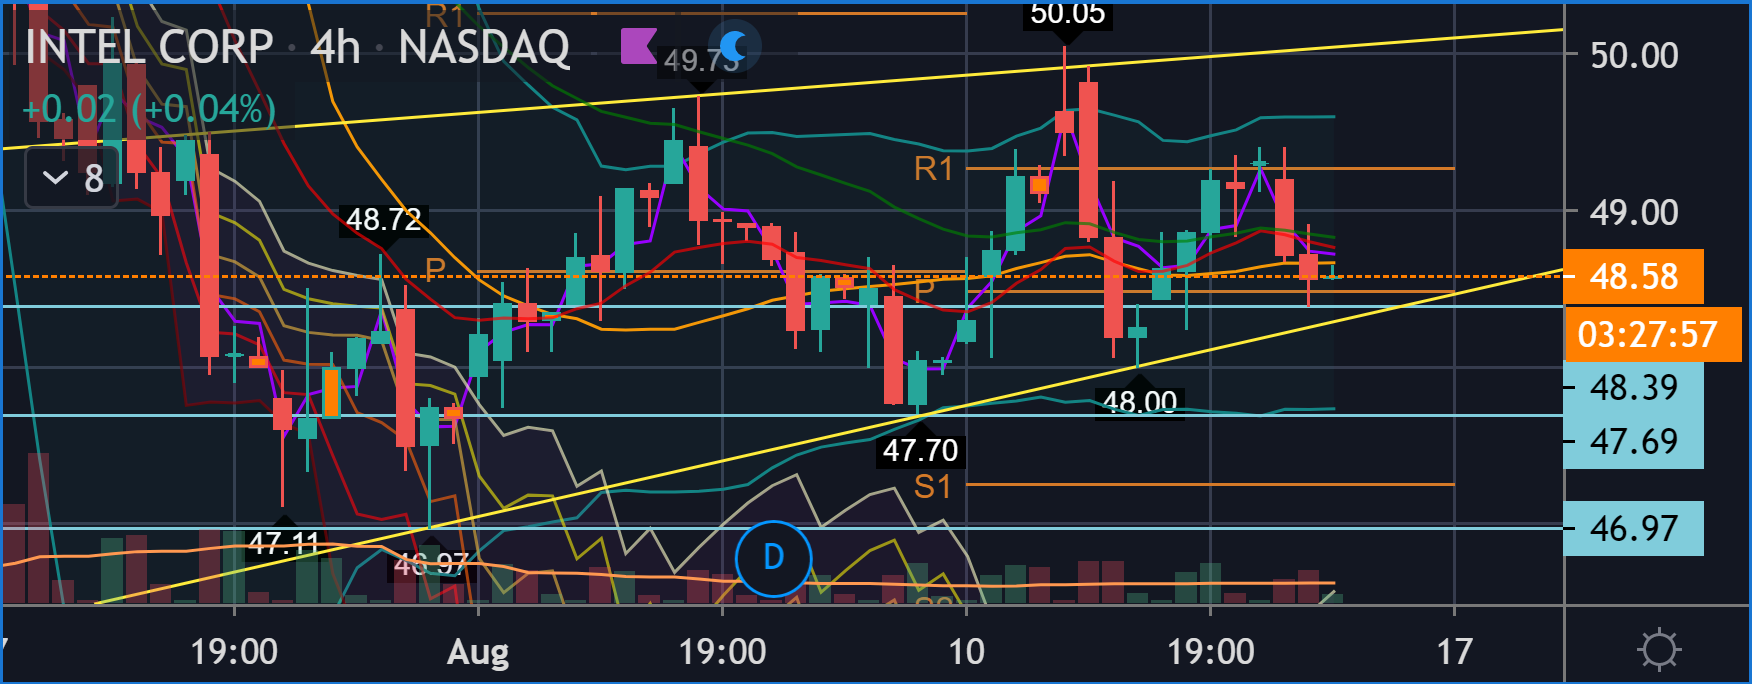
It has formed a daily EQ (Equilibrium), with a low of 20.25 and a high of 23.75. It’s trading in the middle of that range, barely above the EMA12 (Exponential Moving Average 12). Tomorrow will tell which direction it continues in.
@MoneyWalker already commented - after the earnings report, the markets are clearly taking a breather and trying to digest the numbers. We are in a consolidation phase, having quickly formed a daily EQ, so the direction can continue anywhere. Today it has formed an inside bar, so the first sign will be which of those sides breaks first and what the volume is (trading volumes are steadily decreasing).
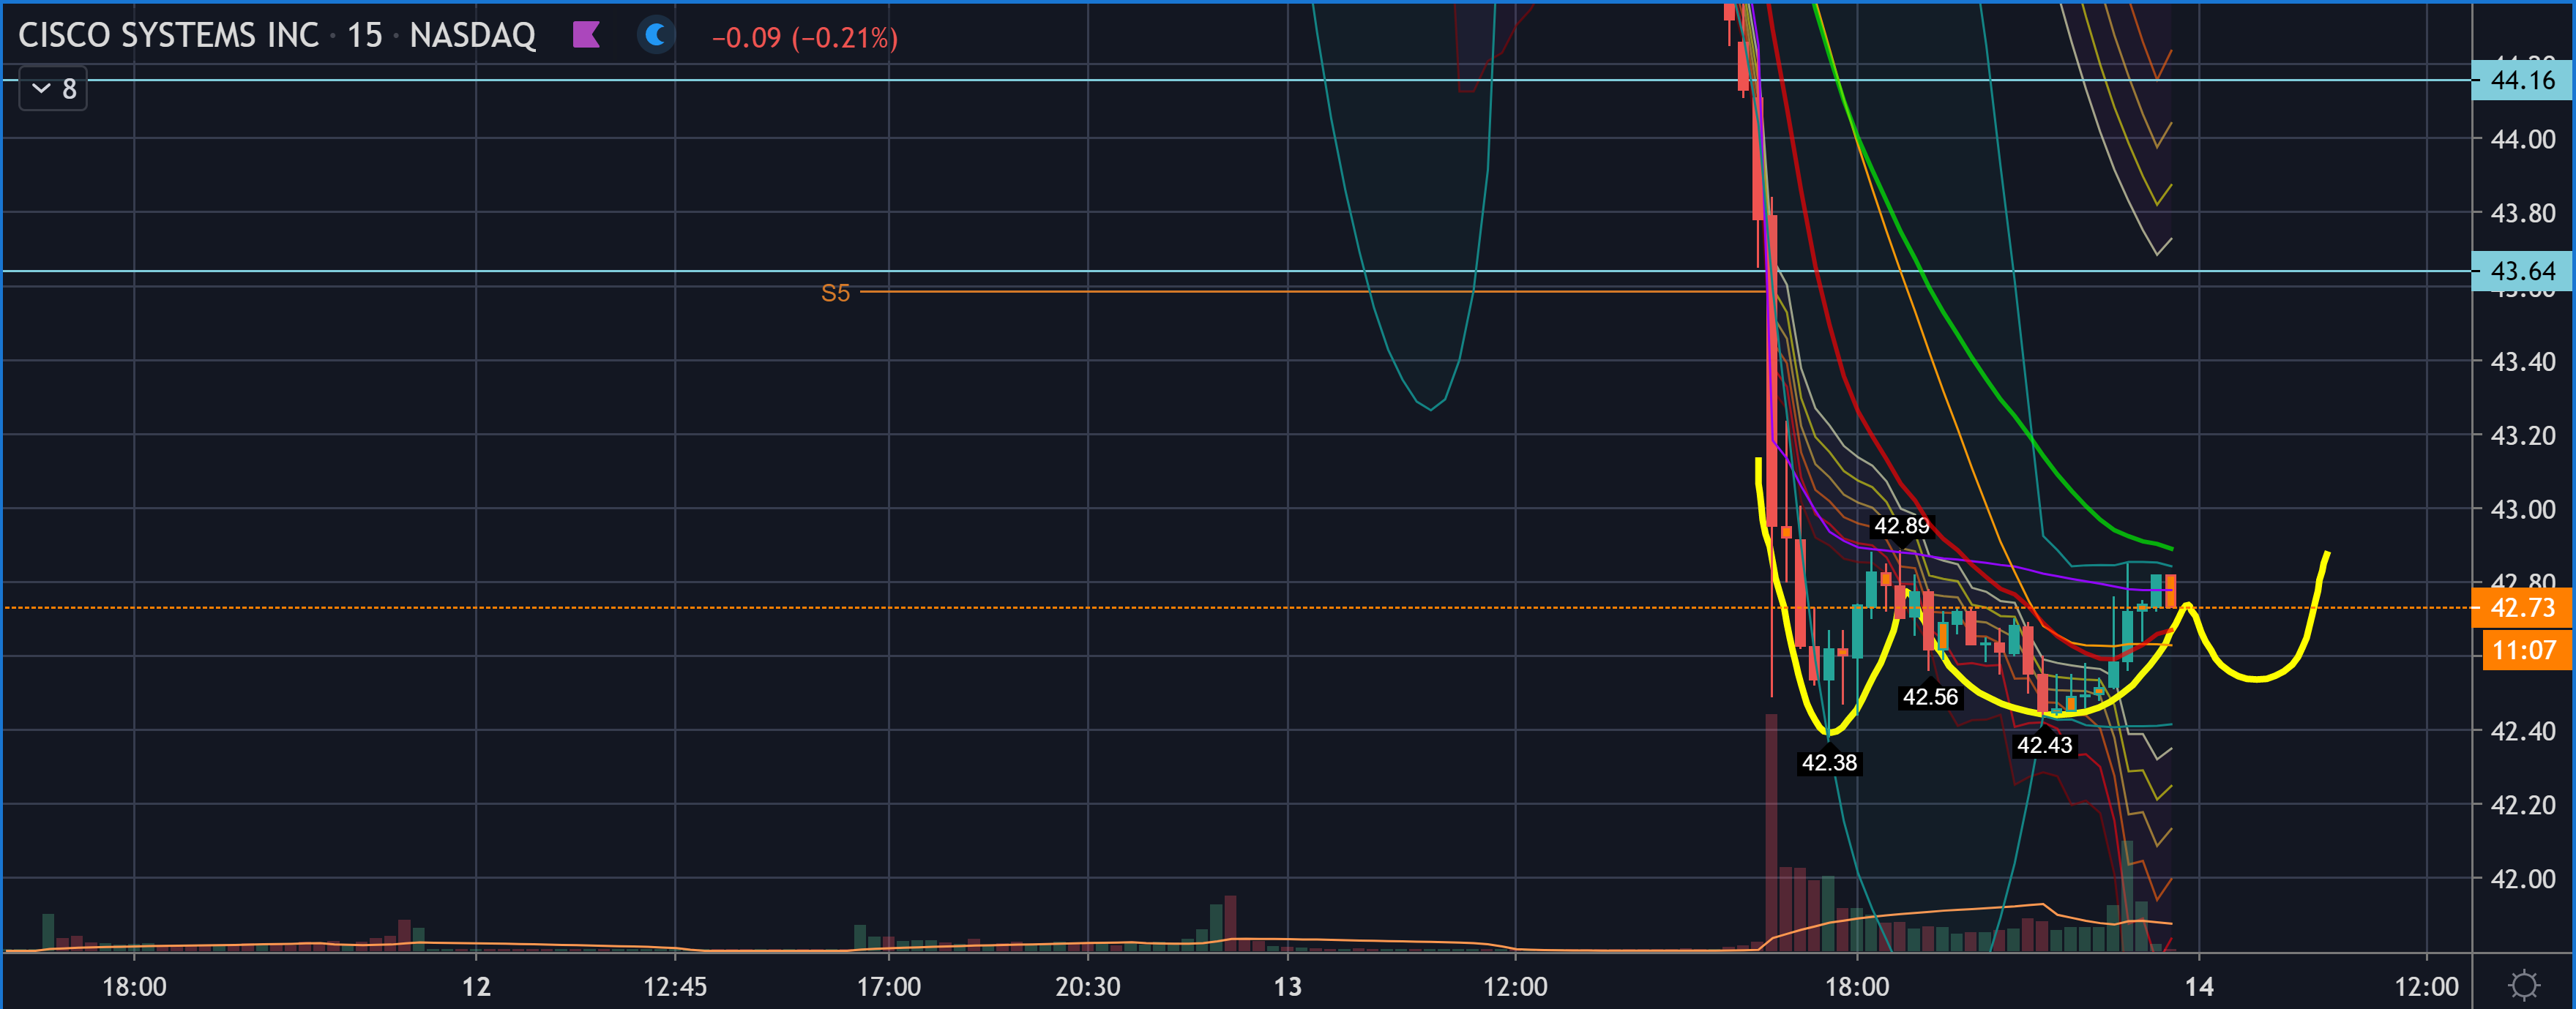
From the end of the day, a possible 15min iHS (change of direction) can be discerned, though the left shoulder is lower than the head
You should at least provide a bit more background information on what you are looking for and for what purpose, so the answer can be better targeted. I happened to be at the computer, so I quickly put these together.
What does NEL look like from a TA perspective? Will the journey continue downwards, or did something indicate a turnaround today? It certainly rose sharply towards the end of the day. Where would be a good buying spot, and what should I watch out for?
Edit. This would be for a longer hold, from weeks to years. However, there’s quite a bit of volatility, so I’d appreciate some help with timing the purchase.
I would be interested in a TA perspective on Kindred Group plc and Swedish Match AB. I once made my own shaky conclusion about Kindred, that a breakthrough of the SEK 60 level would be significant, and it would be fun to hear the professionals’ view on this.