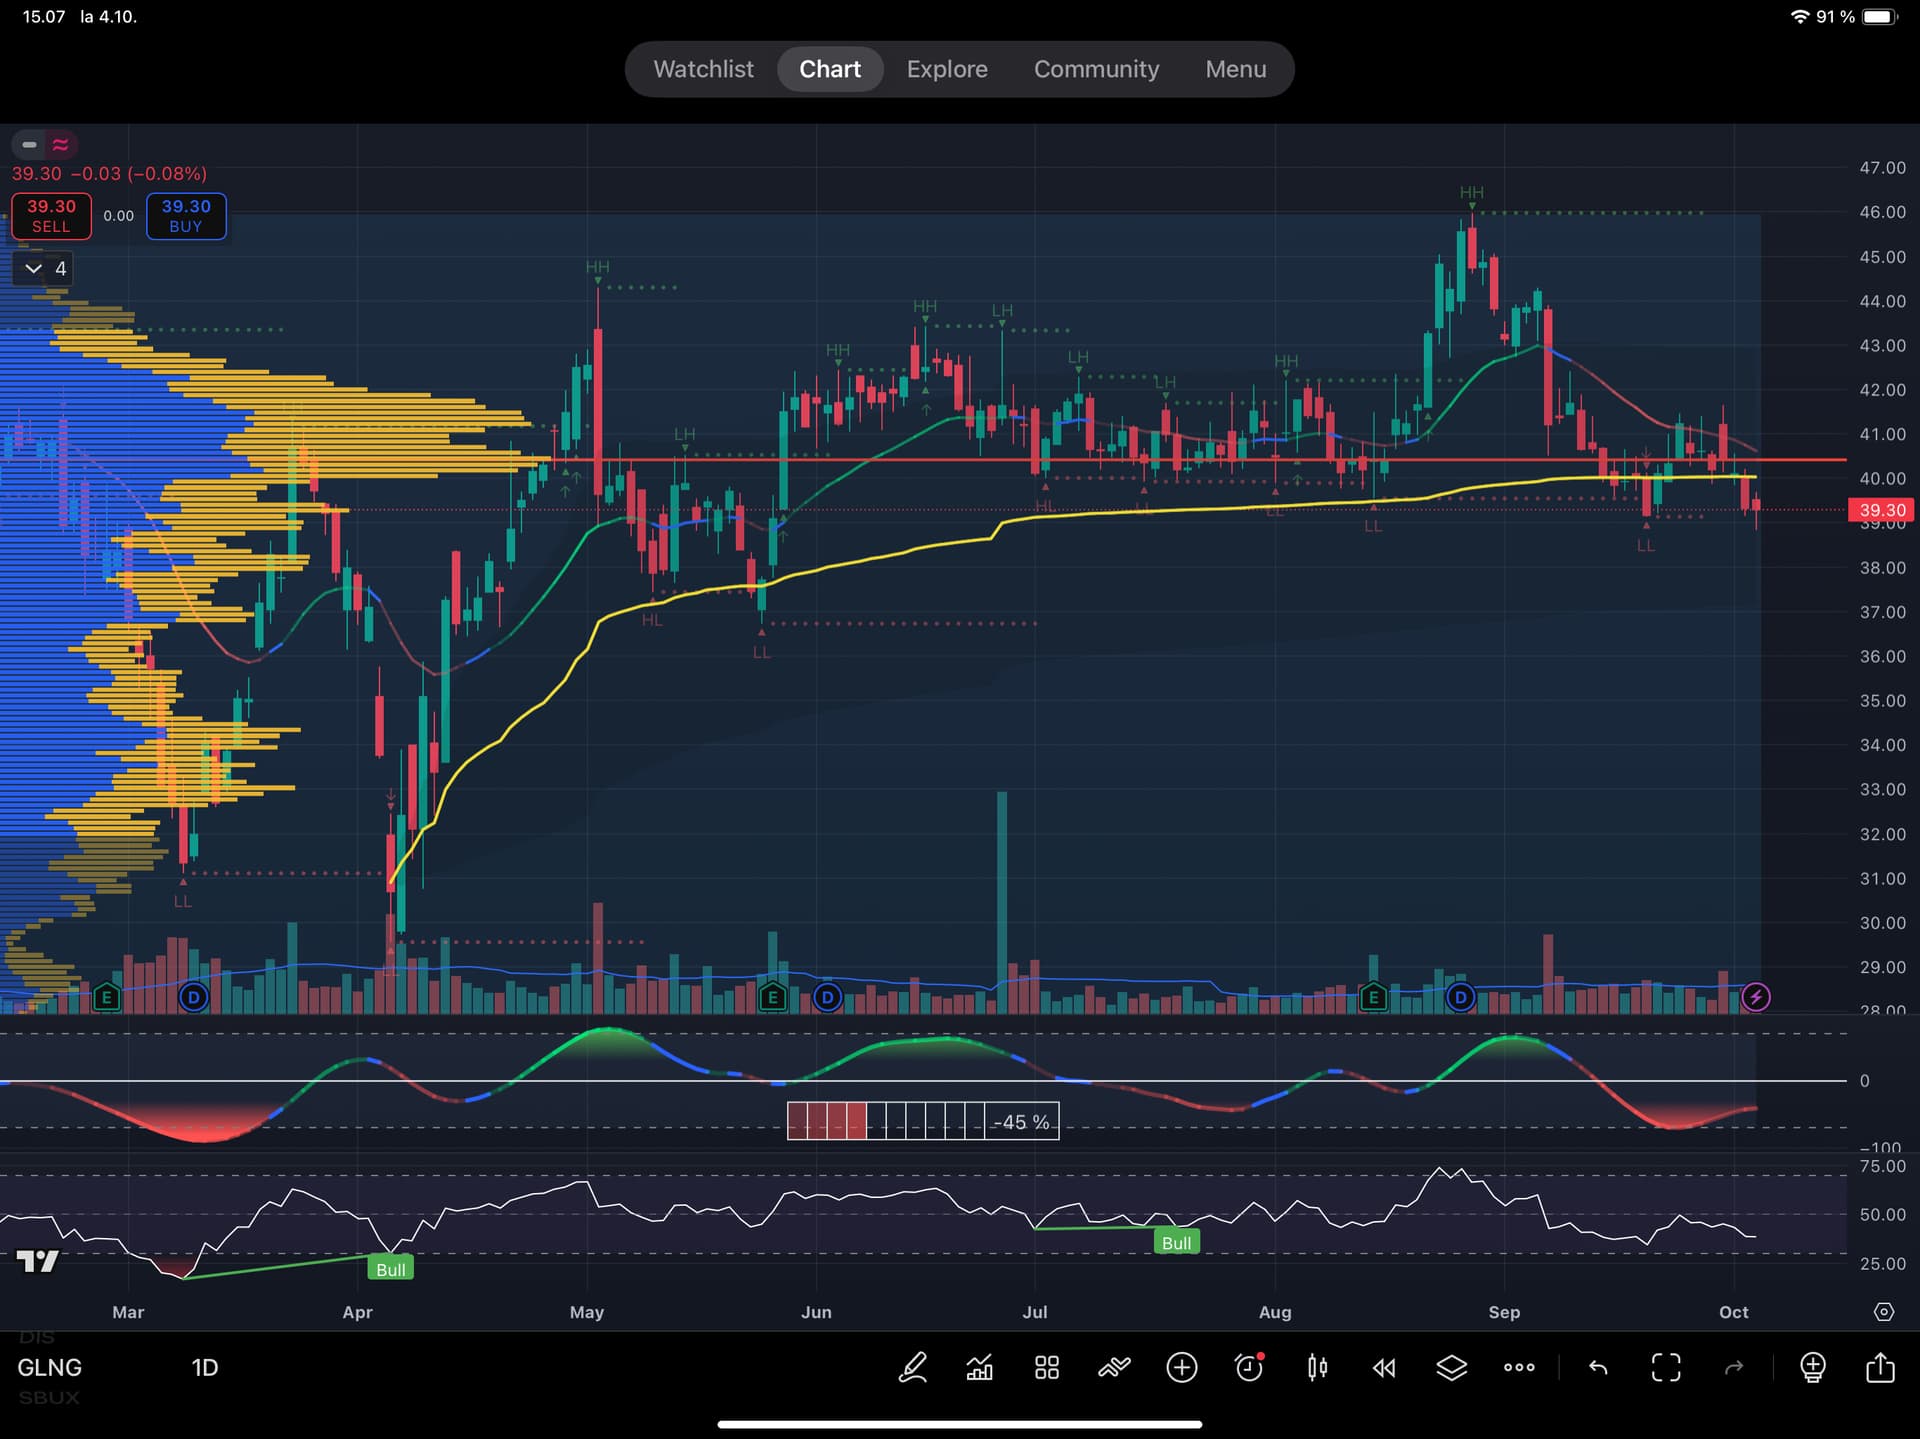
I’m far from a guru, but that looks weak. It’s slipping sideways with little change. It should get over 42 dollars, then it would look better.
2 Likes
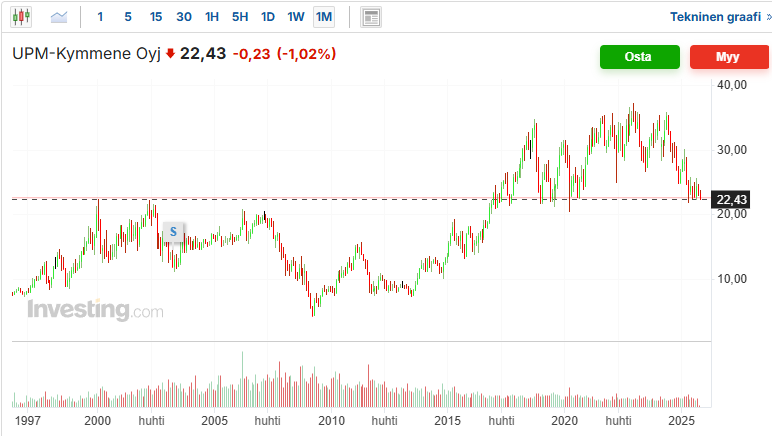
Any thoughts on UPM? These support levels have been tested frequently now. Is there a risk that after a really bad Q3, we’ll break through, or is all the bad news already priced in ![]() .
.
Might be, or might not be ![]()
7 Likes
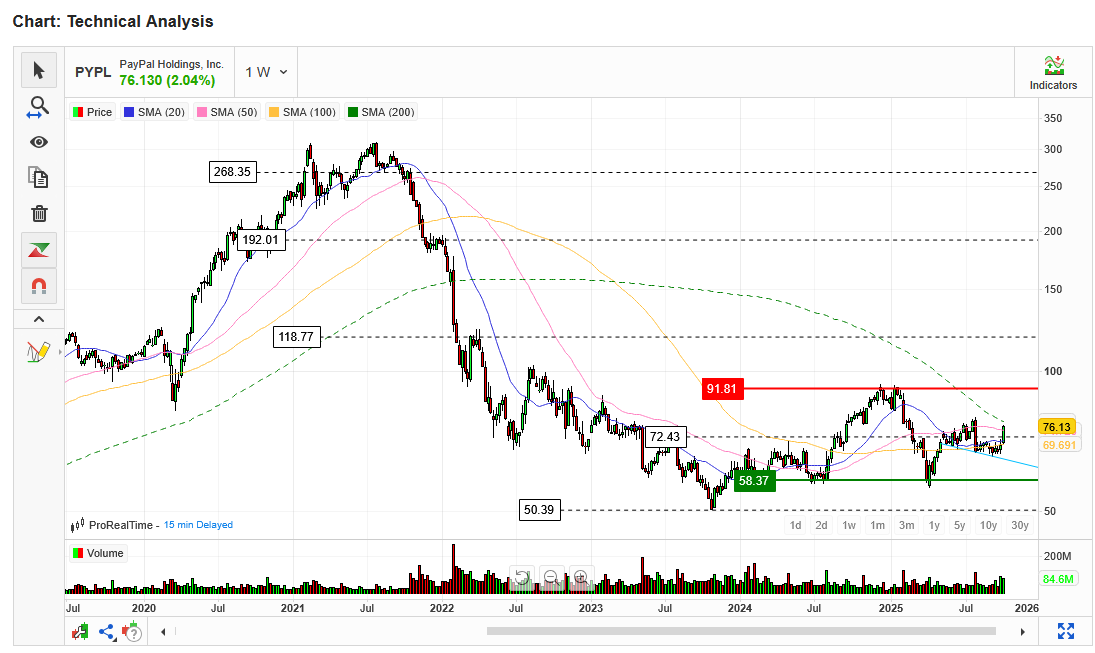
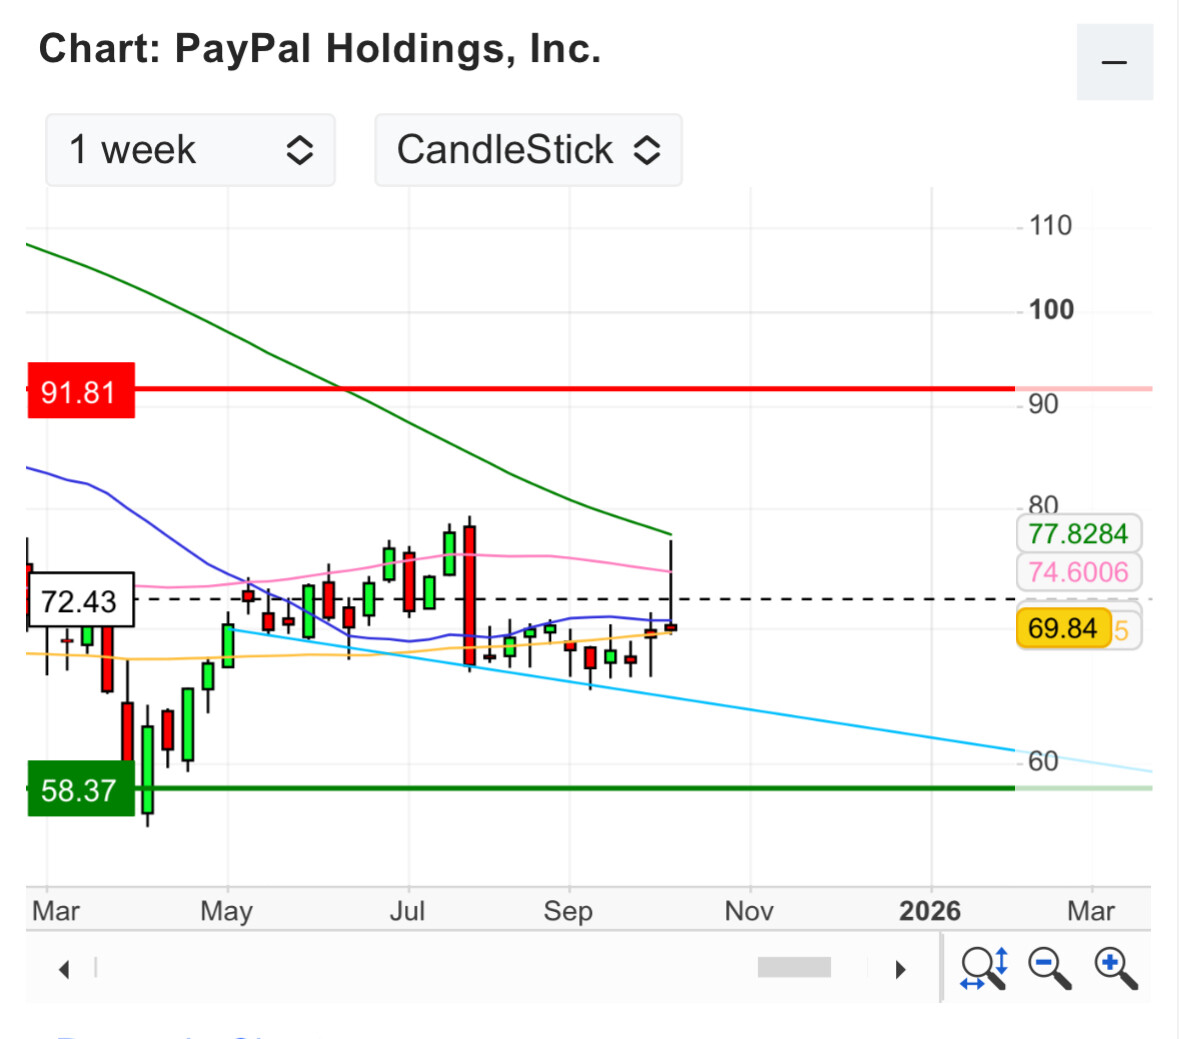
PayPal ($PYPL) would be testing the 200-day moving average weekly candle for the first time since 2022. How should this be approached? Threat or opportunity?
5 Likes
What does MNDY look like from a technical perspective? It’s currently around the 50 EMA. About a month ago, it at least hit that same level. Does it need to go above that for the rally to continue, or how should that be interpreted? Thanks in advance!
Evening @MTES
I’m not very experienced, but I’ll still share my view. Take it with a grain of salt. Fundamentals aside, at least the valuation levels seem quite high.
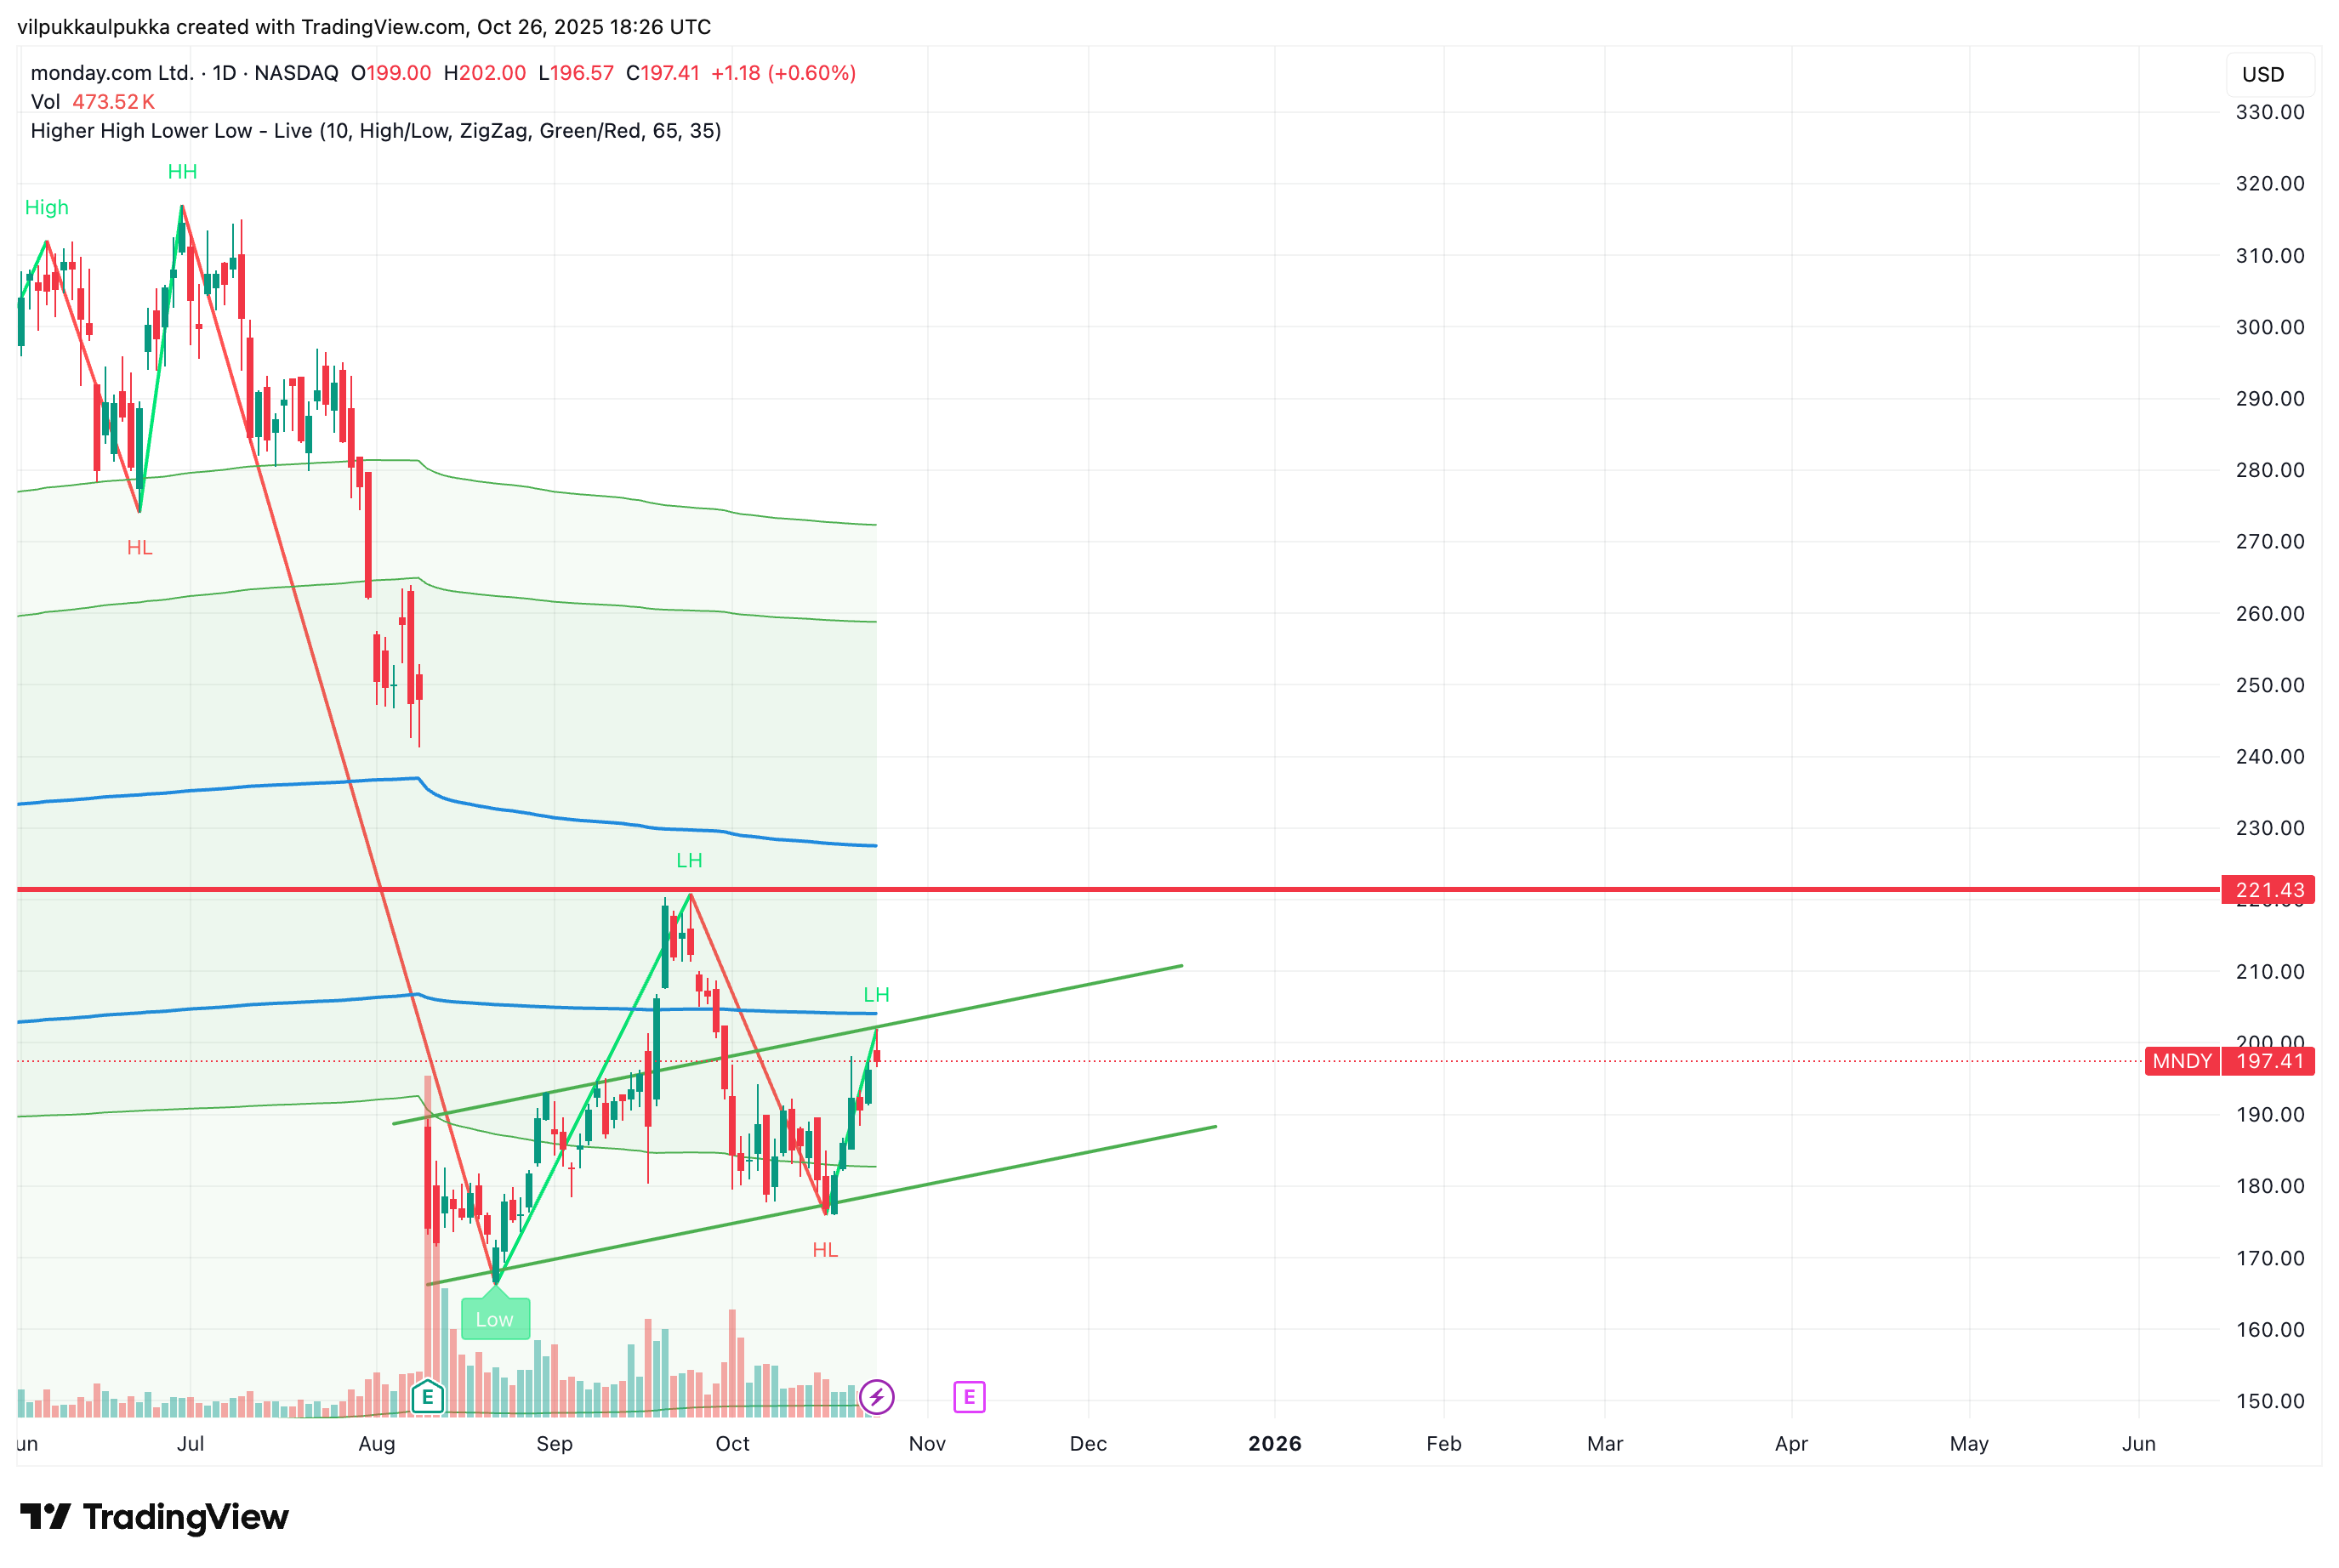
Daily has formed a rising bottom once, but it should push above 221 to get a HH and then again a HL. Around 221 and before that, there seems to be some resistance based on the weekly volume profile. ![]()
However, is the Weekly drawing a bear flag? ![]()
![]()
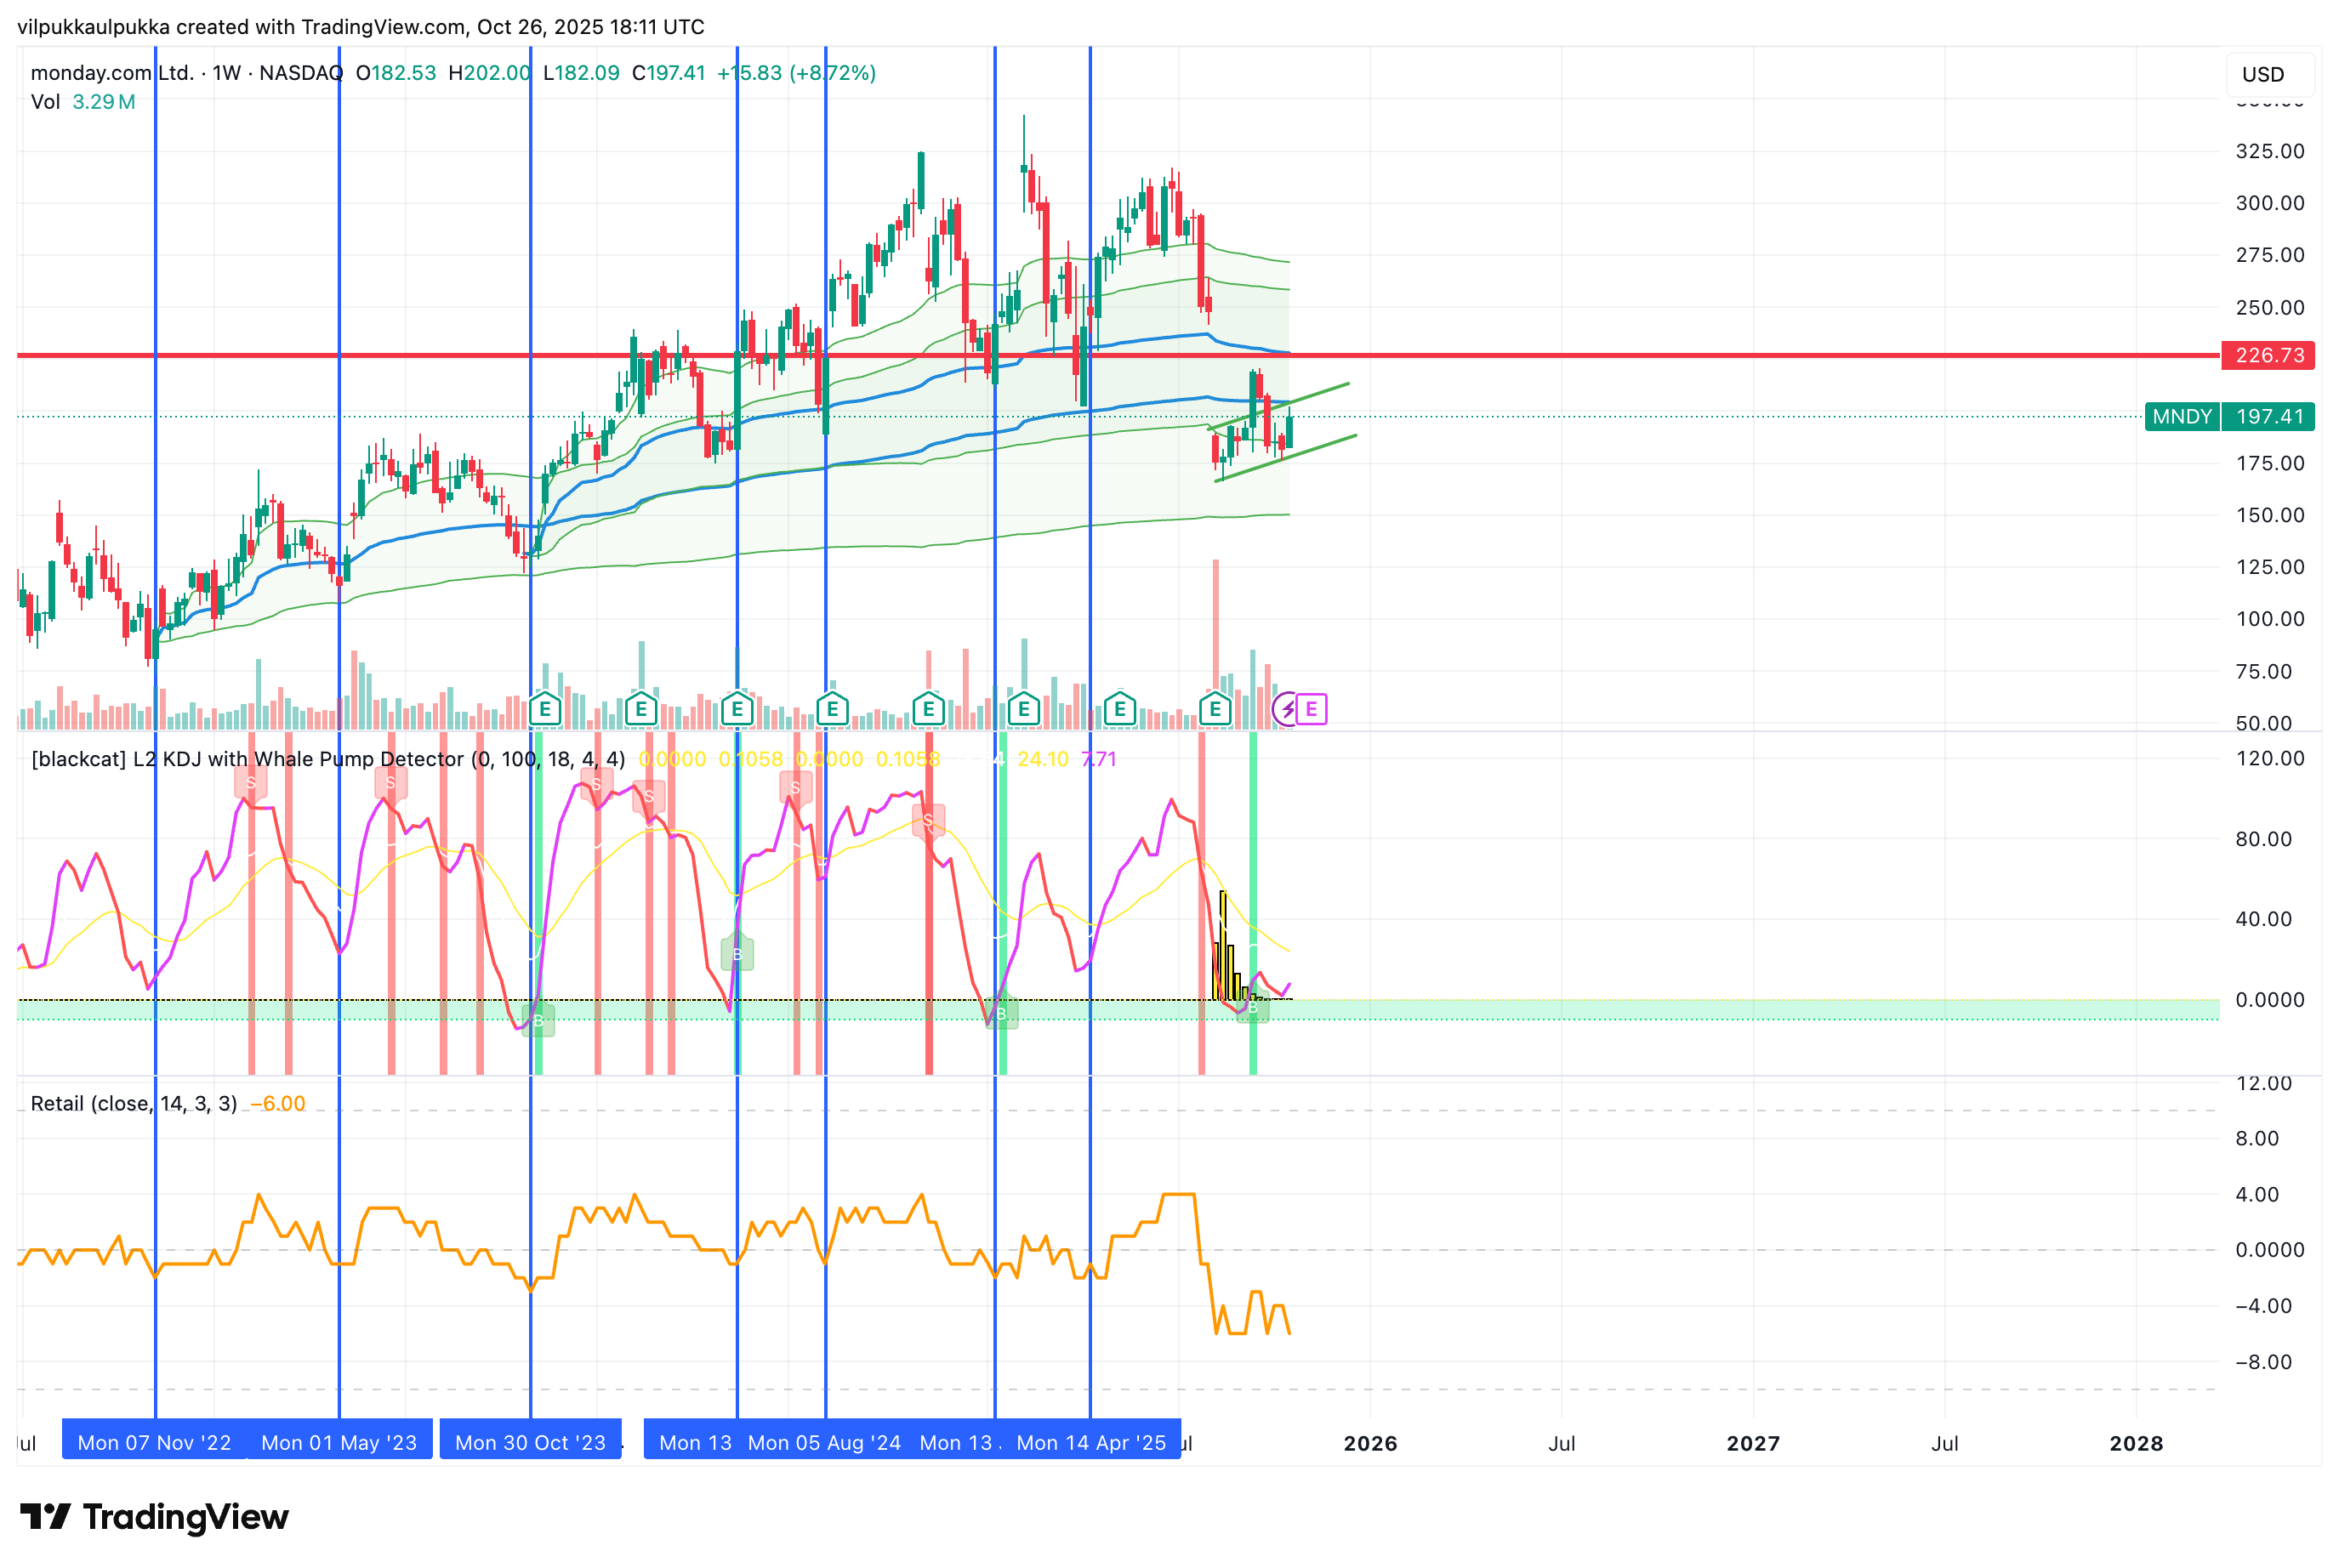
From the 10/2023 bottom, near the lower edge of AVWAP. ![]() Cipher has acted as a “hehtaaripyssy” (a big gun, like a retail contra-indicator) and based on that, bottoms would be forming.
Cipher has acted as a “hehtaaripyssy” (a big gun, like a retail contra-indicator) and based on that, bottoms would be forming.
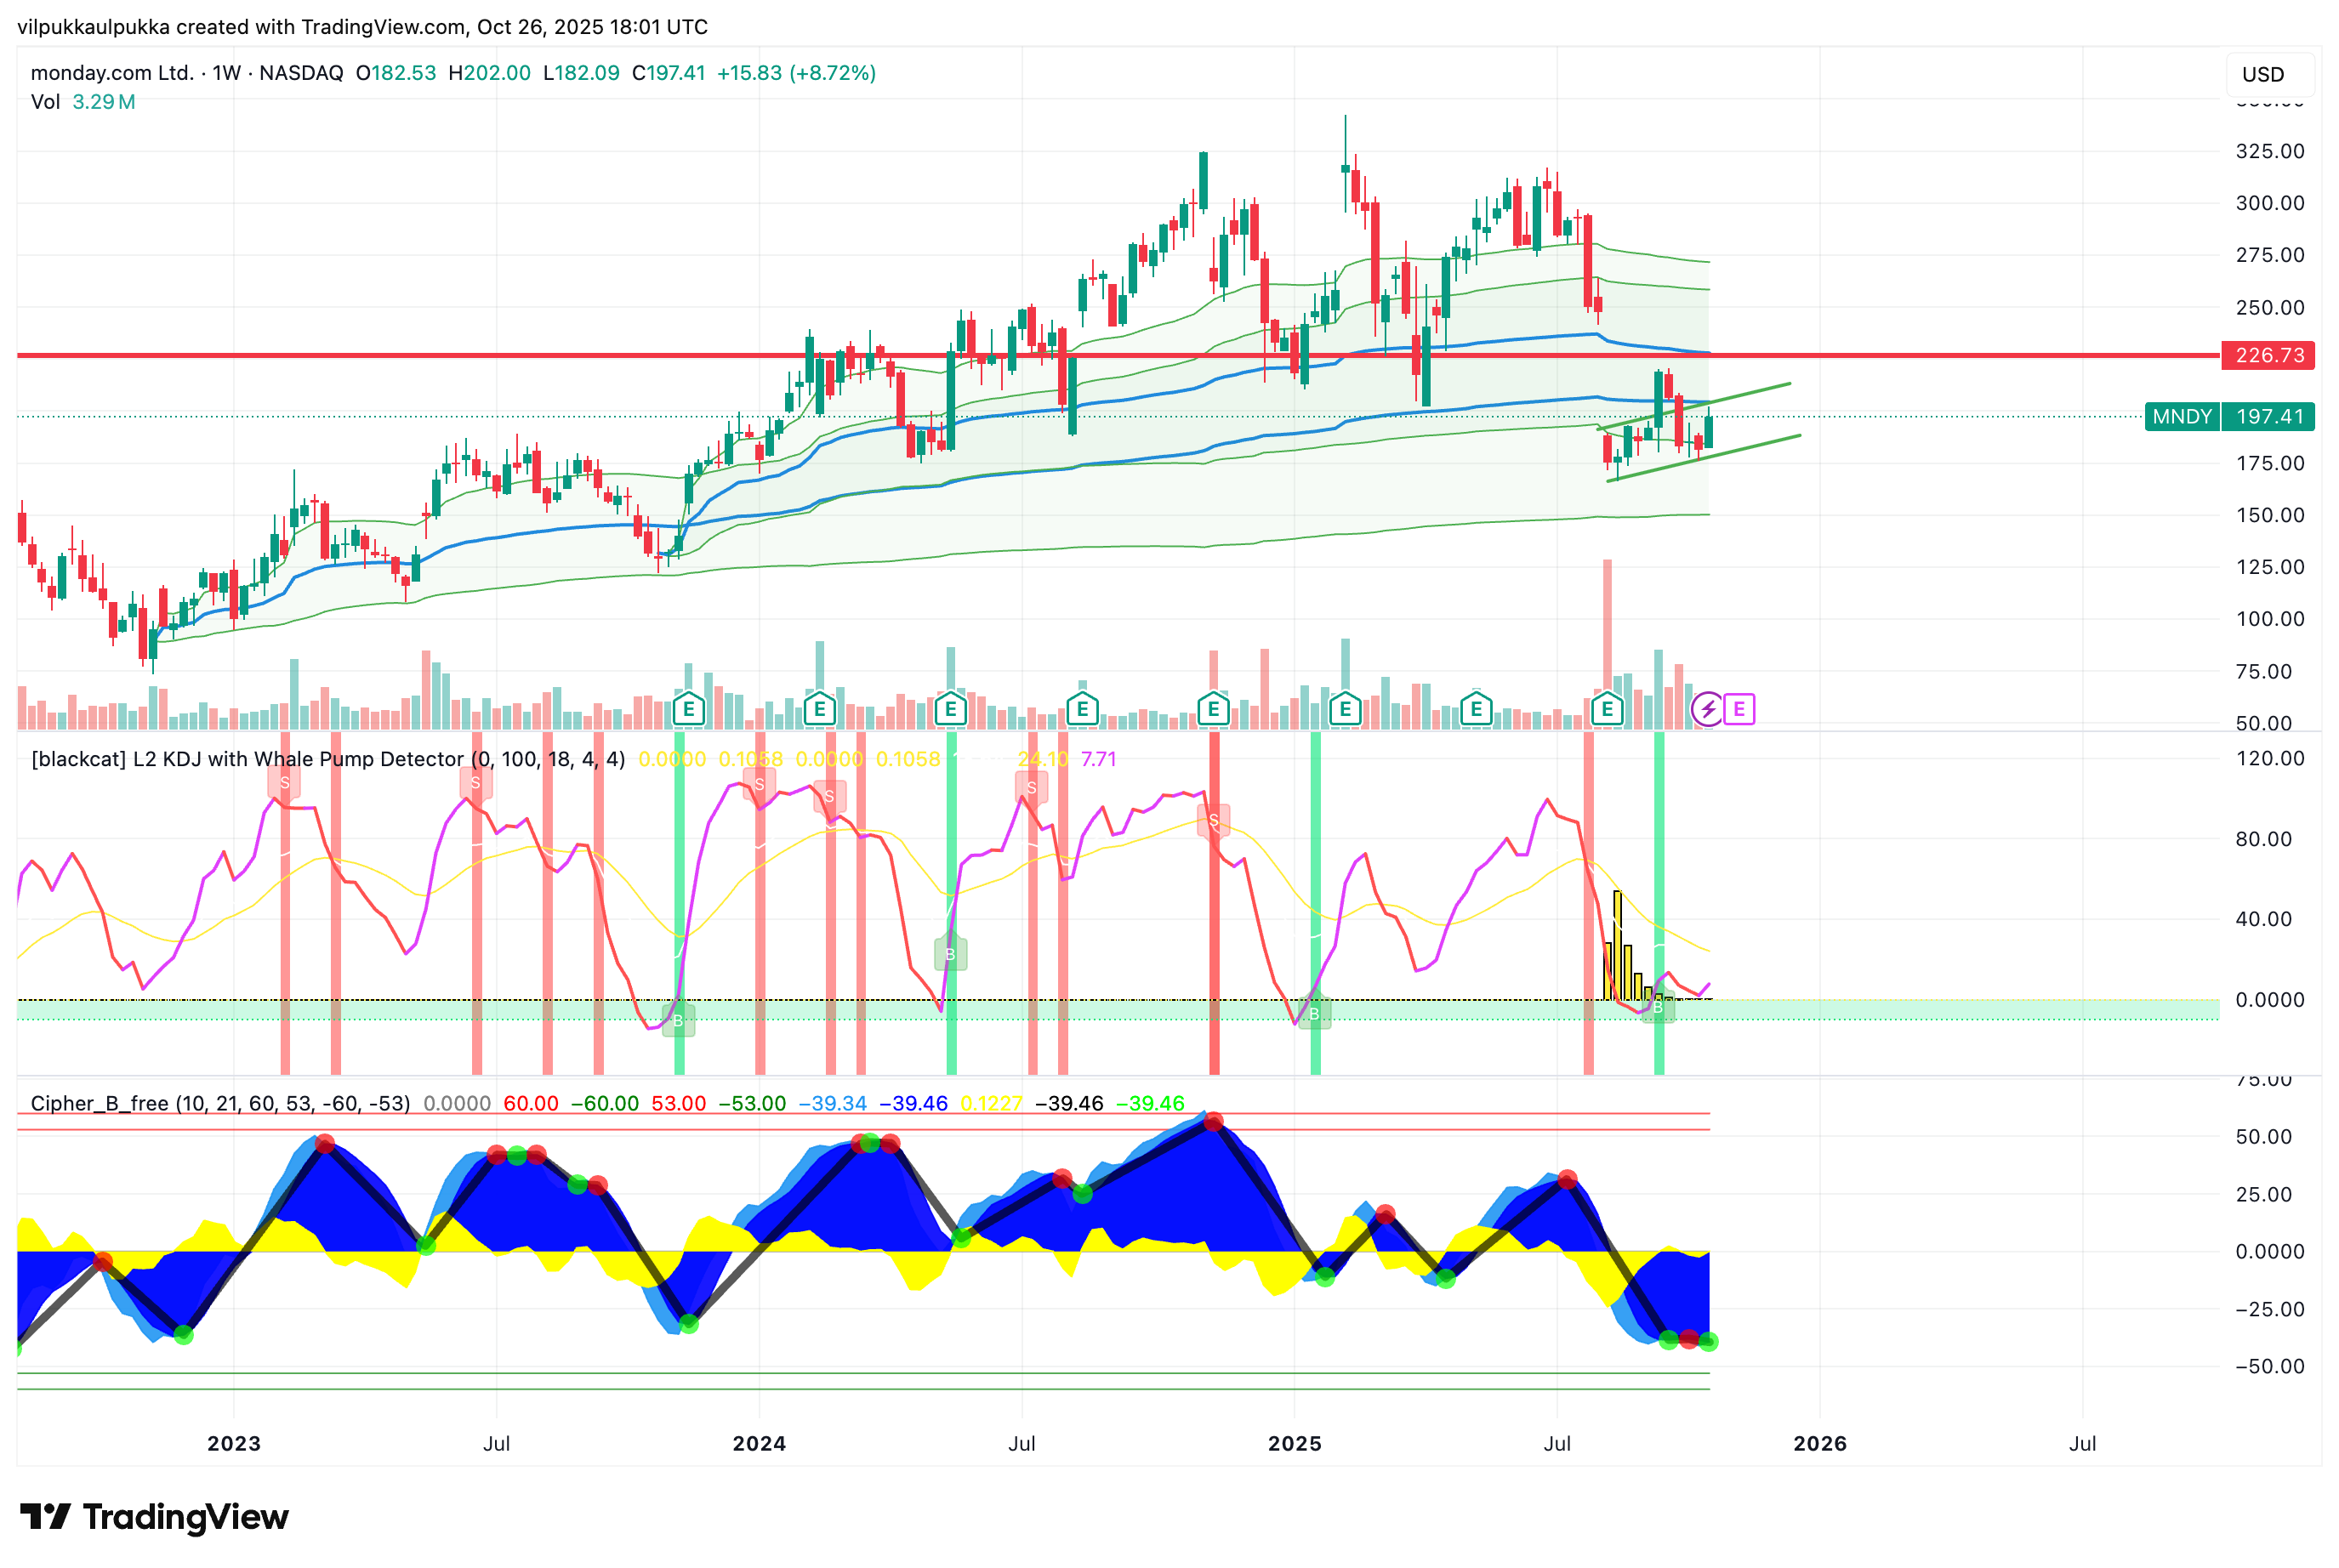
Retail is bearish (meaning as a contra-indicator, it could be a good time to buy), L2 (big whales with yellow bars) have been buying since the last big dip. ![]()
Moving averages
Daily 50 has just turned upwards, all others are downwards, meaning the bigger trend is still waiting for a turn ![]()
The largest selling volume seems to have turned into net purchases on a monthly basis. Weekly and monthly RSI are rising from the bottoms ![]()
A bit more useless here, but quite interesting: The Dynamic swing indicator, at least from the 2022 bottom, has worked quite nicely as a buy signal when the price rises above the green level, but it’s a different matter in a downtrend. This is mainly because it has just risen above that green level:
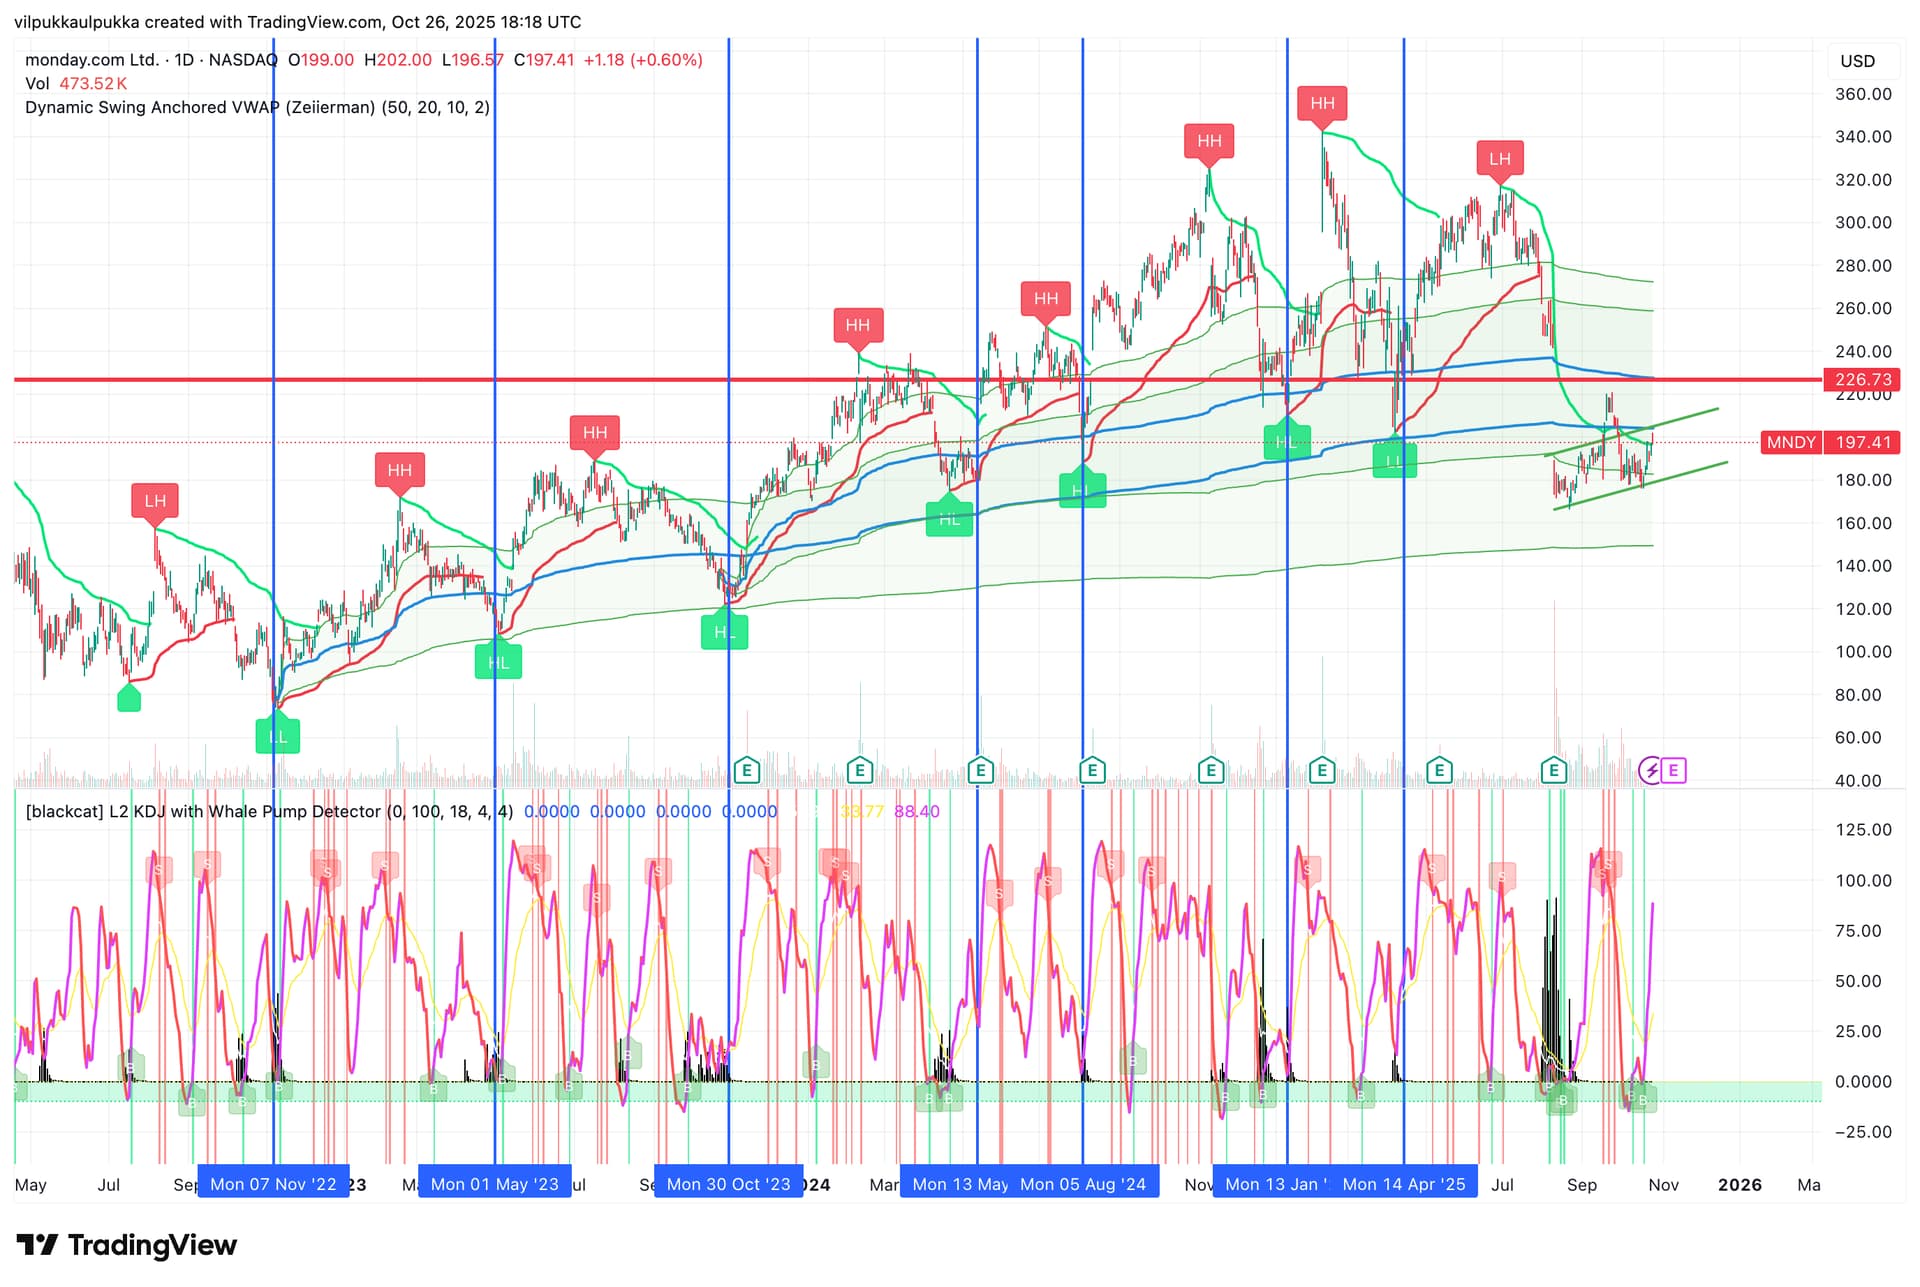
In summary, a fifty-sixty feeling: whales are buying, but is a bear flag forming there? Daily is trying a trend change, but weekly TC is still far away, and I wouldn’t talk about an uptrend in the longer term. I might personally wait for a 221 daily HH formation first and then wait for a HL formation. Valuation multiples seem high. This is based on a brief overview.
Others, please correct and supplement
vilpukkaulpukka
5 Likes
When a bear flag is discussed above, what does Smart Eye’s bull flag look like according to experts? And I’d also be interested in a technical view of the company.
6 Likes
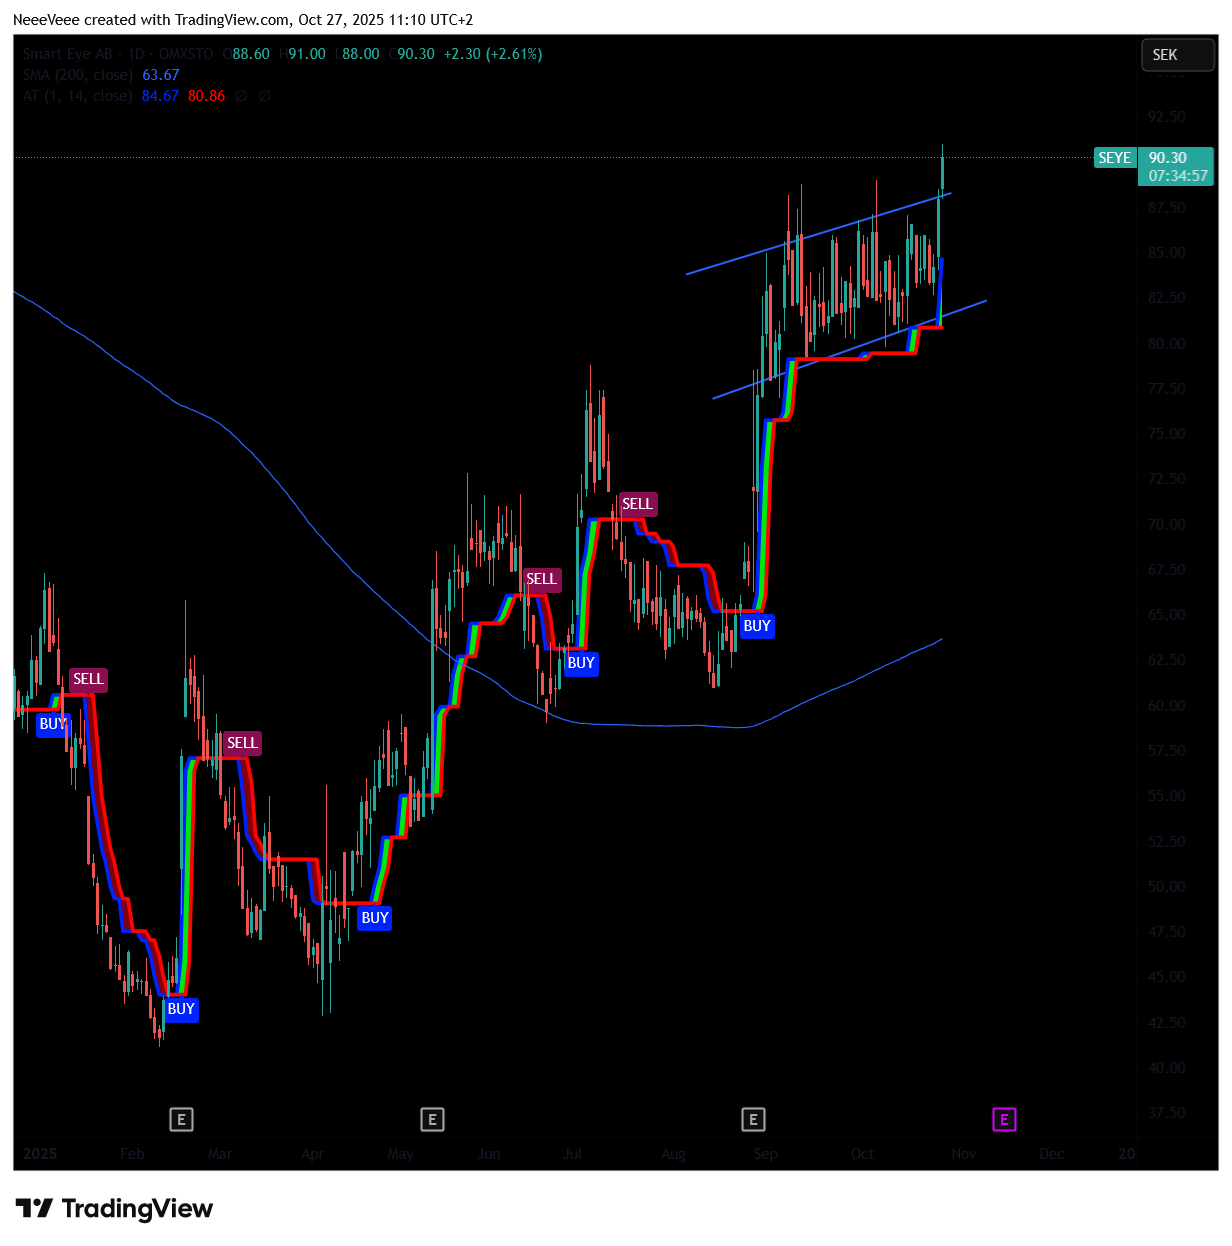
SmartEye. My technical chart looks like this.
I expected us to have already seen a small technical correction that would have taken it well below SEK80. But this has not materialized, and the stock has repeatedly remained surprisingly strong.
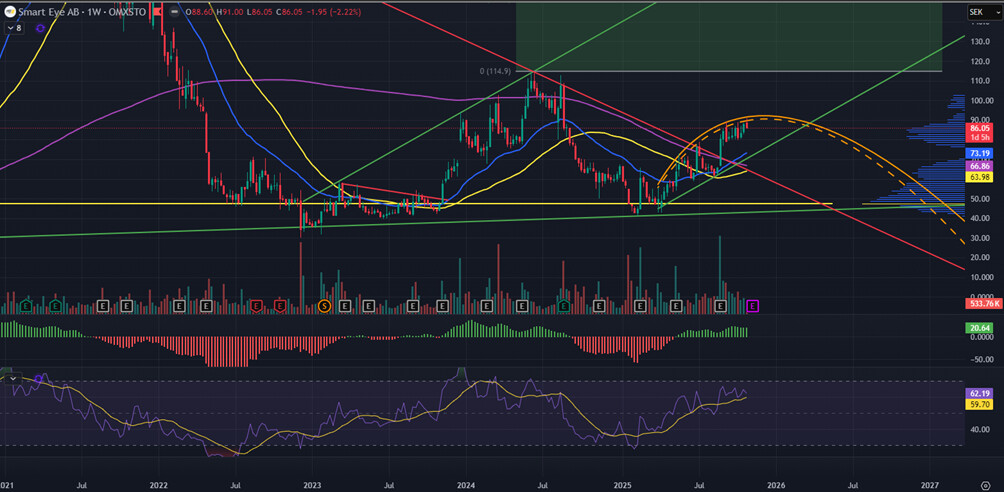
A bear flag is inherently a pattern of a downtrend. And now the daily and weekly trends are rising. On a monthly level, there isn’t a higher peak yet, but a higher low has been made. So I wouldn’t be worried about a bear flag, as it doesn’t quite fit that timeframe.
But what about the smaller potential decline, since it didn’t materialize? The stock has only recently broken out of a long downtrend. As such, the longer-term picture looks very promising to me. I drew a curved resistance for the short-term trend, as it seems to hit the touchpoints very well. Technically, it’s now a bit challenging due to the lack of corrections, and of course, that resistance is now very clear (meaning it should be broken). But still, I lean slightly towards a positive view even for the short term.
I have acted by reducing my bull leveraged product by 30%, and left all direct stocks in the portfolio.
13 Likes
I haven’t seen an analysis of the results yet. But to my eye, it seems like a relief (or a defensive victory), and especially the Q1/2026 guidance is already promising. I believe it will be rewarded with a (fair) rise today.
We are around the lower bottom. I am now forecasting through fundamentals (and there might be an error in my own expectations) and thus I will buy a small slice today and continue monitoring. The upper edge of the channel has not been exceeded, but perhaps it will be tested soon. So, I am changing my strategy somewhat.
5 Likes
SmartEye. The correction came today below the SEK 80 level. I just added to the leveraged products I had sold. The decline may well continue, support would be found roughly around SEK 72 levels.
6 Likes
Question regarding Auto1 Group (Xetra/AG1)
Could someone shed some light on where the next support level for the stock price is, if the decline doesn’t stop at the current EMA200?
The company became profitable a year ago and continues to deliver on its promises. Now the focus is on online car sales to consumer customers, and the success and the cost of that success are being priced in.
Mainly I’m wondering that if the sentiment weakens further from here, I’ll have to consider whether to jump out and try again later.
1 Like
Did Smart Eye just slide into bear market territory? Could potential support and a temporary bounce be found somewhere around 66?
1 Like
I trust so much in this that next year the business will explode, so every bigger downward move is a buying opportunity in my mind. I have been doing that - and most recently today.
And I really trust that at some point there will be something more than dead cat bounces. So I don’t really see us being in a bear market in any way. Of course, we have slid down about 25% from the earnings day highs, so in that sense, the 20% threshold has certainly been crossed. At some point, the short sellers will be in a really big mess - let them celebrate for a little while now.
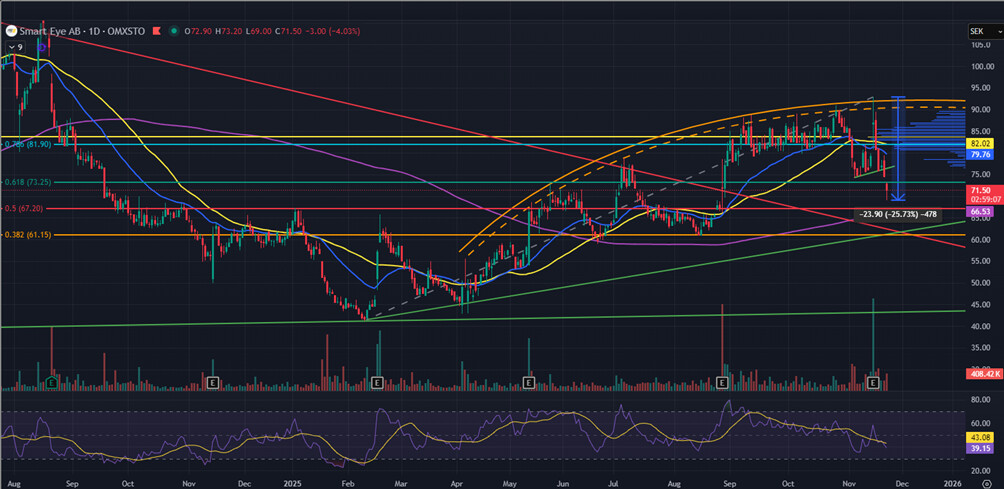
A corrective wave A → C is underway - on earnings day, the price just accidentally ran too high, so I don’t really know how it’s technically interpreted now. After this reset, my own expectations are for a long and strong upward move. This would also align with the fundamentals.
13 Likes
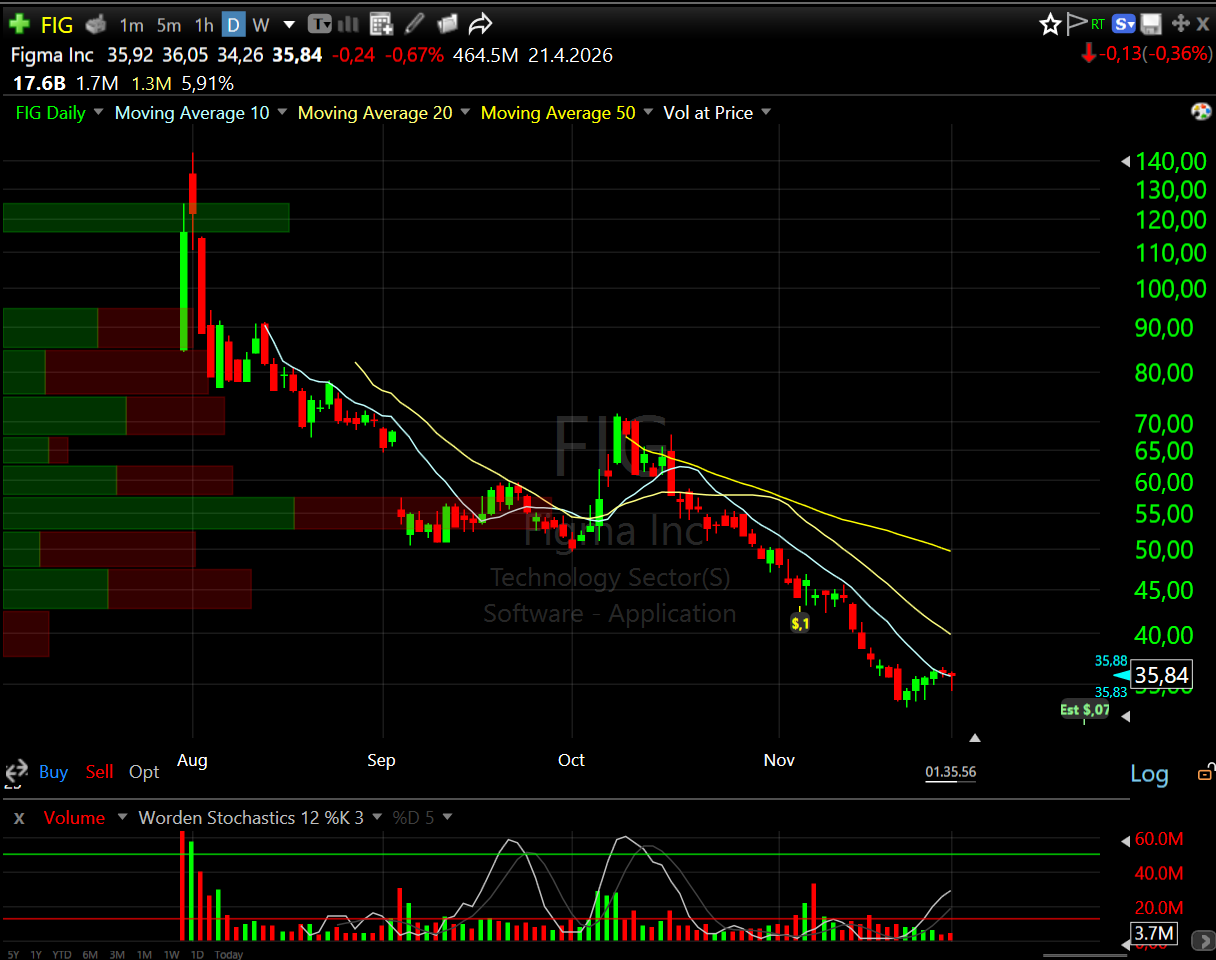
Figma has come down quite significantly from its IPO prices. Is there already enough price history for TA guys to have something to say? (actually, the IPO price was 33 dollars, the market was just quite hot back then…)
2 Likes
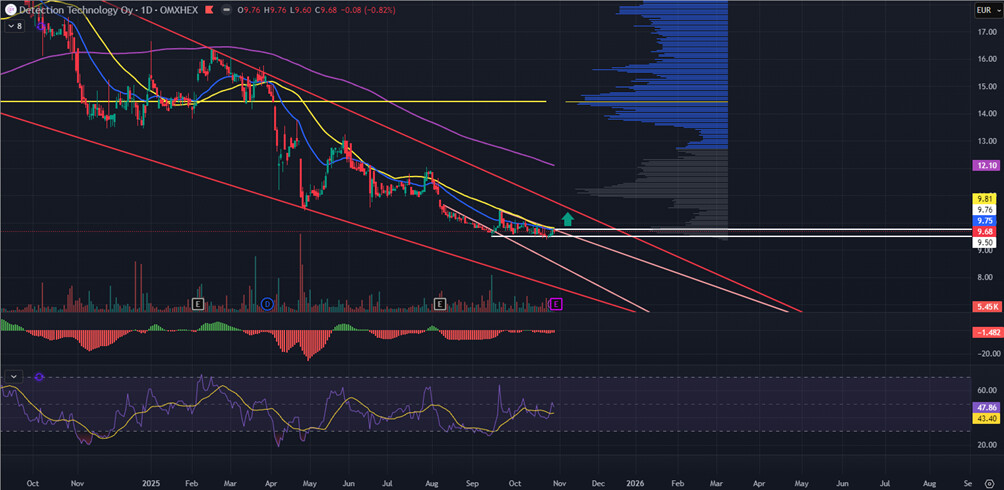
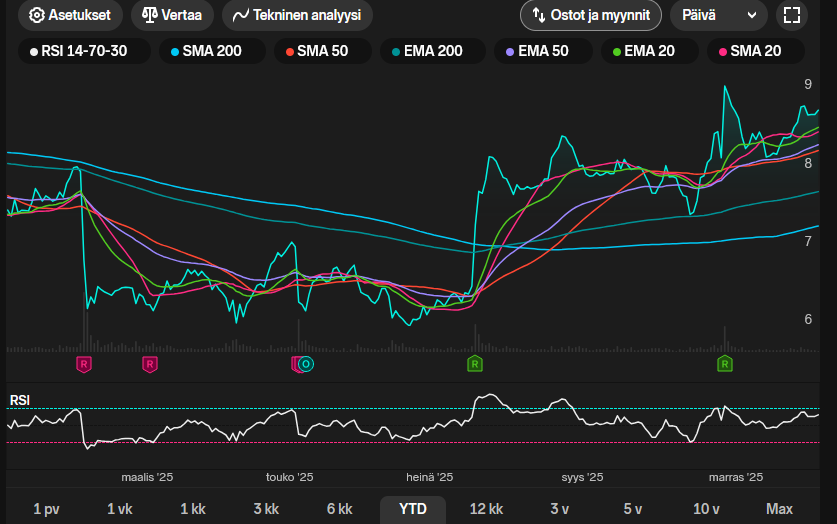
How do the Tires look? I was looking at the RSI, possibly a trend reversal?
2 Likes
In my eyes, we are most likely in a corrective wave downwards. This would be invalidated if the previous peak @ €9.14 were exceeded - and then it would be quite bullish. Before that, I’m watching to see if the level of approximately €7.30 - €8.00 would be reached.
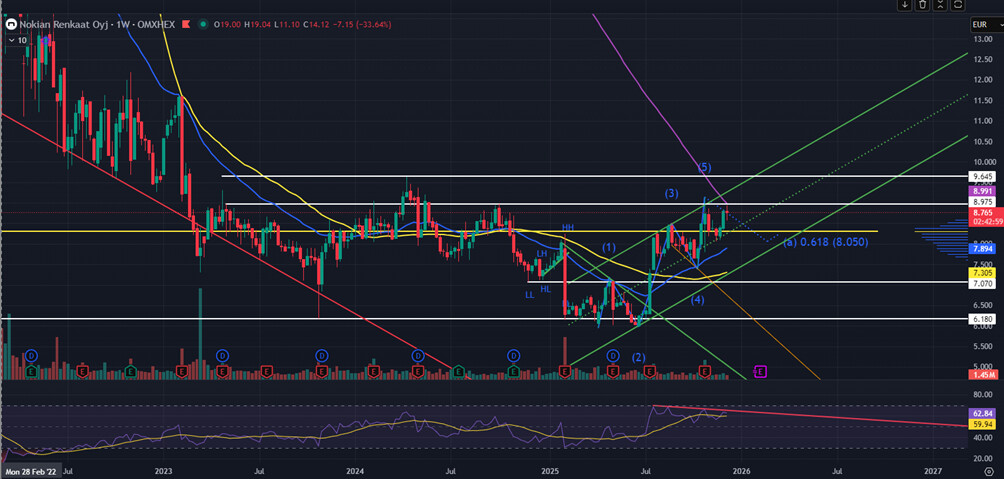
A very long-term chart confirms that the approximately €9 level is quite significant.
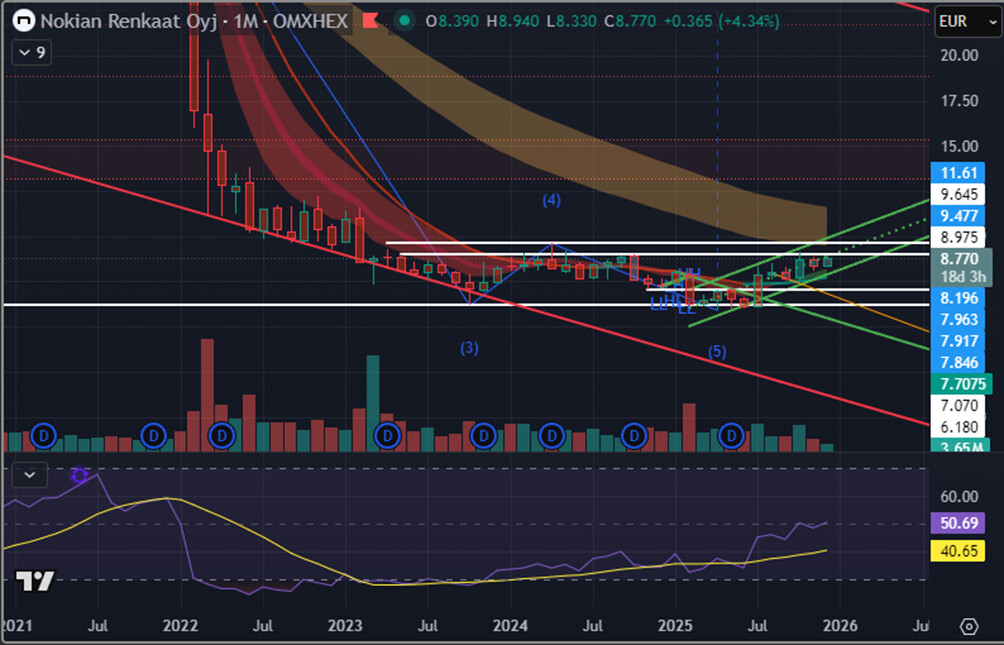
I’m not sure if I understand your question correctly.. There have been upward waves, we are again at a resistance level, and if the current upward wave remains below the previous one, the probability increases that the previous bottom will be tested @ €8.06. And an upward wave 1 → 5 is usually followed by a corrective wave A → C. And if, however, the previous peak is exceeded, then one can forget the idea of a corrective wave.
So I use my interpretation of Elliott Wave theory, trend lines, SMA and EMA averages, RSI and so on..
4 Likes
So what is the actual indicator for these there?
Okay thanks, that was clearer now. I didn’t know how to interpret the resistance levels from there.
It looks like we went above at least 9.14 now. It wasn’t supposed to yet ![]()
How does Huhtamäki look to more experienced eyes? Could this be a good stock considering the January rally? It has been declining all year, and the valuation hasn’t been this low in ten years. An optimist would see an IHS (Inverse Head and Shoulders) forming there, with the right shoulder just developing.
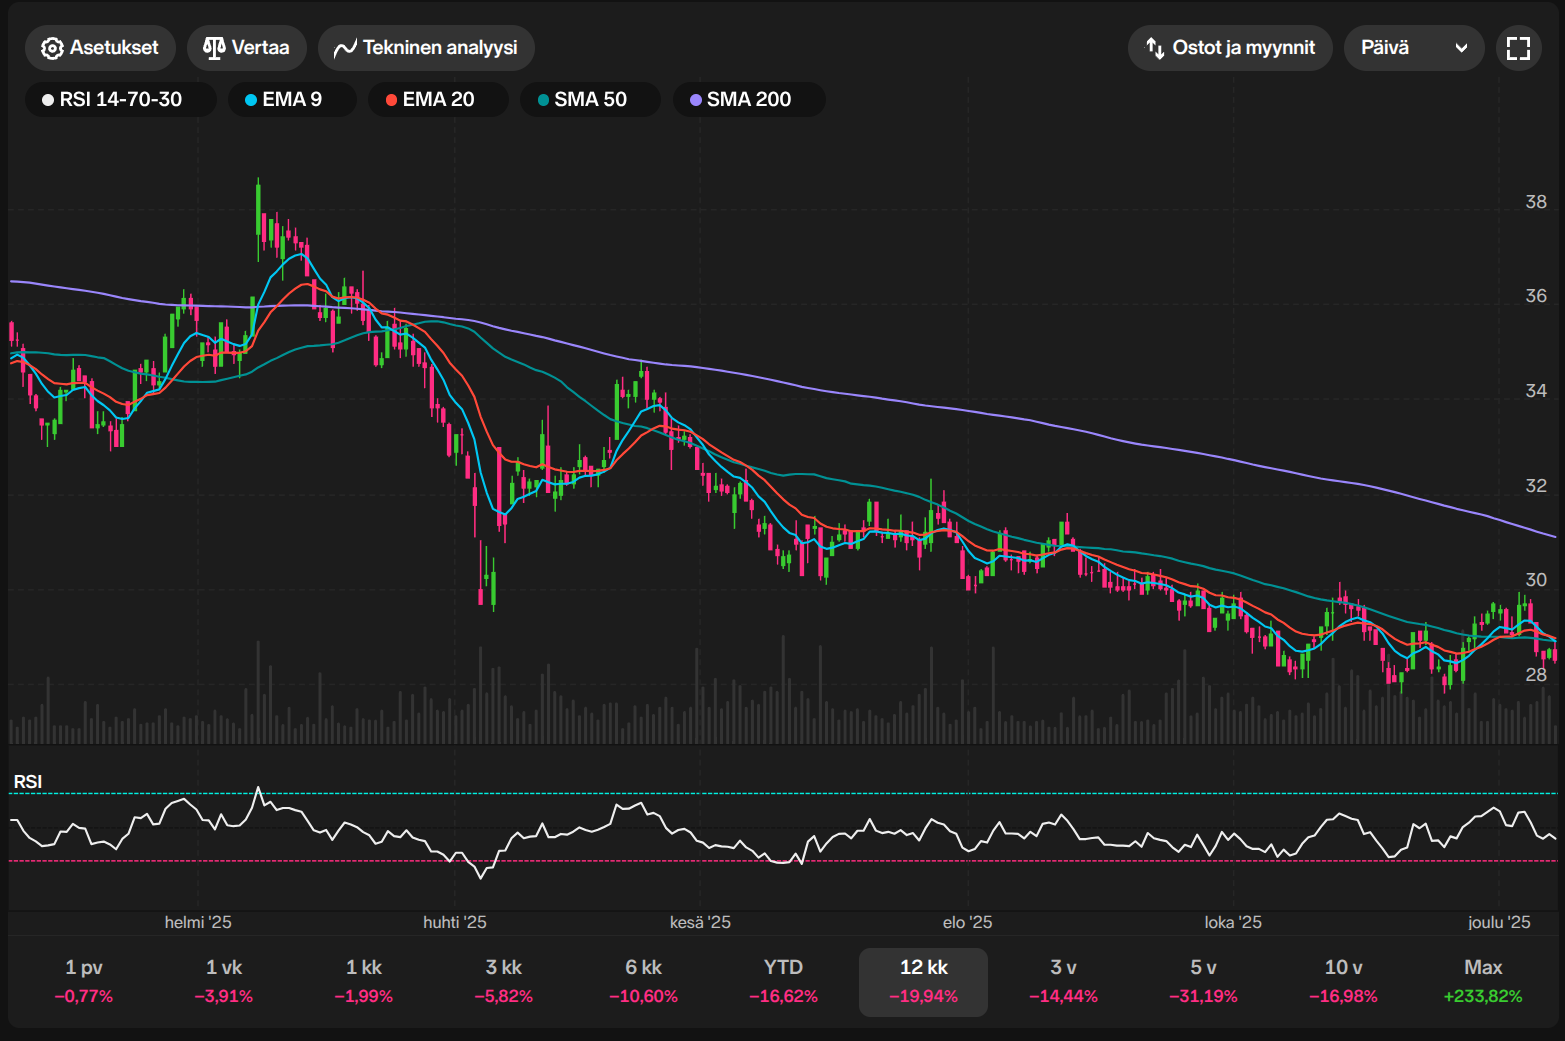
10 Likes
I’ve also secretly started eyeing that with interest. But only just started looking.
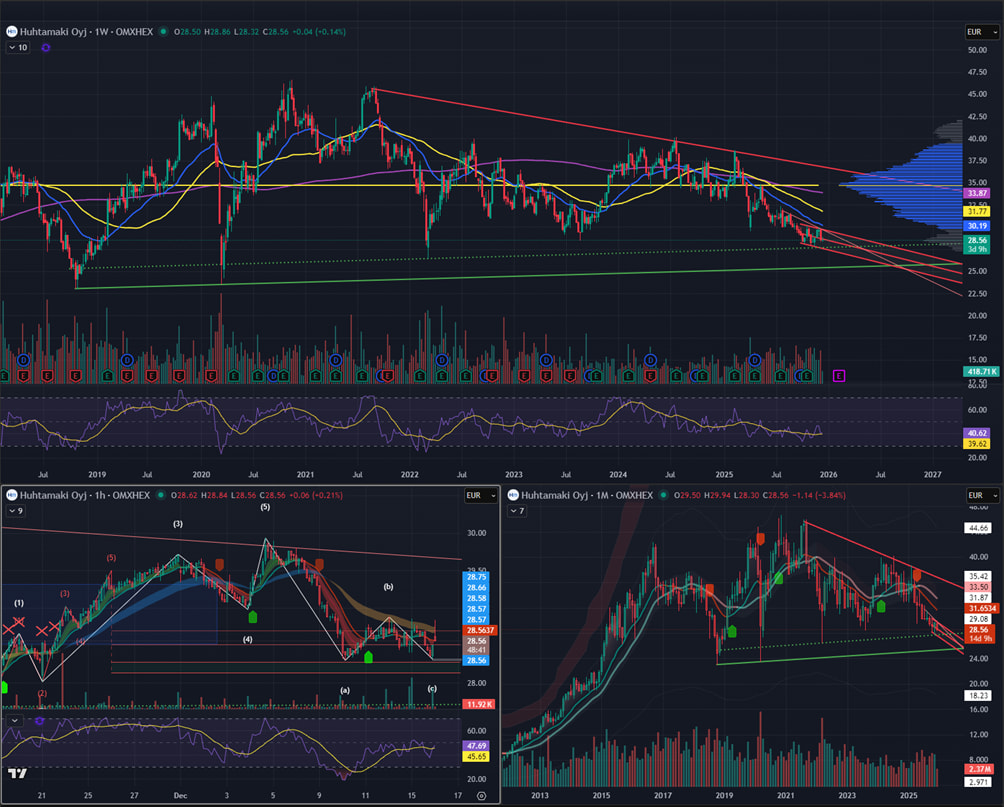
In many time horizons, the trend is still downward. On a daily level, there’s been a small upward surge from 1 → 5. Now, likely a small corrective downward surge A → C. And here, A is possibly already marked. The lower bound of the current trend would hit around the €27.60 level. Currently, a break above €29.90 would turn the picture positive, but I personally expect momentum to be sought from at least a bit lower.
10 Likes