Thanks for the reply and sorry that my question was a bit incomplete. The intention is to acquire these companies, which I consider high-quality in their field, for a slightly longer hold from a “discount store,” and I’m wondering about the timing: should I jump in now, or is there still room for a further drop from a technical analysis perspective? I don’t plan to catch a falling knife, but rather to ride an uptrend, even if it means missing the absolute bottom (and Cisco’s turnaround, for example, was an interesting observation). Of course, it’s always good to keep in mind that a lowered price can be perfectly justified and not just a temporary “good discount price.”
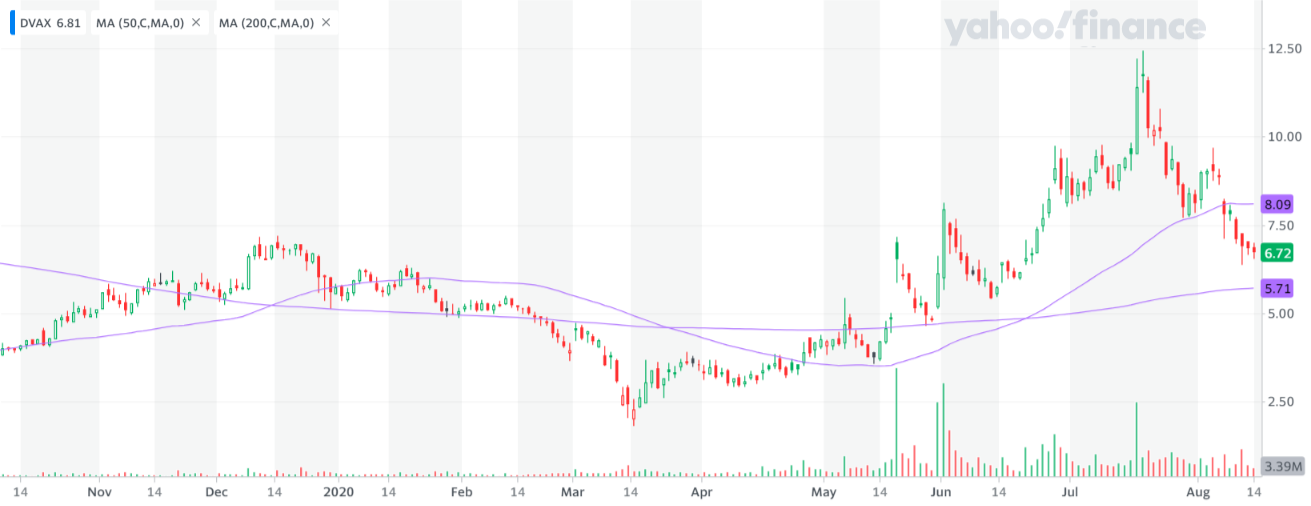
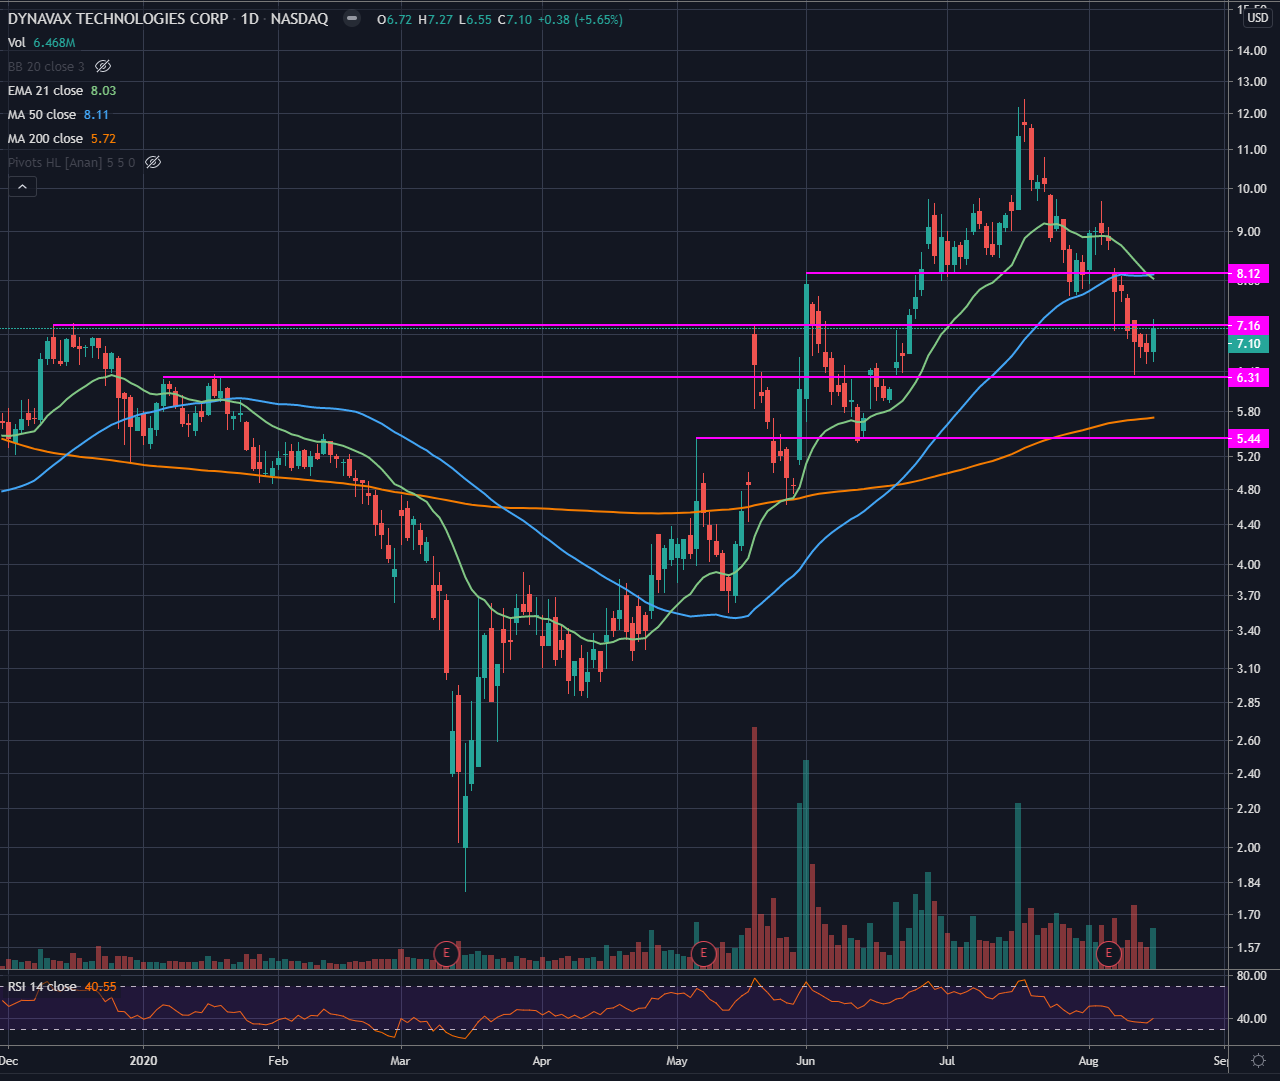
Dynavax’s hype is on a steep downward trend. From what level will support come, or will it go back to the bottom?
3 Likes
I would draw a support line at 6.5 euros.
1 Like
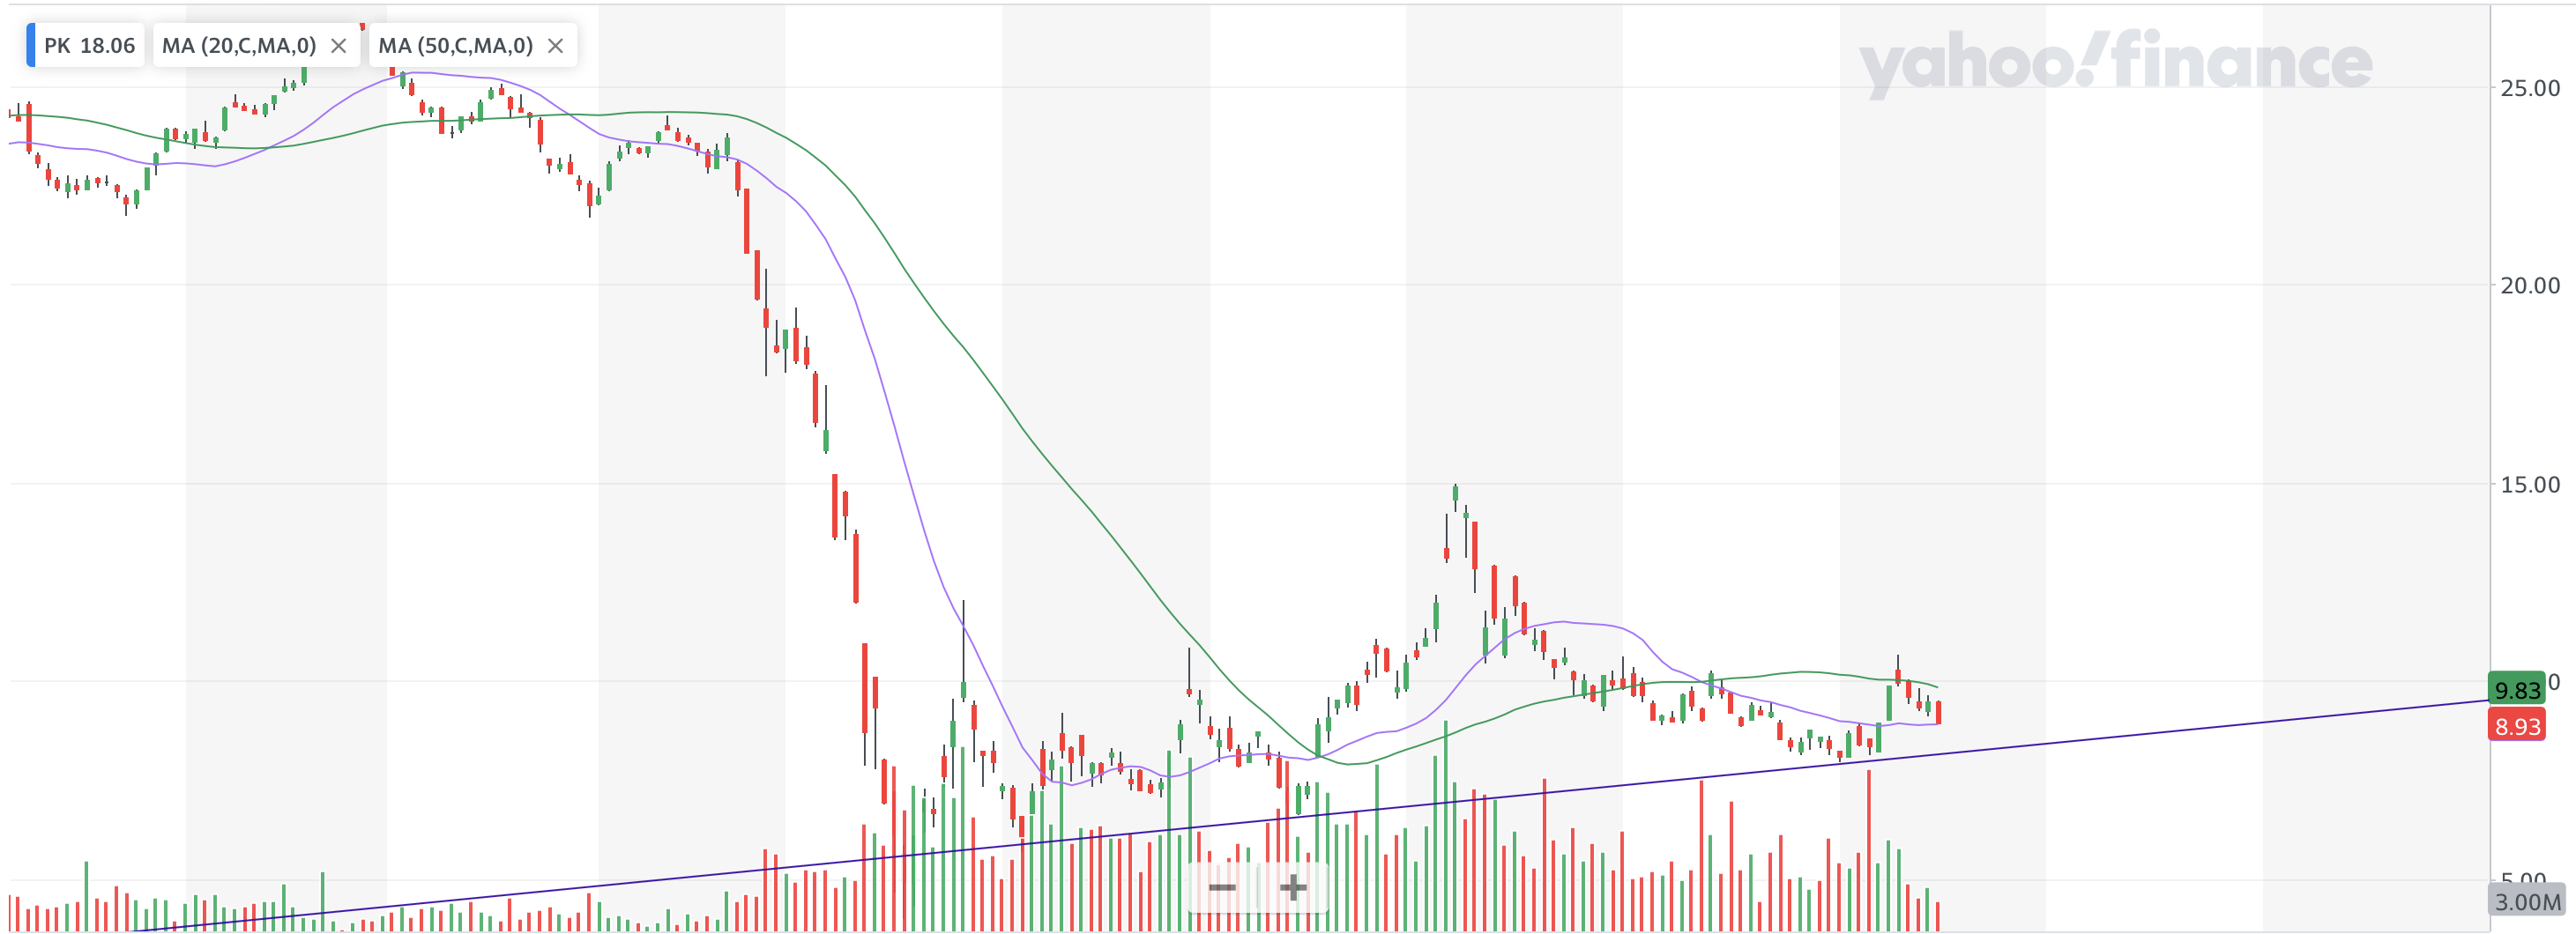
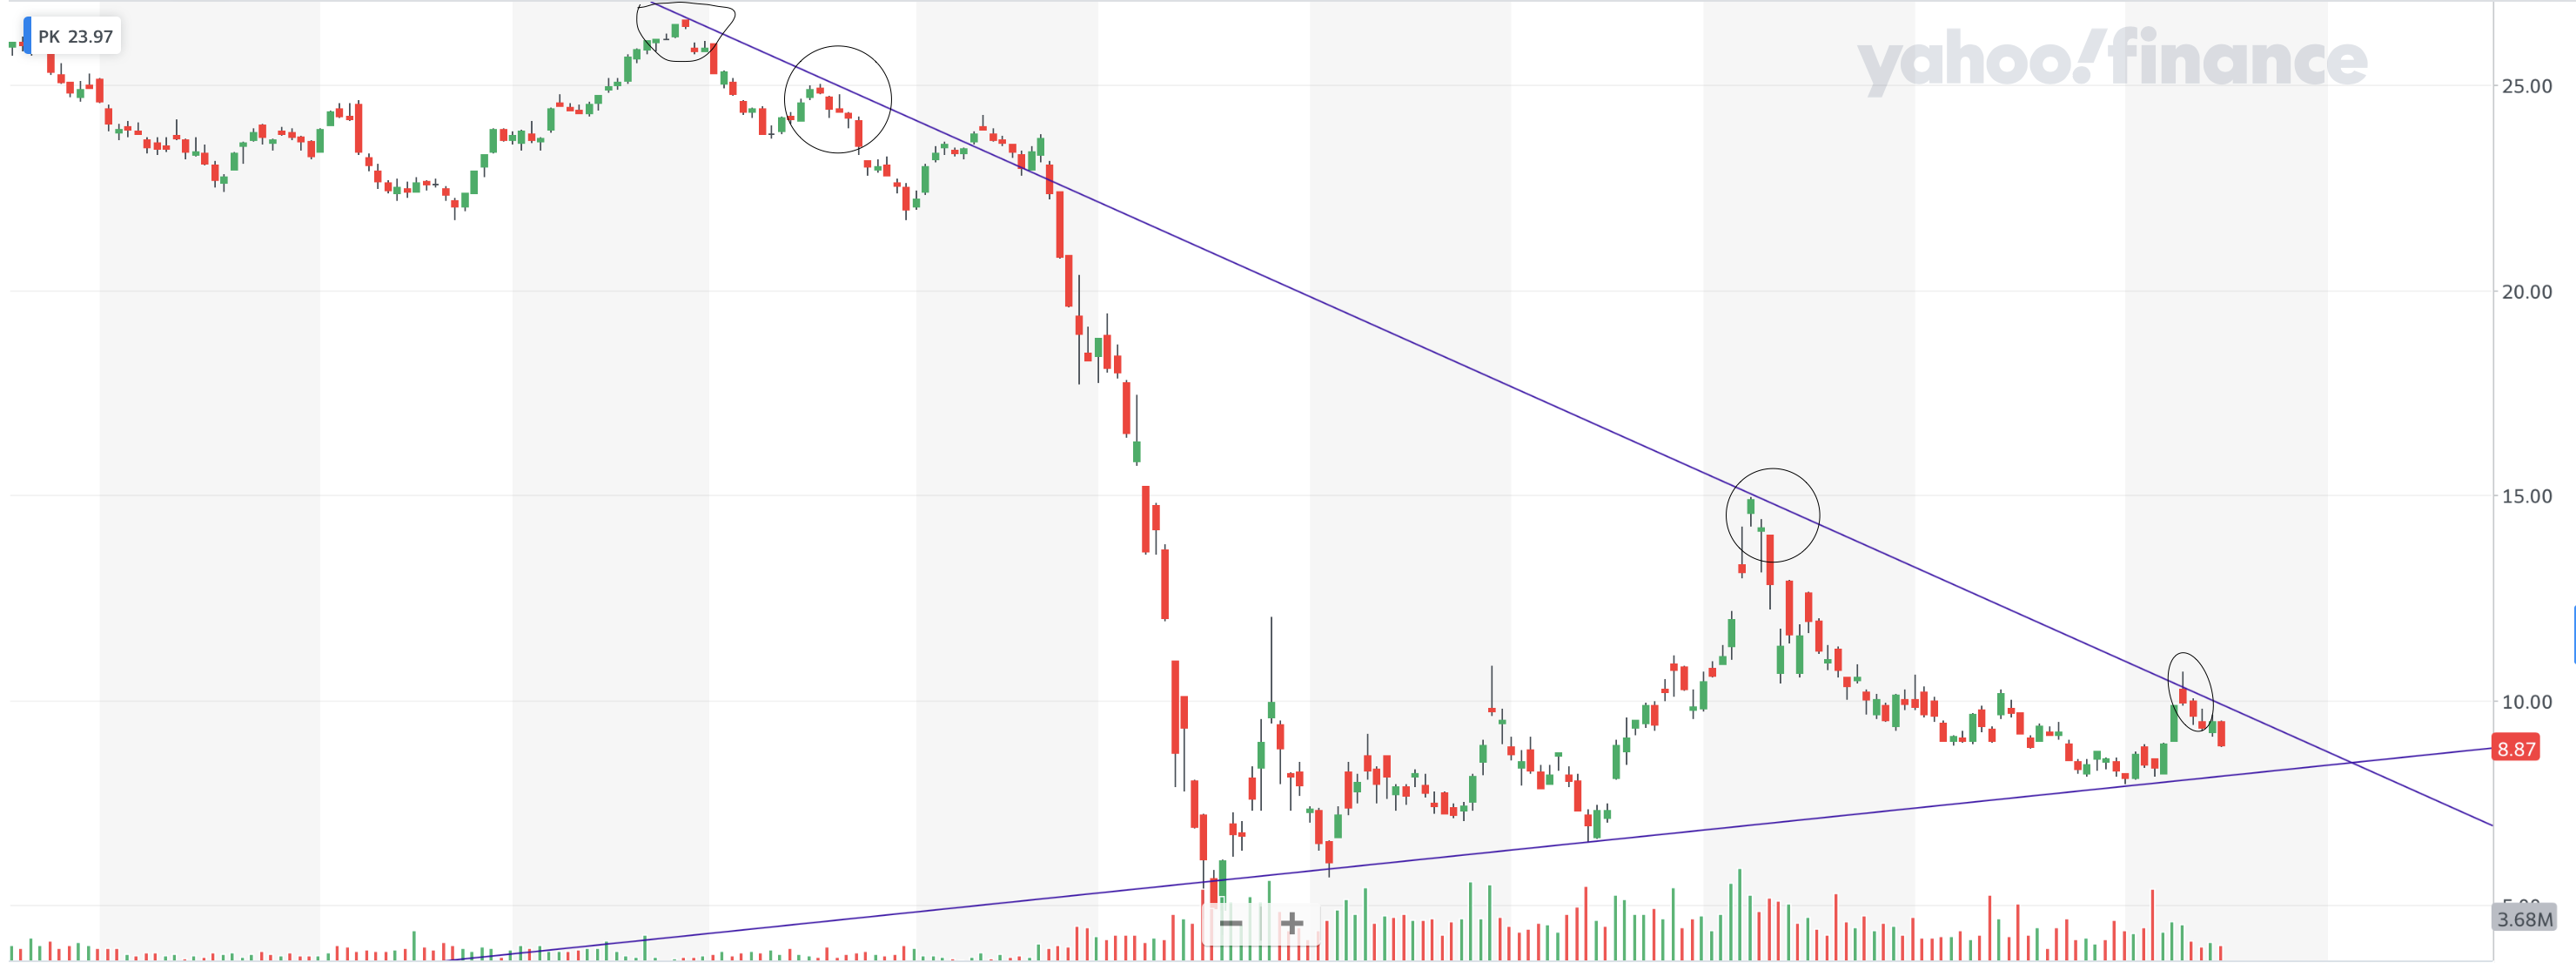
I have been following the development of Park Hotels and Resorts (PK) since early summer, always thinking that there is no hurry to buy into the hotel and accommodation sector. The stock has made a few strong upward moves during the summer but has since returned to gather momentum. The trend looks upward to my eye, but if someone could take a closer look, I would be very grateful.
The decline that started last week after an almost 20% rise seems to have stopped at the SMA 20. Is the lower bound of my rising trend drawn correctly if I try to take an initial position from there, or do you notice anything alarming that would break the uptrend from a technical perspective?
How would you interpret the company’s chart regarding support levels?
2 Likes
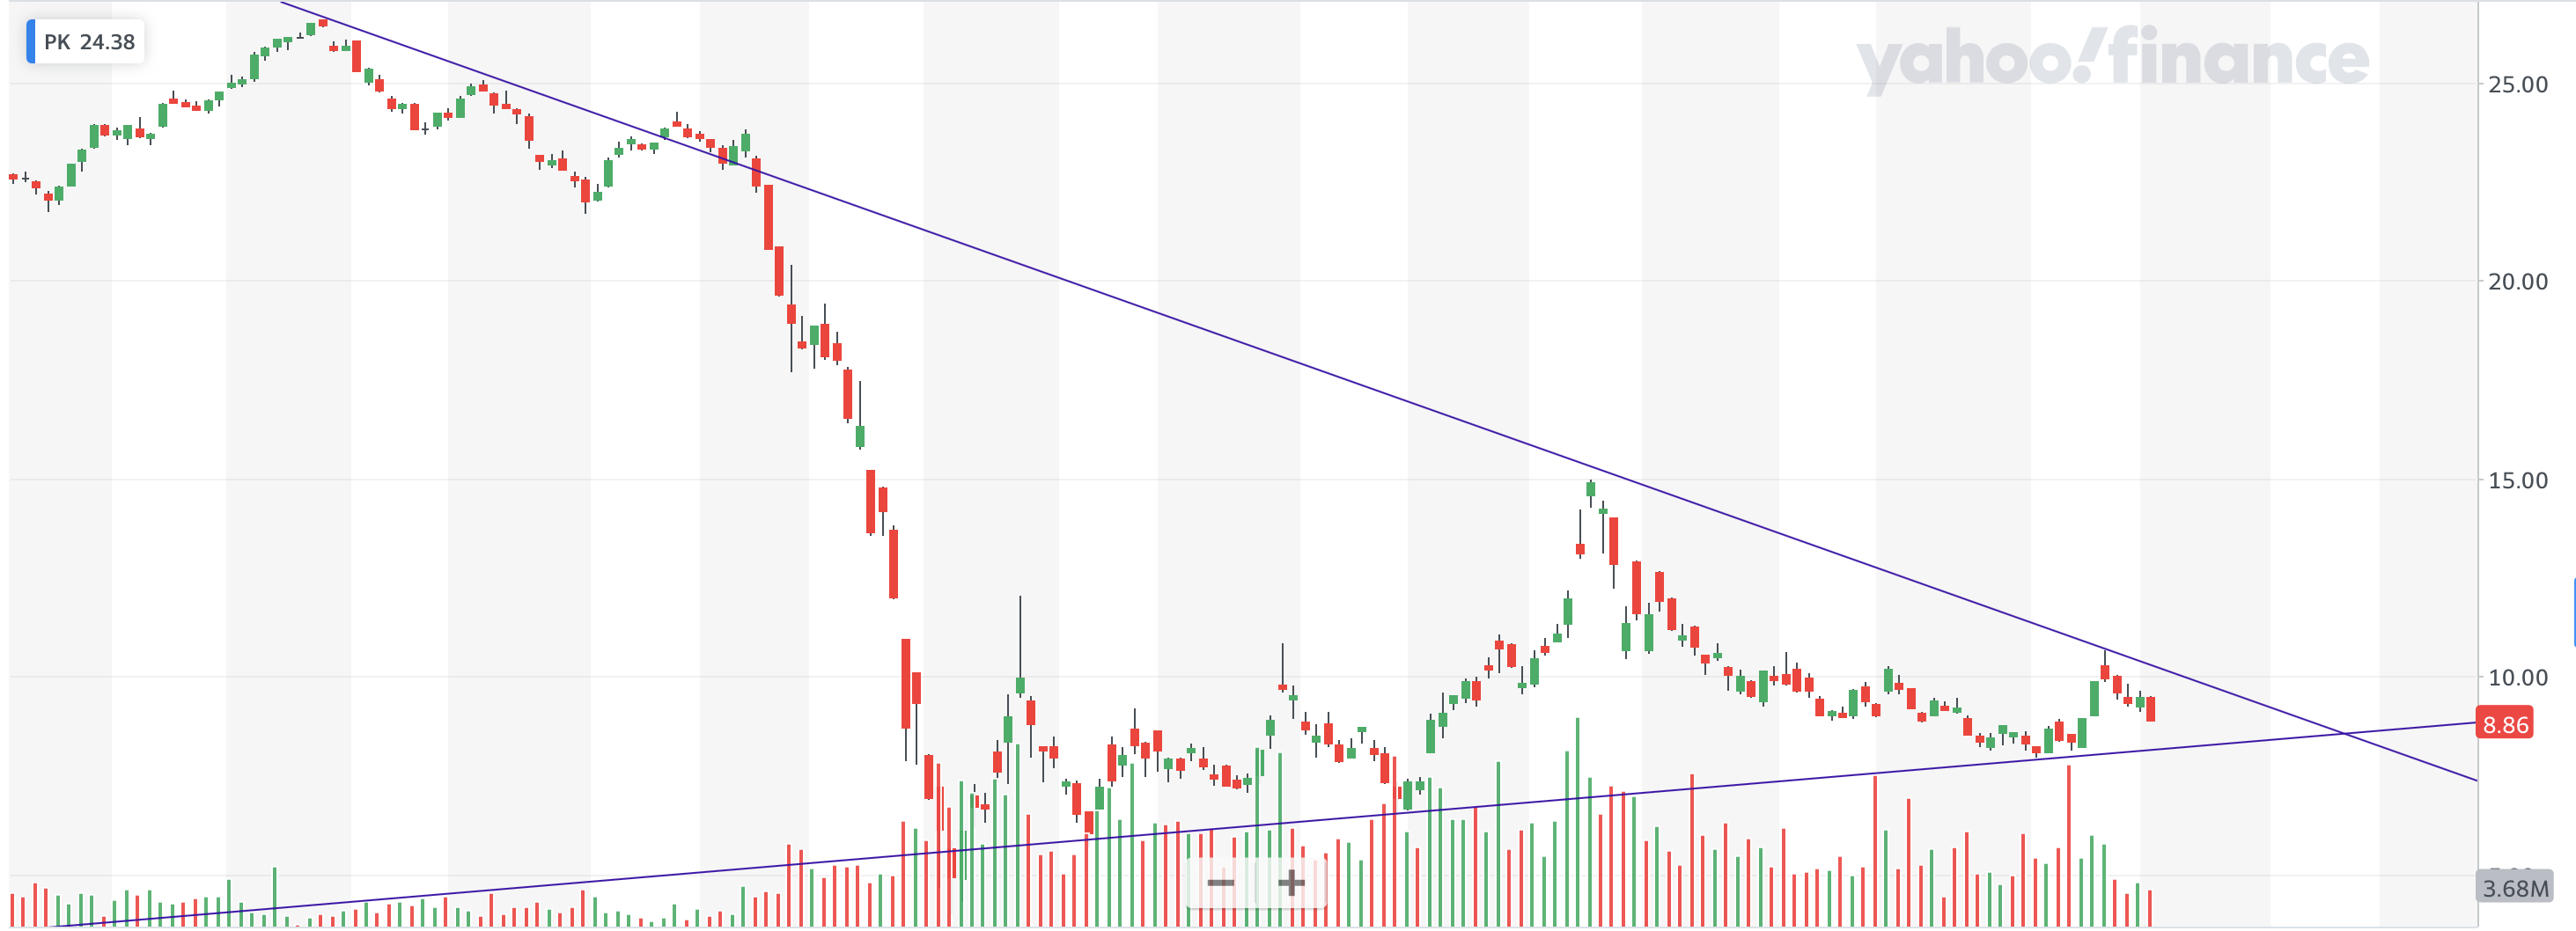
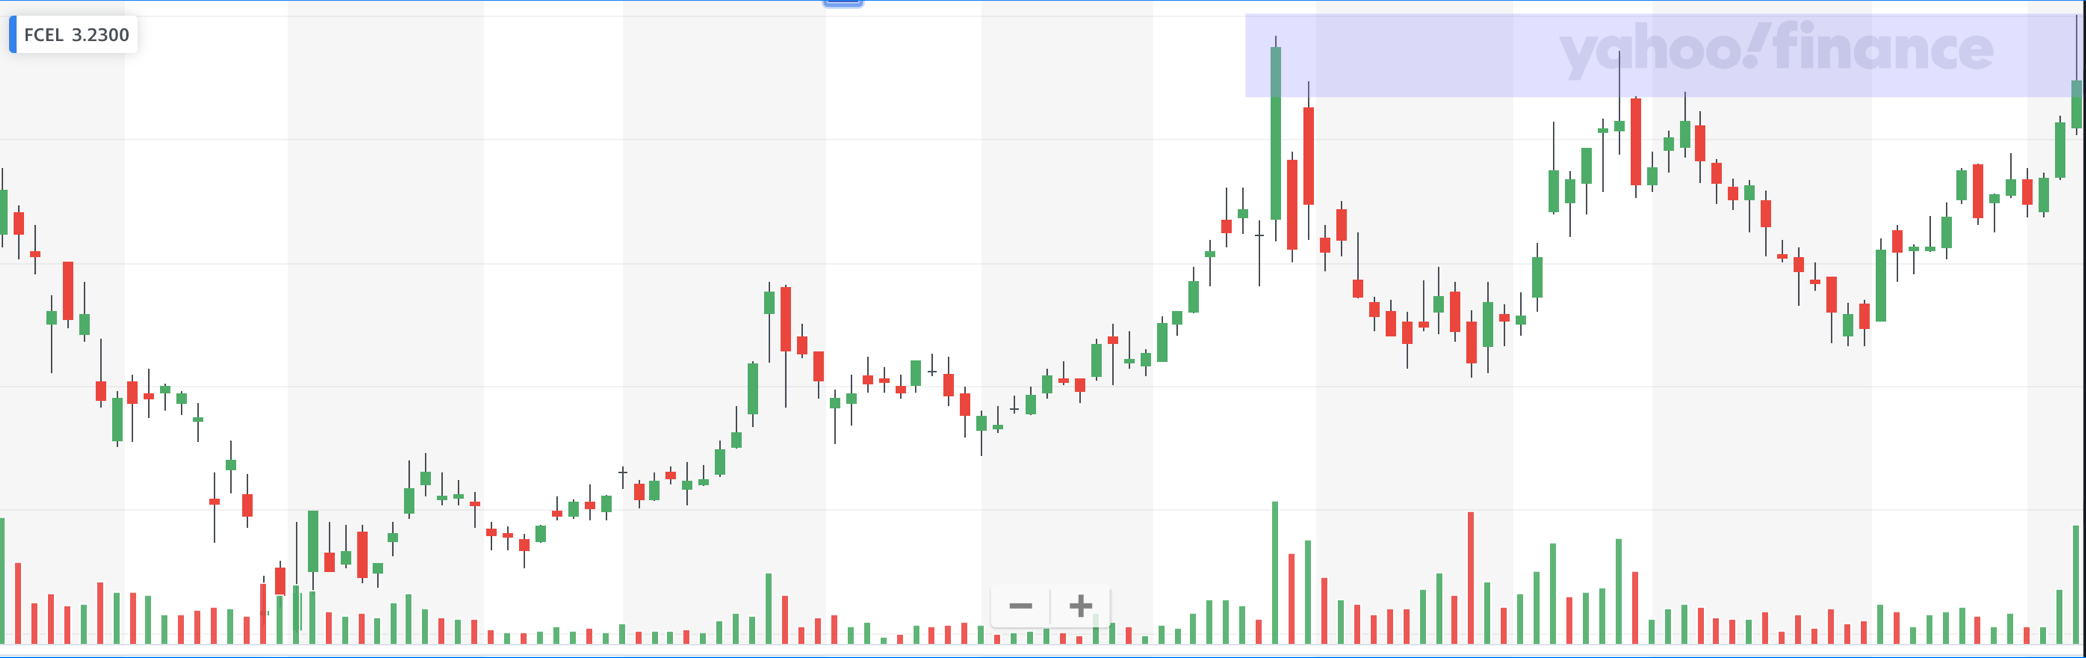
Can you draw a line across those spikes at February’s levels?
2 Likes
I can’t quite get the June and August rises to clearly hit February levels. Or should I look at this by removing the wicks?
2 Likes
Yeah, try drawing it without wicks through the August and June peaks, does it make any sense?
2 Likes
If one were to disregard the mid-February bounce as an exception (can one do this in TA? ![]() ) then one could draw a symmetrical triangle from this quite well? Or is the rise at the bottom much gentler than the top, causing it to turn into a descending triangle?
) then one could draw a symmetrical triangle from this quite well? Or is the rise at the bottom much gentler than the top, causing it to turn into a descending triangle?
2 Likes
It’s an aesthetic flaw, but the next few days will show how the price reacts to those lines.
2 Likes
A descending triangle would require a flat bottom. I classify this pattern as a symmetrical triangle. These tend to break out in the direction that preceded the pattern’s formation. But did the pattern start forming in February (decline) or June (rise)? Worth watching. A potential buying opportunity would only occur if one or two candles close above the upper boundary and volumes increase.
2 Likes
Dynavax support and resistance levels in purple. Additionally, the 1D MA200 (orange) can provide support.
2 Likes
ACB: Good bull flag? I can’t upload a picture from mobile right now. Normally I wouldn’t touch this, but it looks like a good trading spot to my eye. I might buy if and when it breaks upwards. The stock is the 11th most popular on Robinhood, so there could be hype for a quick rise. Earnings seem to be coming only on September 9th, so no major fear of bad news before then. Opinions?
Metacon: Common sense says the chart looks like these are only good for starting a fire in a sauna, but does TA agree? When is it time for the last rat to leave the ship?
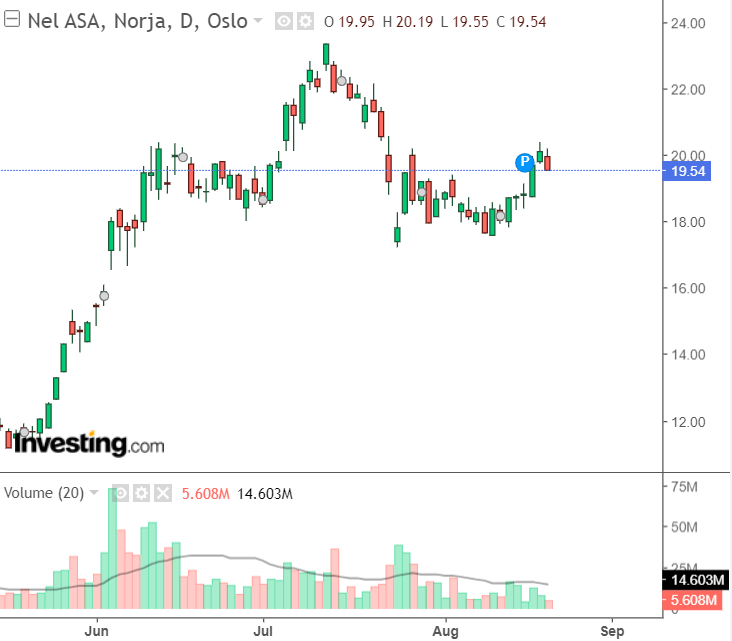
Has anything significant happened with Fortum from a technical analysis perspective? It seems to have been trading between 17.7 and 18.1 euros in recent days, but could there be a chance for an uptrend if the earnings report (osari) is even in line with expectations? At least, we are far behind the Finnish target prices.
Metacon is currently struggling with the EMA 50 (D), so let’s see if it stays above or goes down. A quick look shows that there’s a pretty free fall downwards before the EMA200, etc.
3.50 vs 3.36 = 4% - no way can that be read as a double/triple top. Clear breakout, but so far the continuation is missing, so it’s bearish if the day ends like this.
6 Likes
Hello! I can’t link the chart for AMAT (Applied Materials) here, but can someone take a look at it and tell me what it looks like from a technical standpoint?
Good earnings, exceptionally unanimous Buy recommendations, but the stock is heading towards pre-earnings price, is everyone selling?
{“content”:“At a quick glance, quite a neat upward channel where it has been steadily rising within the channel for a longer period, RSIs are semi-high but not OB at D and W levels.\n\nI don’t see anything major technically there.”,“target_locale”:“en”}
1 Like