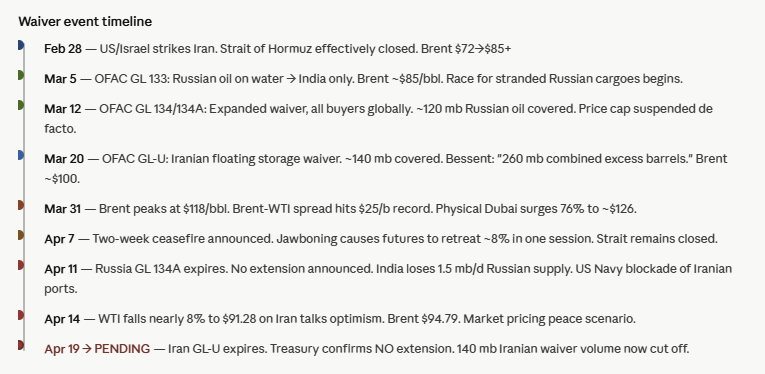
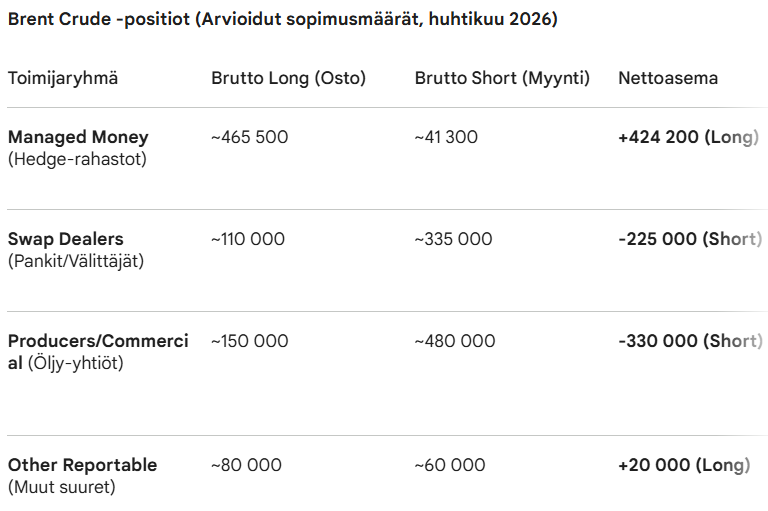
Hi. I decided to make a separate thread because, although the matter is related to the security situation in the Middle East and oil, dealing with it on a large scale requires a broader discussion of options and futures market mechanics, and I would appreciate a focused discussion and criticism of a rather unlikely but possible scenario I have put together. Admittedly, this scenario is historically very unlikely, but I feel it is worth a thread because it could have implications affecting the entire securities market.
Right off the bat: This is not a “probable” situation or forecast for which one should start placing bets. Let’s focus on risk analysis rather than speculating with dollar signs in our eyes. The situation is very strongly influenced by how the situation in the strait develops over the next 2 weeks, and that is probably impossible to predict. I will not attempt to assess this geopolitical situation here. Instead, I will focus on a premise where the closure of the strait is assumed to continue for at least another 2 weeks.
History’s Greatest Short Trap?
The futures price of oil ($95) is now dropping as if the war were already wrapped up. It has come down 15% in a week. Volatility is at a maximum: For example, Trump’s tenth virtually content-free “war is over, we won” comment momentarily tanked the price by 3% at night. Similarly, very sloppy, sourceless tweets or comments from the U.S. administration cause extremely wild moves. Right now, it seems the market is trying to anticipate Trump’s “drop like a rock” scenario, but I believe that in this game, speculation has completely detached from physics. The irrationality of the paper market is also evident, for example, in movements where even the embargo on Iranian oil drove prices down over the long term, even though the measure directly worsens the global supply situation by removing 2 million barrels per day of supply.
1. Physical Reality vs. Paper Illusion At the same time the futures are trading below a hundred, the physical side is screaming bloody murder.
-
Dated Brent: Traded at the beginning of the week at $148.87. Buyers are paying up to a $20+ premium on top of this for quality and location.
-
WTI (Cushing): The physical price is $114, even though the May futures are lagging behind.
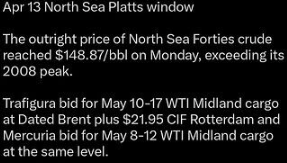
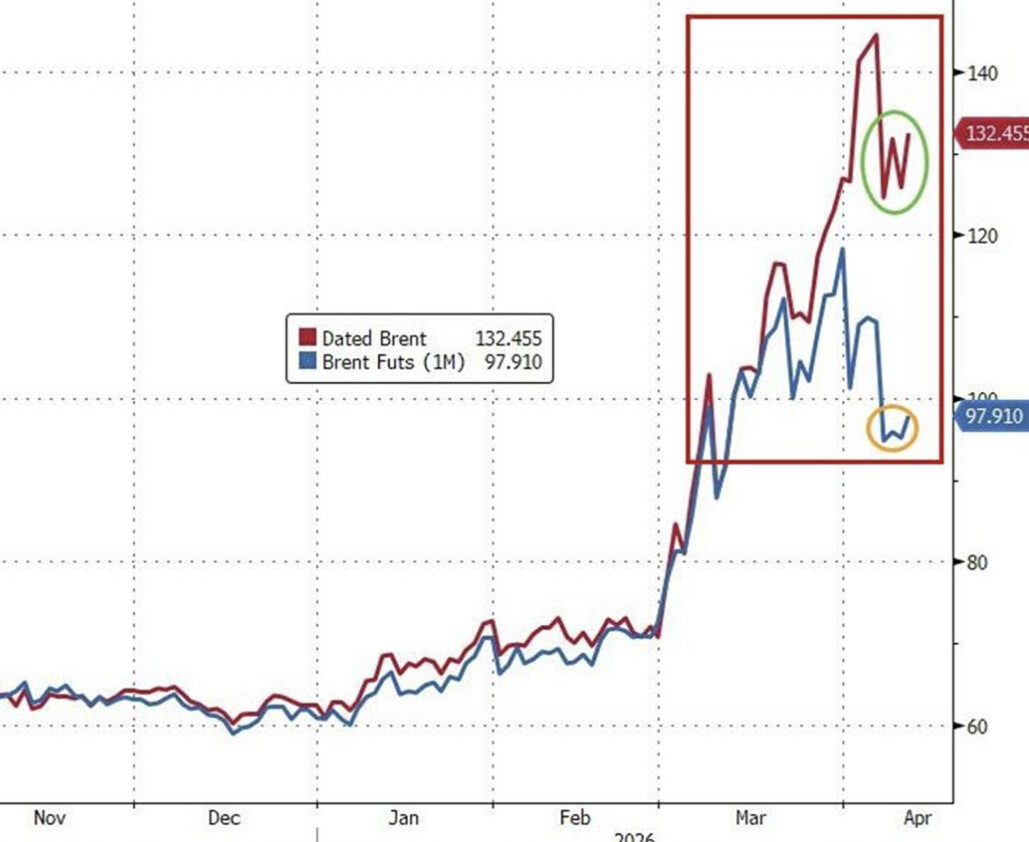
Physical barrel prices indicate that acute shortages have reached the West. The amount of oil on water has dropped by an estimated 35% from March levels off the coast of Europe. The cutoff of shipments from the Persian Gulf is only now hitting due to long delivery routes. Although not much oil was imported directly from Europe straight from the Persian Gulf, a very large portion of it has been imported through intermediaries, for example, via the Turkish hub or as refined fuel either directly or through the United States and India, for instance. Inventories are thus emptying, and “paper oil” does not warm refiners. At the same time, the situation is that oil markets are global, and through prices, the shortage in Asia is also spreading to the West. The last shipments from the Persian Gulf arrived in Europe during this April. Even if the closure ended today, it would take a month for the flow of physical oil to return (and even then it would be limited due to infrastructure damage).
2. Futures Mechanics Force Convergence
Futures mechanics: The paper market can live its own life through the month, but at the end of the month, the Brent future is settled against the Brent ICE index, which is based on actual physical barrel prices. If the price difference between physical and paper is $50, and the settlement date mathematically forces them together, the market must either crash the physical world (unlikely, due to acute shortages, delivery times, and the existing closure) or rocket the prices of the paper world. There is no other option, so at the end of April, we will see which one yields.
The index is calculated at the latest on the business day following the settlement date as an average of relevant Dated Brent quotations, physical forward trades (21-day BFOET), and their associated price differentials. The calculation is relatively complex, but overall it causes a convergence towards dated prices, because otherwise arbitrage would form in the market. You can read more about the ICE Brent futures settlement calculation here: Client Challenge
3. The Mathematical Trap
Open Interest (OI) in the oil markets has exploded to a historical record of 19.8 million contracts. On paper, this corresponds to 19.8 billion barrels, or nearly 200 times global daily consumption.
Tremendous pressure has concentrated on the June Brent future (LCOM6):
-
Paper OI: About 800 million barrels (800,000 contracts).
-
Physical Supply: Actual North Sea (BFOET) production in June is only about 21 million barrels.
For every physical barrel, there are 38 paper barrels. When these 800 million “paper barrels” have to face the reality of 21 million barrels on April 30th, the door may be far too small.
4. Scenario: “Reverse Corona”
In 2020, WTI traded at -$37.63 because long positions were trapped without storage space. Traditional supply/demand models predicted a price of around $10/barrel at lowest, but a financial market anomaly pushed WTI deeply into the negative momentarily. Now the situation is the opposite: Shorts are trapped without oil.
In 2020: When WTI turned negative in April 2020, total Brent Open Interest (OI) was around 2.2-2.5 million contracts. The market was large, but it mainly consisted of commercial participants trying to cope with filling storage tanks. Now (2026): Brent OI has exploded to 8.3 million contracts. The market thus has nearly four times the amount of “paper” bets compared to the largest collapse in history.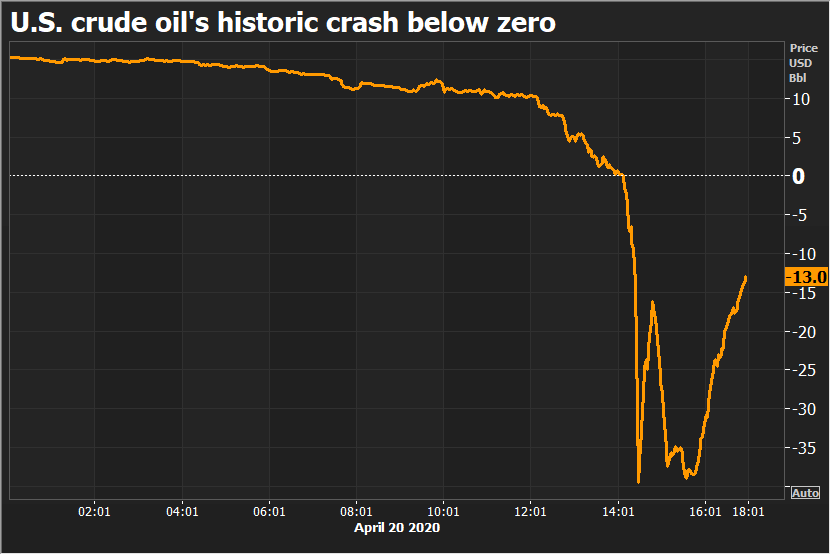
Brent is the global price setter relative to WTI, with about 80% of the world’s physical crude oil tied to it. Because this linkage is global, the stakes and capital flows are multiplied.
If the premise holds, I predict a two-phase unwinding:
-
Phase 1 (Apr 21): WTI futures settlement. The initial panic when shorts realize there is no physical product. Shorts are closed by buying futures. This is just a taste. WTI futures are physically settled, so the panic could be quite large. The rally might subside when WTI futures roll forward, unless the market realizes the beast lurking beneath Brent.
-
Phase 2 (Apr 27-30): A megalomaniac surge on Brent’s settlement day or a couple of days prior. If Dated Brent stays at the $140+ level, the futures are forced to converge toward the ICE Brent index.
5. Short Squeeze and “Overshoot” Numerous entities have increased their shorts, relying on Trump’s diplomacy. If a squeeze triggers, the price could momentarily rocket well above the “true level” as short sellers are forced to buy back futures at any price to survive.
Points supporting the case:
-
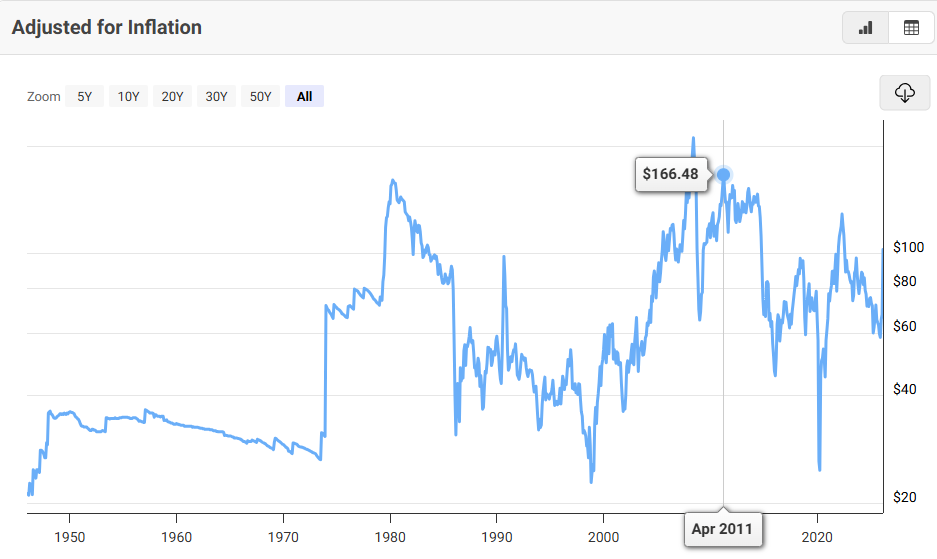
Historically, oil is actually quite “cheap” right now. Real prices were higher for years between 2009-2014.
-
By far the largest SPR releases in history signal a severe crisis. The record-high release of 400 million barrels in March 2026 is in a completely different league in terms of scale. For comparison, the previous largest coordinated release was in 2022, when IEA countries released a total of 180 million barrels.
-
Just yesterday, IEA’s Birol said that current prices do not reflect the full severity of the crisis or the tightness of supply.
-
The IEA has also talked about how, in addition to the previously largest ever 400M SPR release, more may be needed and it has stated it is ready for it.
-
In addition to the closure of the Strait, a significant amount of oil infrastructure has been damaged or shut down, and ramping production back up will take time even if the situation calms down. The IEA estimated in April that Middle East production shut-ins have risen to around 9.1 million barrels per day (bpd). According to Wood Mackenzie’s estimate, about half of this (approx. 4.5M bpd) can be recovered within days if tankers are able to move.
-
Retail short sentiment is massive. For example, on Hyperliquid, which institutions do not use, the funding rate has dropped to a level where shorts are paying an annualized 400-600% to maintain their positions. Social media is full of oil shorts. Even if regular shorts do not touch options directly, leveraged derivative products bought by speculative investors must also be balanced with options by issuers. On the other hand, institutions have likely also hedged against falling oil prices on their own account. Large players have certainly balanced their positions with call options. Meanwhile, oil-consuming entities may have bought expensive oil to protect their balance sheets against losses from a price drop.
-
Dated prices are at historic highs, the IEA continues to talk about the worst oil crisis in history, but paper prices are far from record levels.
-
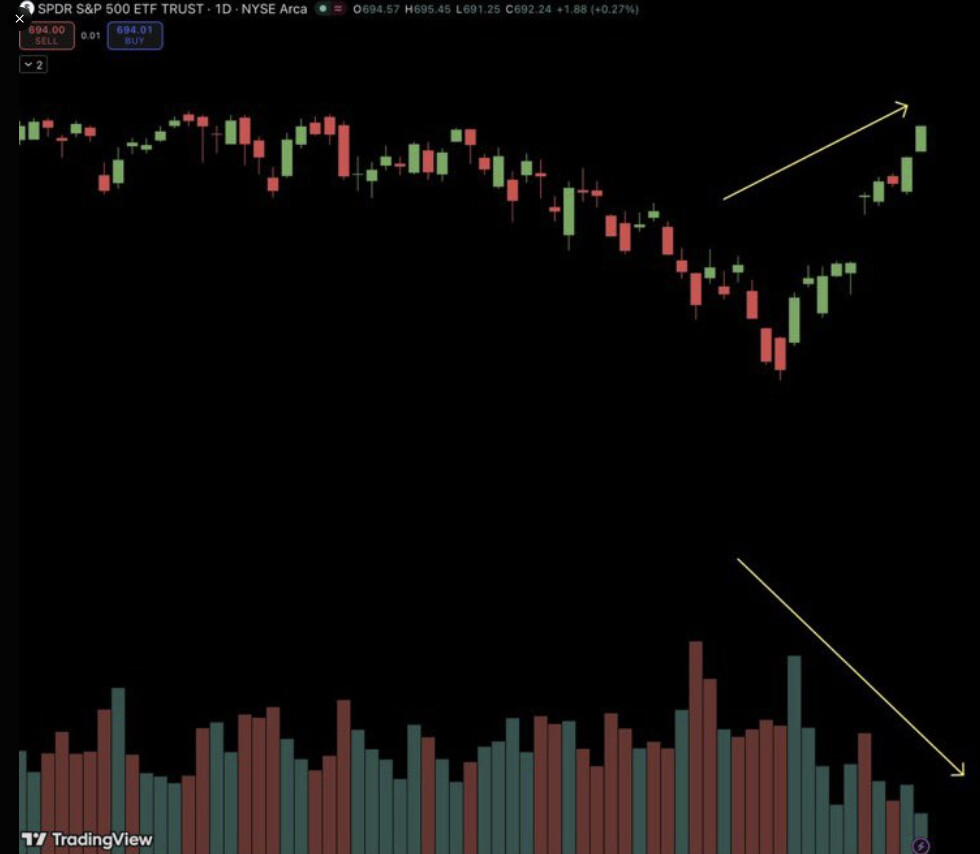
Stock markets have rallied strongly on the drop in oil, but volumes have been exceptionally low during the upswings. Even though the markets are pricing in a “crisis over” phase, big money still seems to be missing from the picture. Do institutions see the risk?
-
U.S. Incentive: The US could be a net beneficiary if it manages to lock in long-term oil supply contracts at record-high prices.
-
Even if immediate dated prices were to collapse suddenly, the index calculated for the futures uses a weighted average, so the settlement price of the futures may still end up higher than the latest dated price.
Points countering the scenario:* Prices of refined products, such as diesel, are declining. Refined products are less susceptible to speculation and more tied to physical prices. The decline might be explained by the large share of SPR interventions being in the form of refined fuel. To my understanding, SPR releases have only begun this month. Additionally, there have reports of potential shadow exports from India, where Russian diesel is being exported to Europe. However, the price may also be anticipating a normalization of the situation.
- Monday’s dated Brent at 140+ reflects Monday’s prices, when futures oil was 8–10% higher than today.
- If the market believes the strait will open in May, Dated prices could collapse in anticipation just before the April 30 settlement. It is true that even if the strait were to open tomorrow, the physical deficit will persist for weeks. However, the extra “fear premium” will melt away, and refiners will dare to draw down their inventories knowing that oil availability will return in 1–2 months, which could cause Dated prices to drop sharply on peace news. The downside potential is still very limited, at least in physical reality, because the deficit does not improve quickly.
- There are also a massive number of call options open. For example, airlines may have bought calls to prepare for the worst. If these major players start believing in Trump’s peace, they will start selling their long positions to lock in profits, offsetting the price impact caused by shorts. If the exchange (ICE) sharply raises margin requirements due to volatility, it will also hit long positions.
- China’s role: The world’s largest storer, whose oil flows and actual inventories are shrouded in mystery, may decide—or may have already decided—to sell oil to the market to curb prices, which reduces the physical premium.
- Transport through the strait has improved slightly as individual countries have obtained special permits. If a growing trend is seen, Dated prices may begin to anticipate it.
- The 2-week ceasefire officially ends on Monday, April 20th, the day before WTI futures expire. Opportunities for a permanent solution exist if the alternative is the continuation of war rather than protracted negotiations. However, subsequent negotiations, especially direct ones, have not yet been agreed upon based on public information.
Bottom line: The scenario requires that the closure of the Strait of Hormuz lasts until the end of the month and that Dated prices remain elevated. But right now, the market is primed for a major risk of a historic explosion, which could happen even without new escalations in the geopolitical situation, simply through the delaying of negotiations.
What do Inderes’ options and oil market experts say about the situation? Is there something I don’t understand that undermines the premise of the scenario even if it holds? What would the market impacts elsewhere be if the described rocket move happens? What counter-arguments to the scenario have I missed?
Disclaimer: I am not an oil industry professional and I don’t actually know anything.