Ilman muuta. No doubt! :![]()
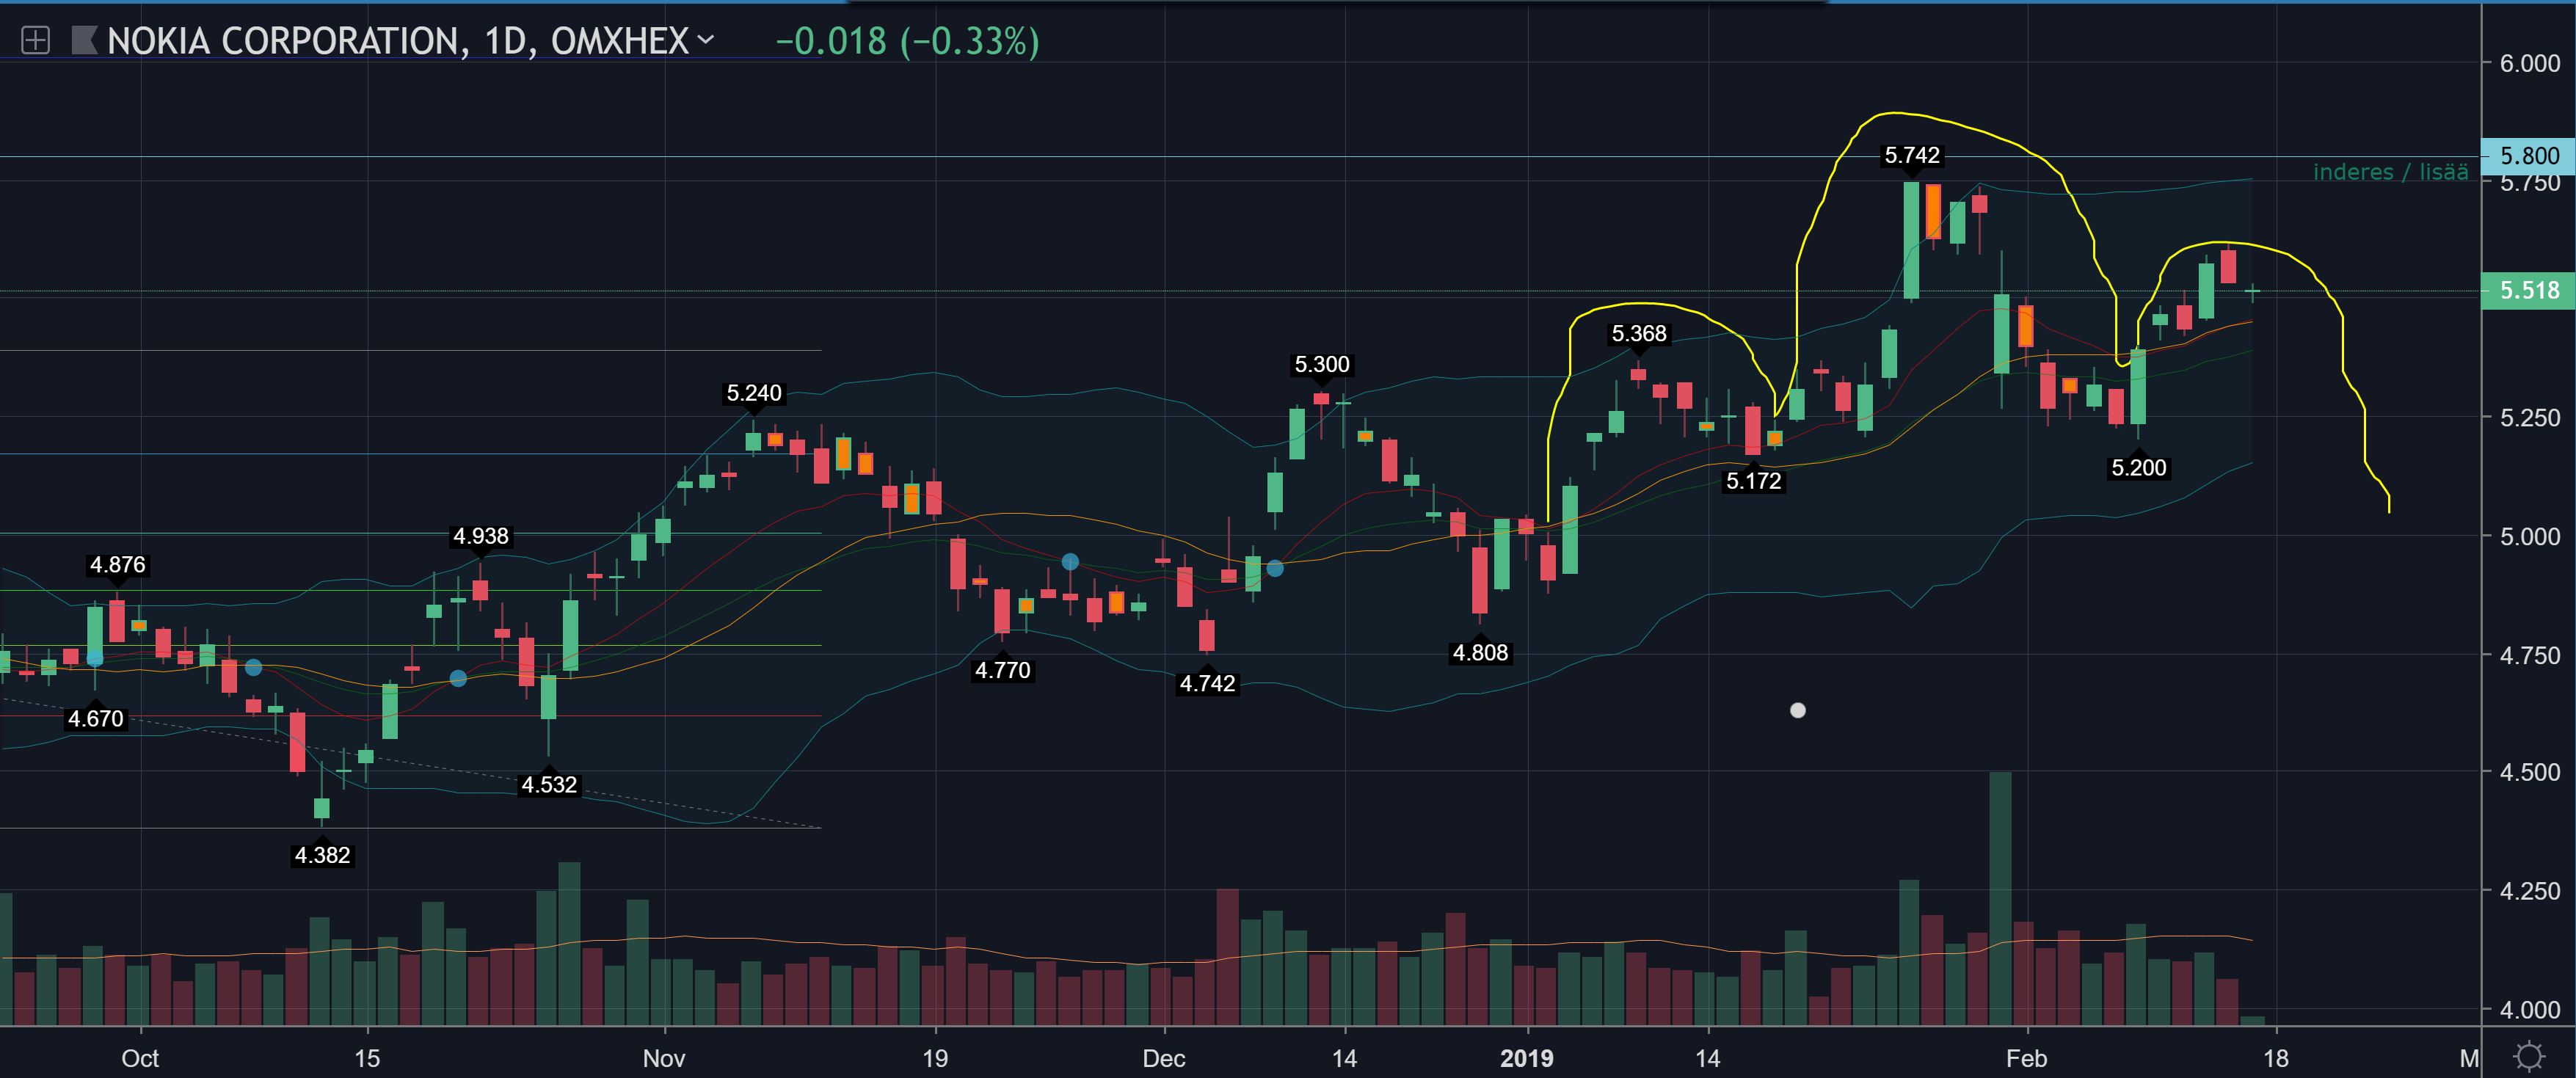
Stock market direction from a TA perspective
- Tom DeMark 6, will a new Higher Low be made today? (High 2814)
- the price is between Fibonacci 0.5-0.618
- daily consolidation is expected anyway, if not today, then Mon-Tue. The question is more about whether we will still stay at a healthy level after that, the price should not drop very close to 2438.50
3 Likes

Here’s my desktop for today, targeting Outokumpu, 5-min timeframe
- TradingView in the background, I recommend getting it if you’re serious about stock trading. You can easily link hundreds of different indicators to it, but these are a few I mainly use when looking for a buy/sell opportunity.
1 Like
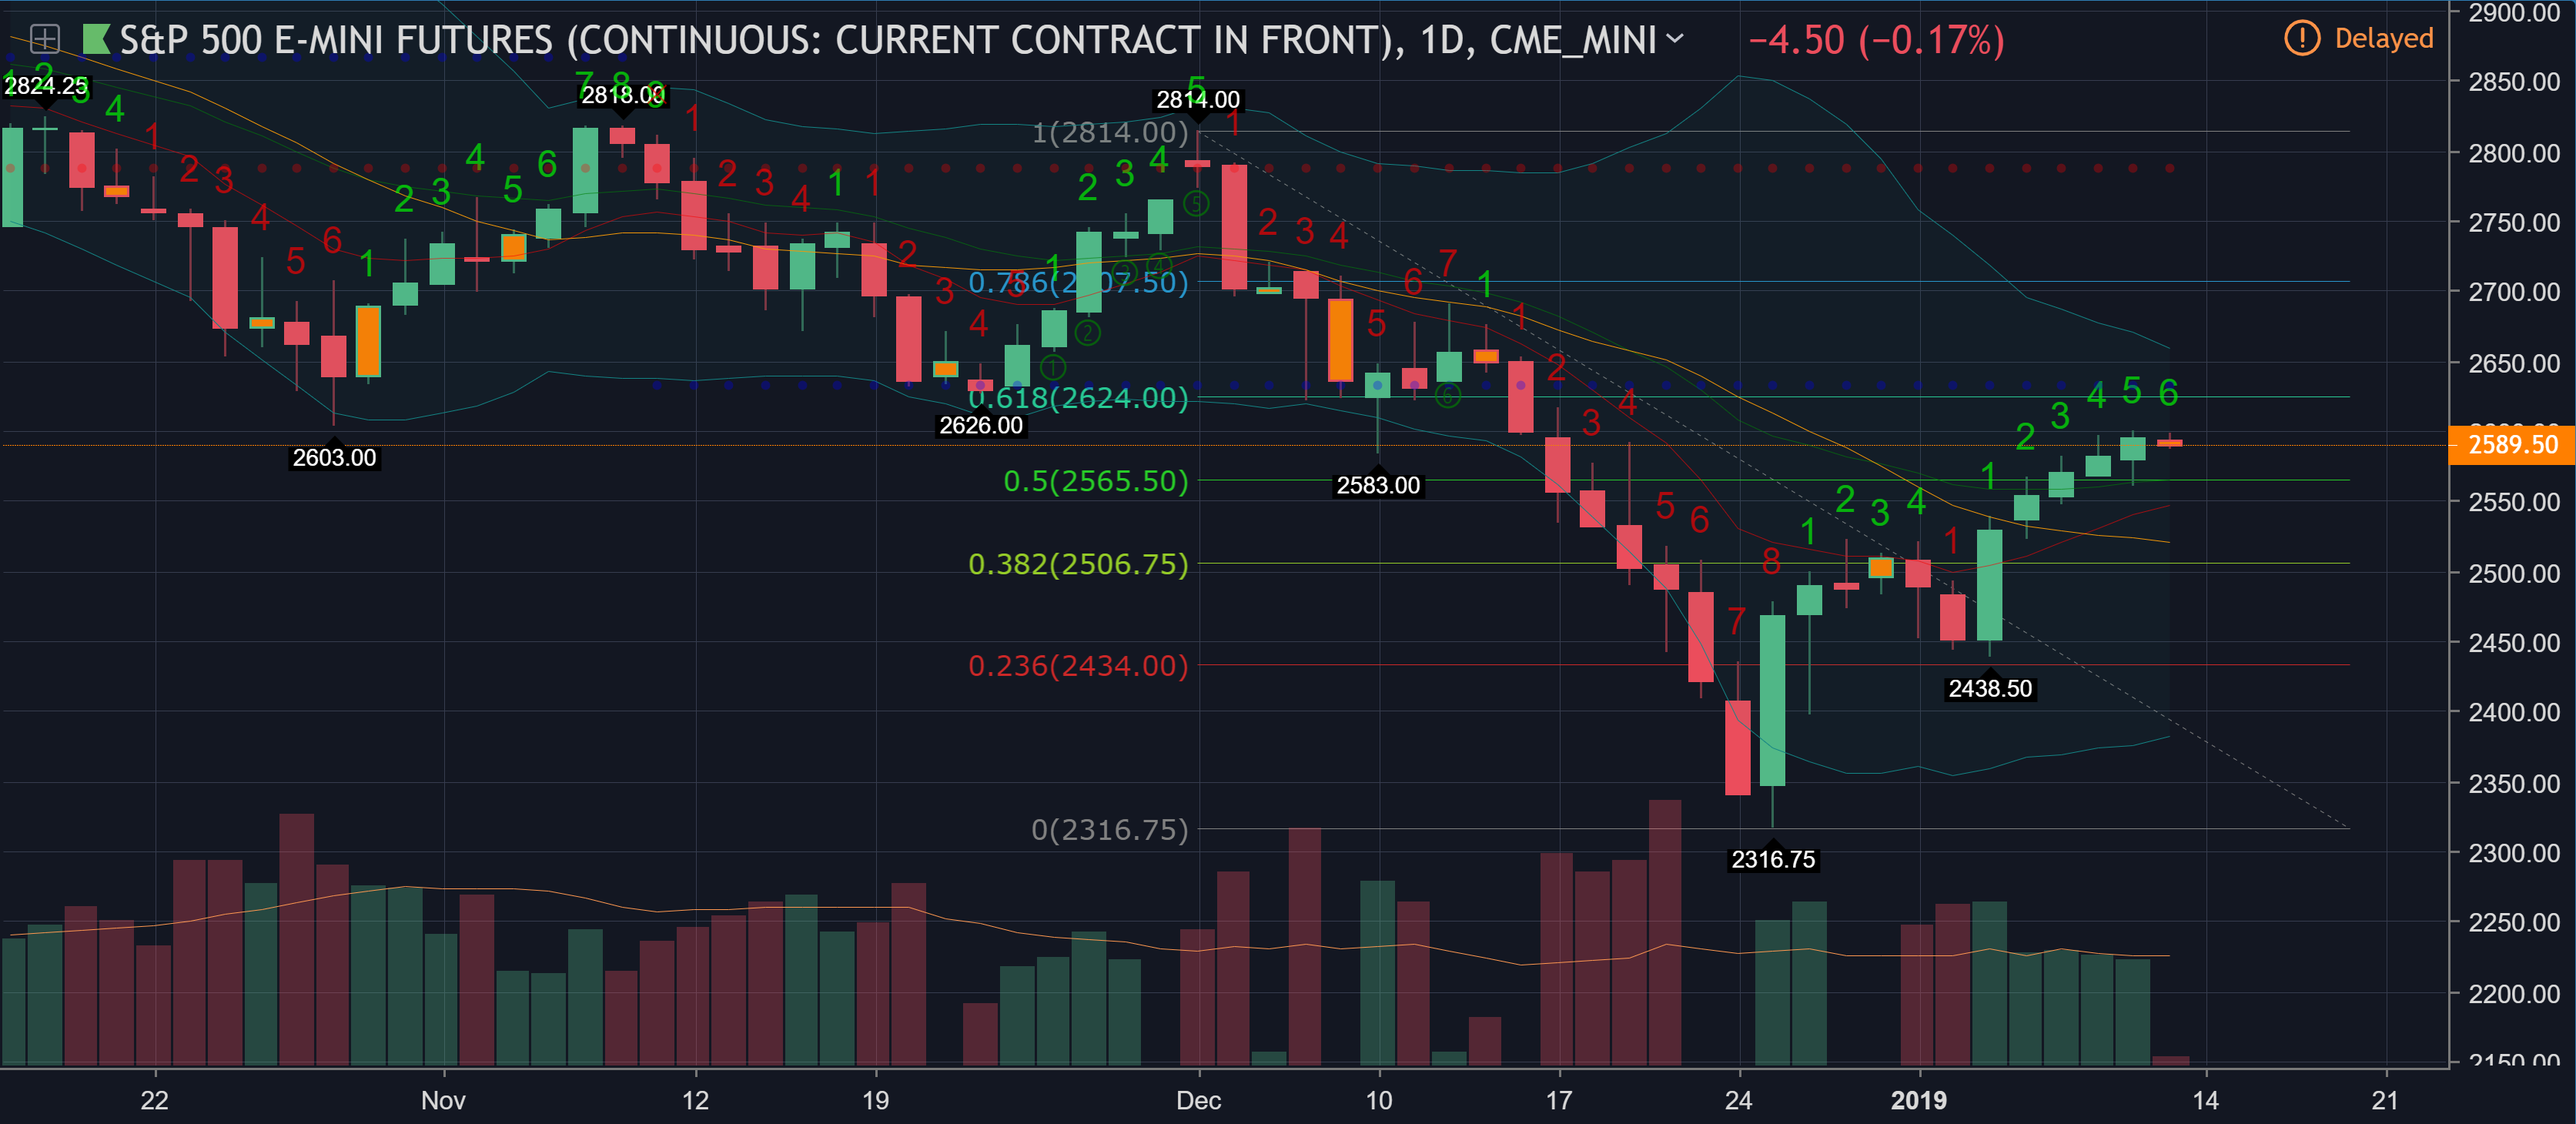
I was looking for bottom fish (“pohjaonginta”) value from the Daily level, where clear supports were found at 3.125 and 3.224
- I estimated that 3.224 was more likely and planned my scaling accordingly. So I started buying even before that, the first batch at 3.3, which was Inderes’ updated target price.
- I looked for the previous 5min Higher Low from 3.272 and placed a sell order at 3.275 (which hit well this time).
- This was about an hour-long trade, for which I spent the whole day, planning, etc.
2 Likes
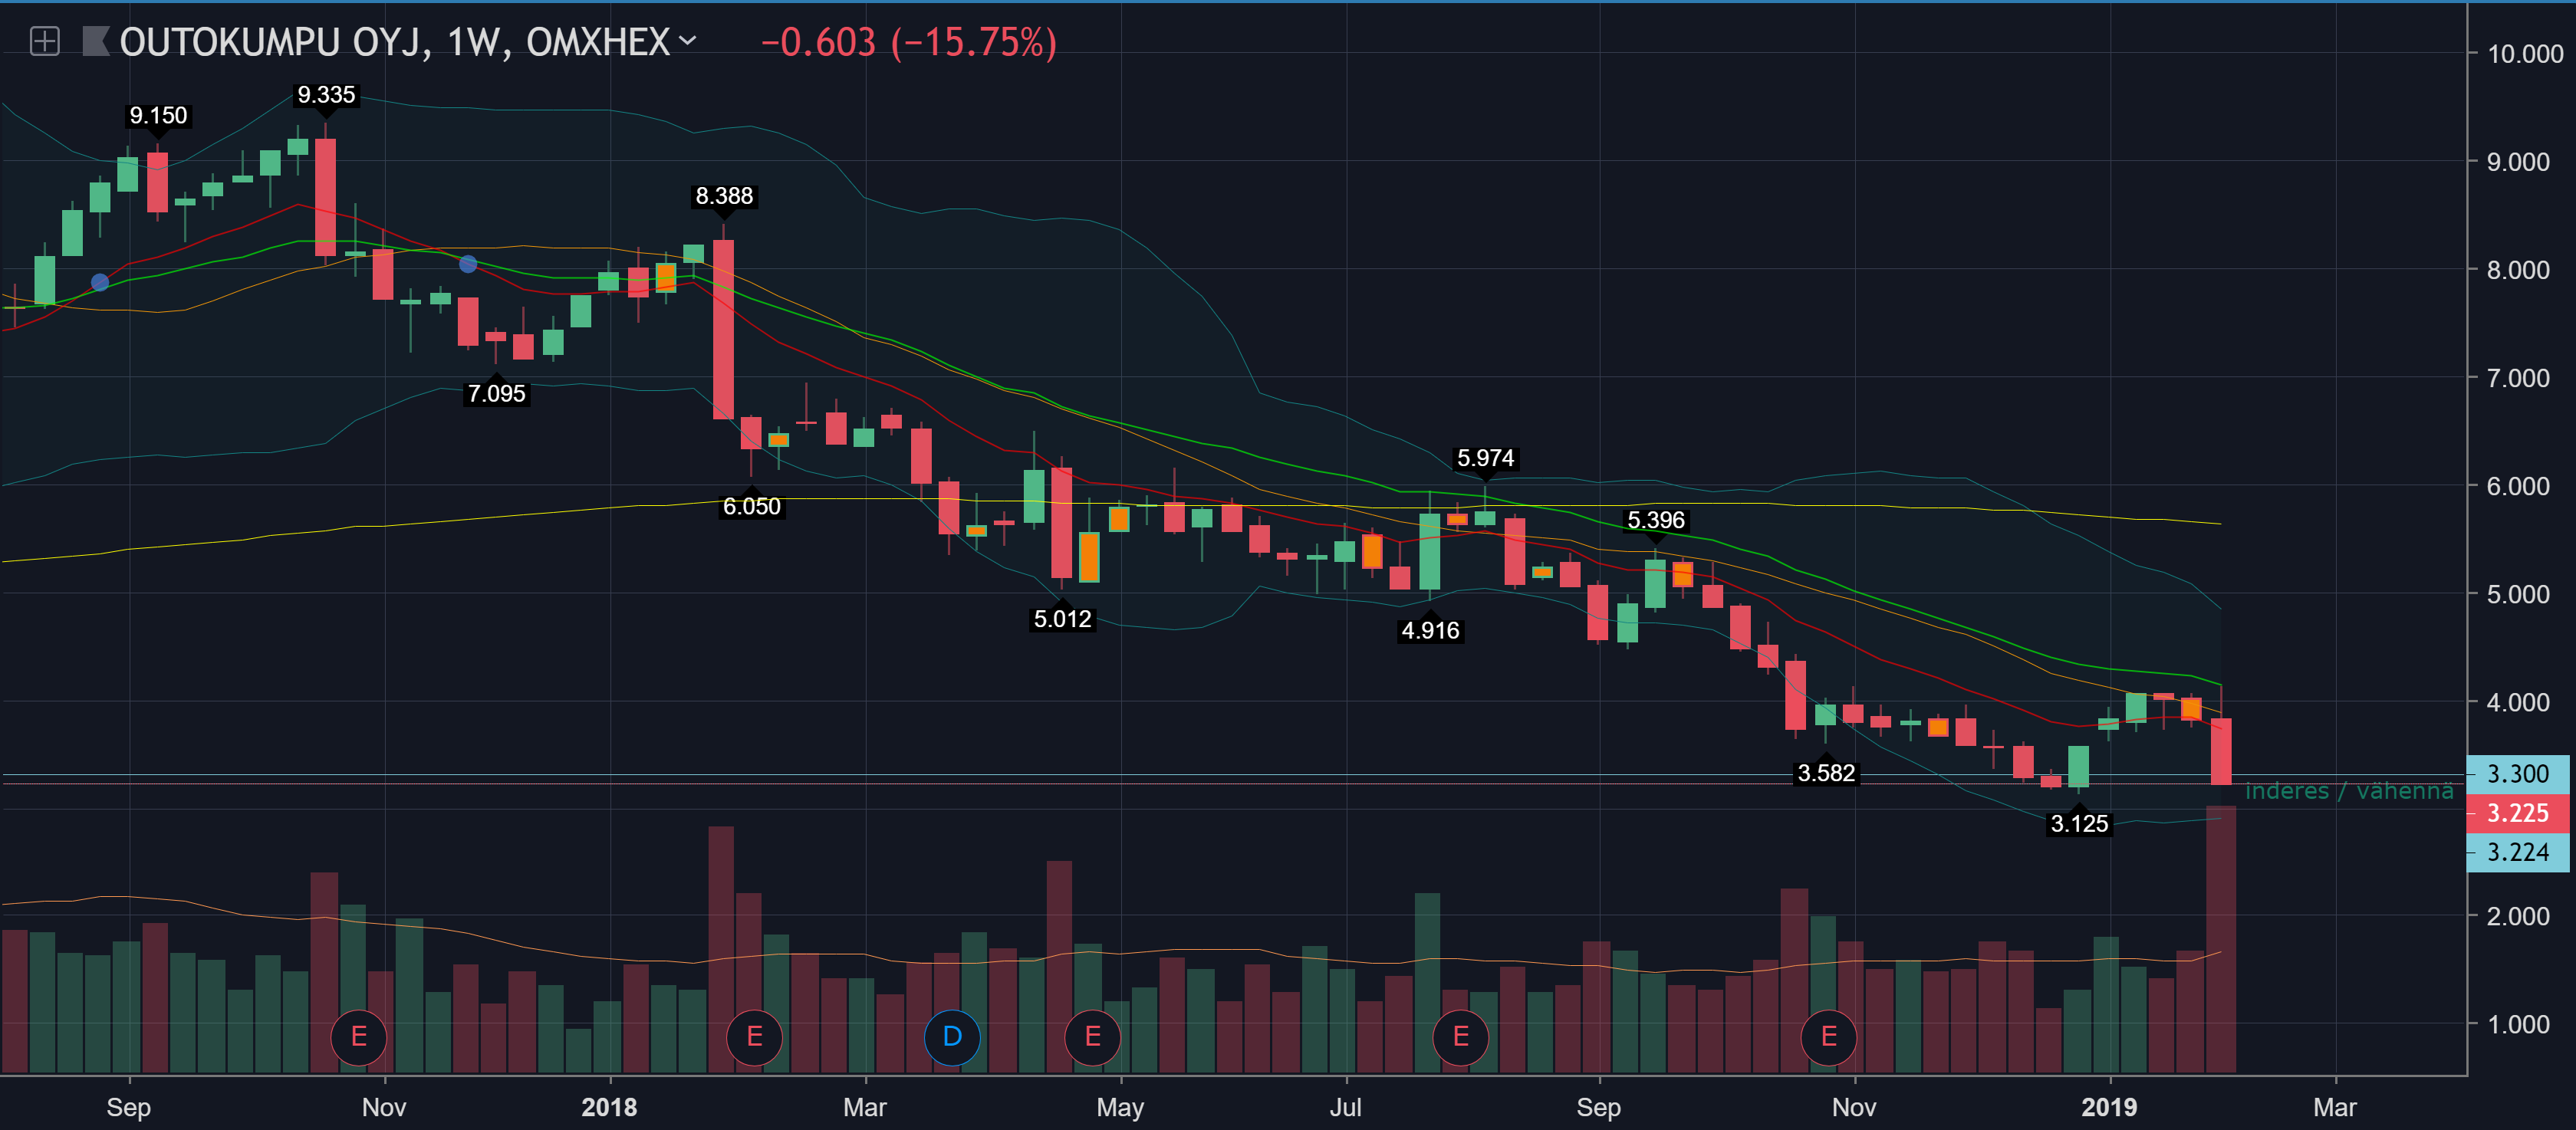
I look at the company on a weekly level to understand the big picture. I would under no circumstances recommend Outokumpu to a beginner investor, because it has been in such a long decline.
- trend is your friend - you should not make investments against the direction of the stock price. This is my main rule for investing
- fund management companies, etc. experts can calculate the share price weekly based on various fundamental factors, but that is a science of its own, which few individual investors are capable of
- market makers determine price levels and small fish follow in their wake
- as long as the weekly trend does not change, I do not recommend picking this type of stock when there are many other stocks whose direction has either started to rise or have been in it for a longer time and have not lost it
- Outokumpu had an attempt at the beginning of this year, but it ended with this financial statement release
- for this reason, for example, I rarely hold stocks over an interim report, because I don’t want to gamble, but make decisions based on factual information after the earnings report
- here are a few tidbits of information for you to consider
7 Likes
Thank you very much ![]() That TradingView definitely looks like good software, I’ll look into it more deeply today
That TradingView definitely looks like good software, I’ll look into it more deeply today ![]()
Unfortunately not. It’s restricted access; we don’t want to grow the membership too much. But these are definitely worth looking for; there are different kinds, and they’re usually not particularly expensive. Then there are separate ones offered by various service companies developed around trading, where a blog/chat group is included in the services. I won’t go into advertising anything specific here. I don’t know if such services exist in Finland; I haven’t heard of any. No one here has realized that one could make a living from that. Finland is quite a small framework for something like this, though. My community has about 1000 members from all over the world. No other Finns have signed up.
I personally follow a lot of different information sources and forums, so a lot of my day is spent reading. Then I follow various indexes, sector-specific ETFs (SPY, QQQ, IWM, VIX, XLK, XLF, XBI, XLI, etc.), commodities (oil, gold, natural gas, dollar), etc. From these, I try to find different correlations to various sectors and their companies. The actual trading is only a small part of this work; preparation is the alpha and omega. A plan must be in place for each day, just like for longer-term investing.
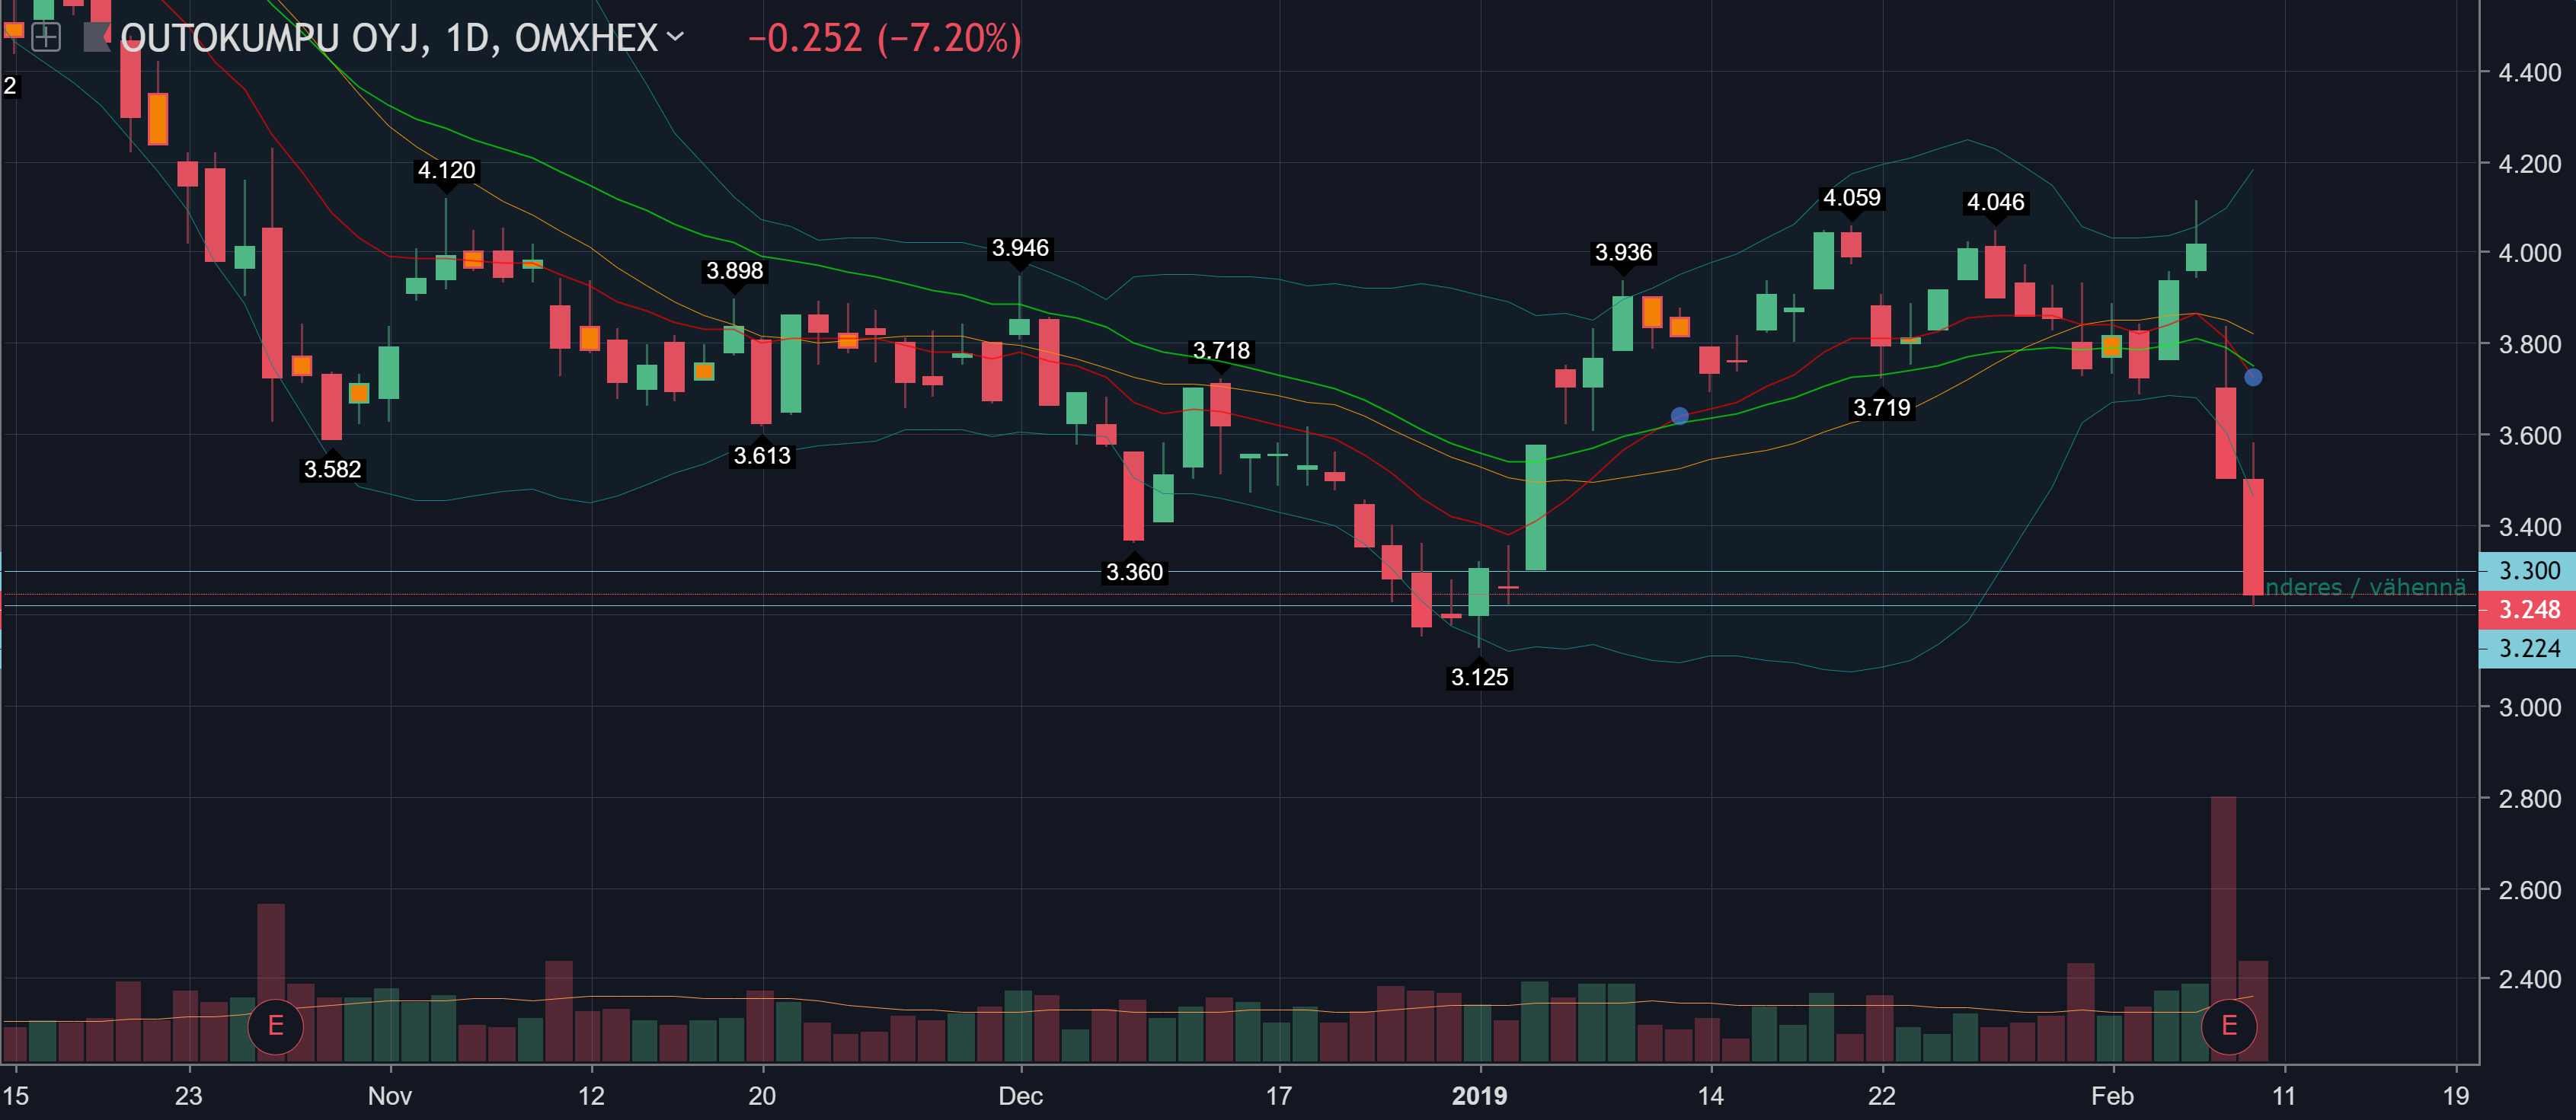
A little more about Outokumpu. The daily RSI (Relative Strength Index - see Investopedia for meaning) value is now 33.86. When a stock is oversold, its value drops to < 30. The last time Outokumpu was oversold based on this was on 30.10.2018, with an RSI of around 16.5
- the price can still drop
- the next nearest support level is so close to 3.125 that its significance is no longer as great
- there is no strong support to be found because in 2016 the price made a year-long continuous rise without a clear Higher Low. From there, the nearest reasonable value to look for is 2.790
Now that we have dropped so much, there are not many good options left, and liquidating the asset cannot be directly recommended, as sales should be made using TA (technical analysis). Your skills are not yet sufficient to assess at what point you could do it and then buy back lower.
Since you are young and at the beginning of your life’s journey, based on your statements, take this as a learning experience. All investors have made mistakes along the way, and many have lost their entire fortunes. In that sense, you are still in a good position. Always learn to make a plan, and once a purchase decision has been made according to it, immediately create a Stop Limit Order and a Sales Limit Order. Then both are ready in the system, and nothing can happen outside your control. You can then move those values in such a way that the Stop-Loss can be moved upwards (reducing the loss limit) as the asset’s value rises. At some point, mine are already at a point where triggering them will generate profit. Of course, the sell order can also be moved up or down if the view changes. Some systems allow both a Stop-Loss and a sell order to exist, others do not. Find out about this in advance. If only one is possible, then you only create a Stop-Loss.
2 Likes
You can buy real-time price data for TradingView. OMX costs 3 USD/month, so it’s not expensive.
- each market data must be purchased separately, e.g. Nasdaq is $3/month, NYSE $2
- some are free and some may therefore have a 15-minute delay
- TV also has a free/trial version, so you can explore it without cost
- there are others like it (e.g. StockCharts), I myself have grown fond of TV
- in free versions, e.g. Yahoo has so many fewer features that I myself wouldn’t get by with them
There is no direct trading platform for OMX yet, so it still has to be done elsewhere. They are constantly developing the software in such a way that trading could also be done from there.
2 Likes
Thank you very much for this information, @DayTraderXL! I just installed TradingView on my home/work PC. I agree with all your observations, a plan is always essential. As soon as I get fully in charge of the company, I will immediately start using Stop-Loss. I need to study a bit to understand what a good general Risk-Reward ratio would be. Outokumpu’s TA (Technical Analysis) is quite a difficult nut to crack at the moment; I’ll probably start by making buys and sells with other stocks before dealing with Outokumpu in any significant way. The RSI (Relative Strength Index) is indeed a good indicator, at least when combined correctly with support and resistance levels.
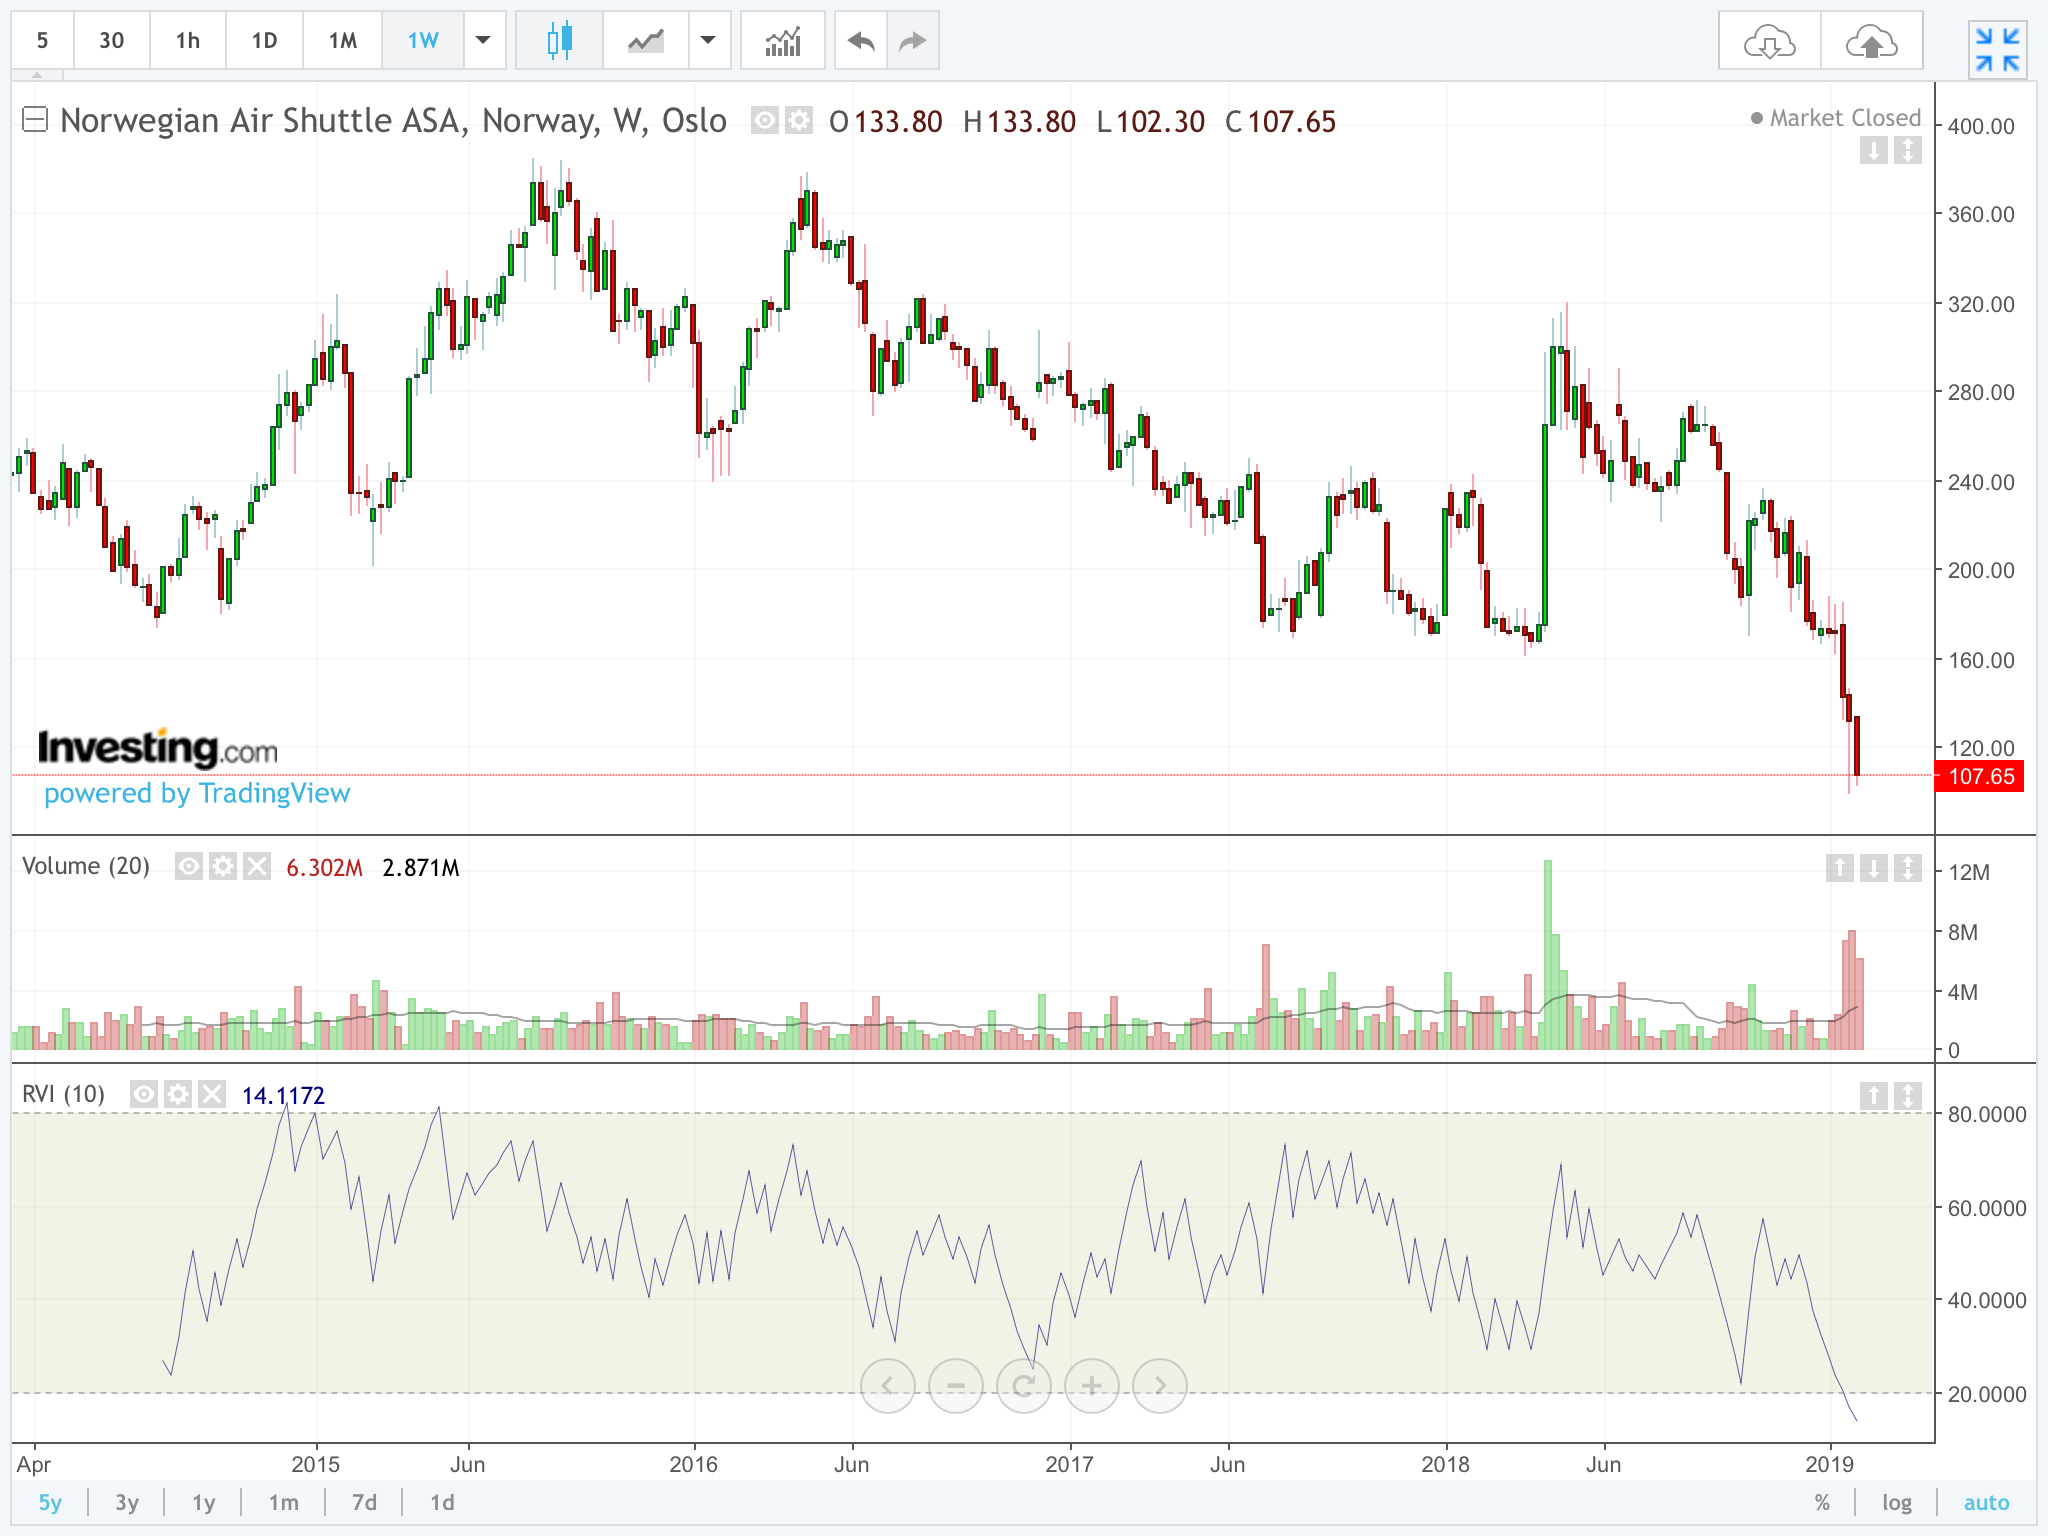
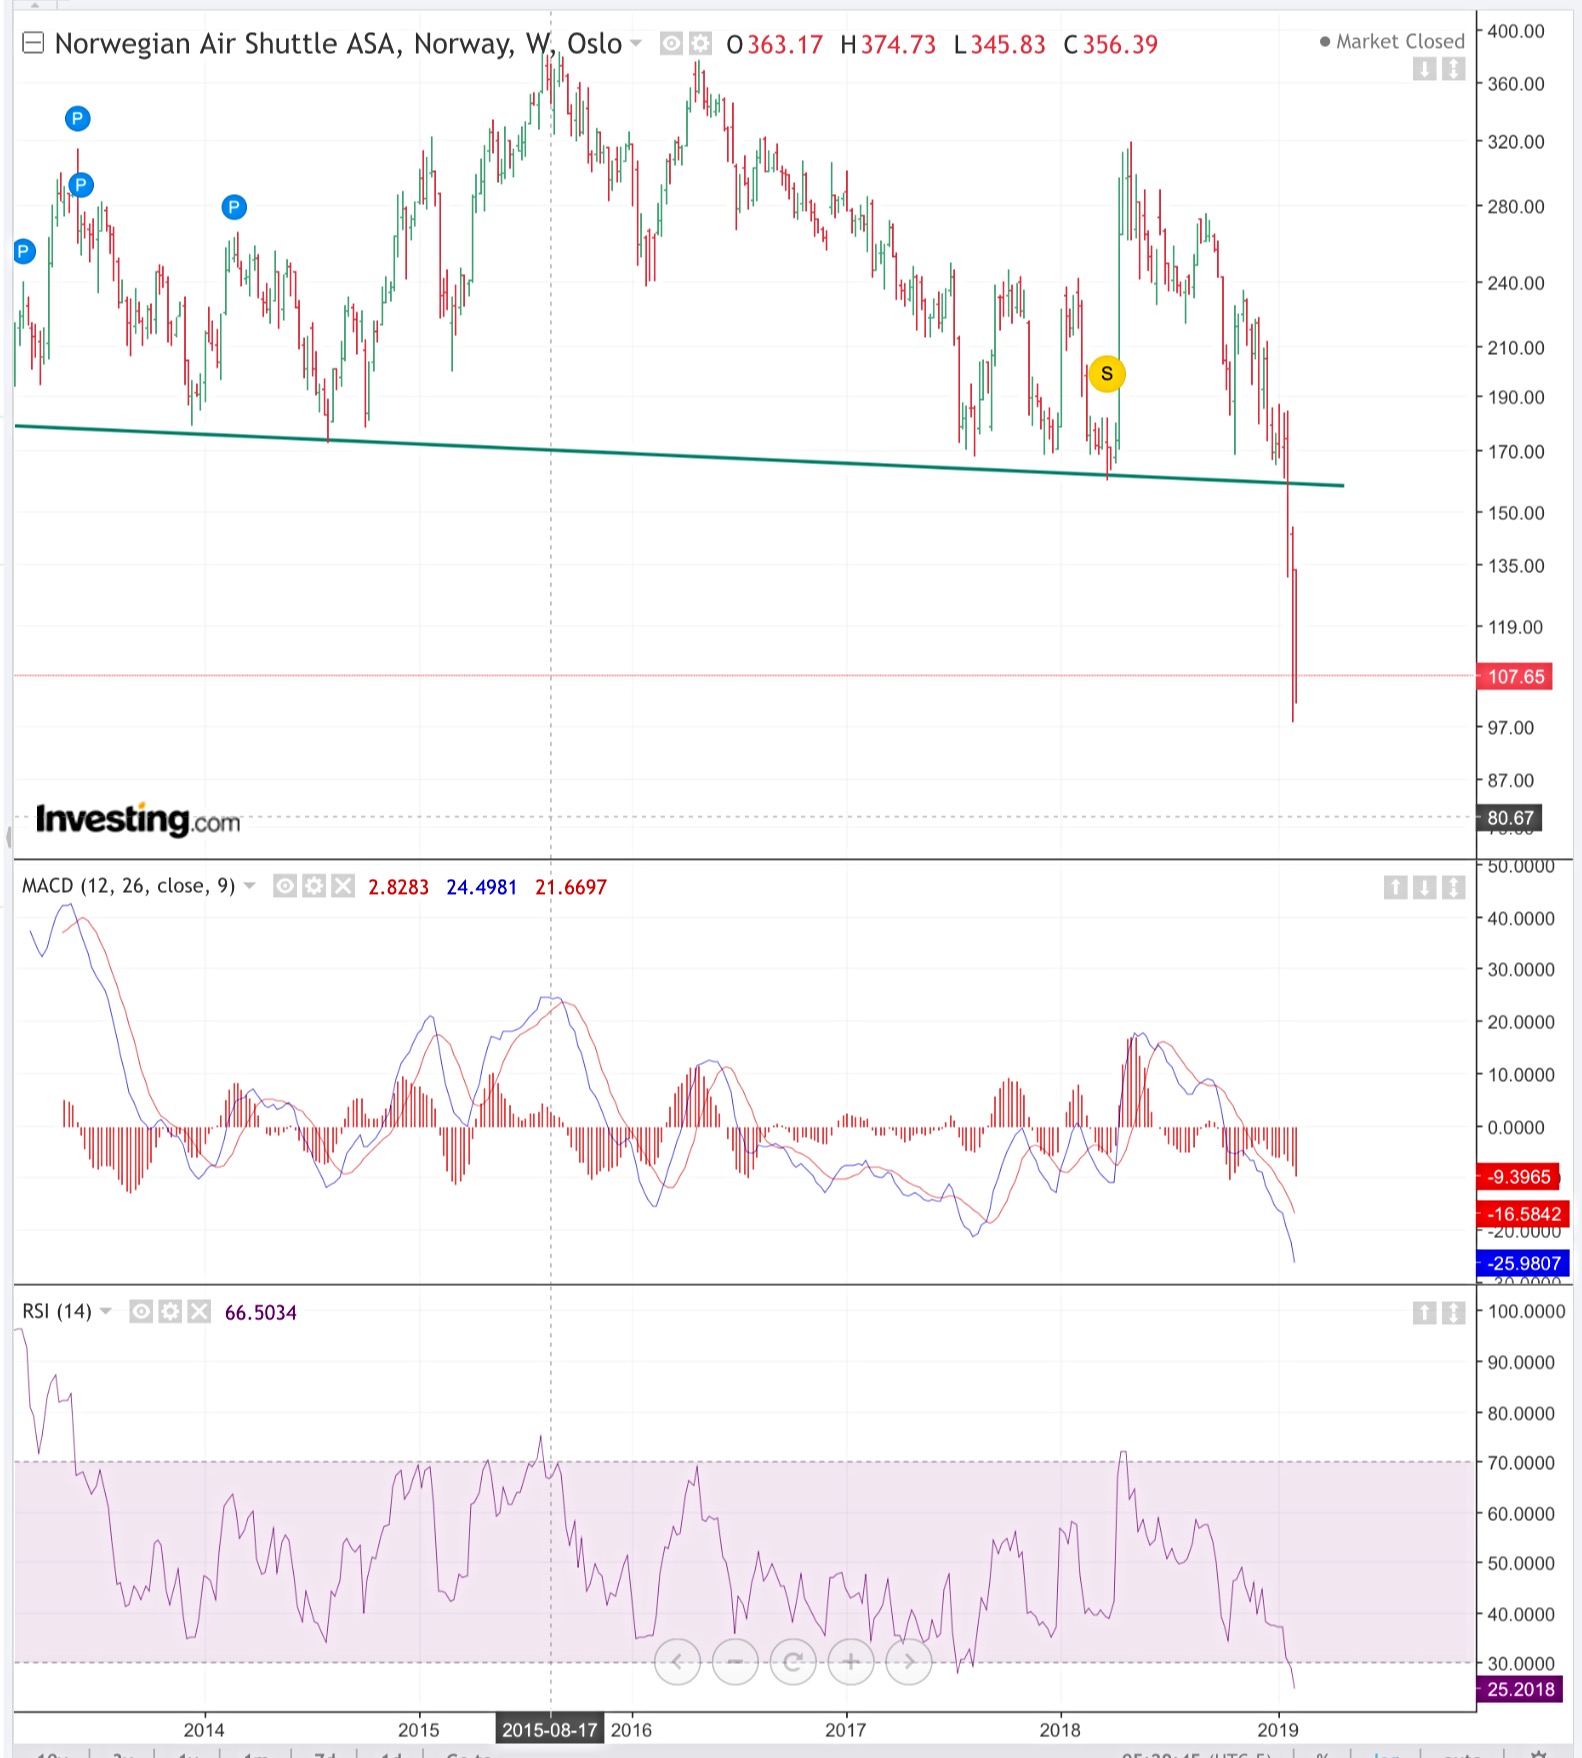
Didn’t Norwegian organize a share issue? I don’t know if that has any effect on such analyses, but I wouldn’t touch Norwegian with a ten-foot pole right now.
4 Likes
These are what make many people make purchasing decisions when the price seems cheap. For me, these are targets I won’t touch in this form. After getting my hands burned a few times, as Sissi commented, one learns to approach these with great caution.
The only thing supporting a purchase from my perspective is that the RSI is at a record low on both weekly and monthly levels. But when a company is in trouble, these values can go to extreme levels and stay there for a long time. So, I actually see it the other way around: technically, it is by no means a good buying target. The time for shorting has also passed, because surely the price will turn momentarily sooner or later, and even shorting is already a gamble with bad odds.
One could certainly try to chase such a short-term bounce (I assumed you would have been buying long), but even then, one has to be careful and know what one is doing. I would almost wait for the price to make a lower high on the 1-hour level and then look for a higher low, and if the volume suggests that the next bounce is coming, then go for a short from there, with a tight stop-loss below that HL. What kind of liquidity does the target have during the day?
For a longer-term purchase, one would really need to investigate the company’s situation very carefully, whether there is a threat of bankruptcy or what. It looks a bit like cash reserves are running low. I have no idea about the company’s fundamentals, I haven’t followed it, but I remember from the news that some deal was canceled, and apparently, Norwegian’s years of continuous losses have not stopped. I could imagine that the surge was caused by that acquisition rumor/offer, and then the cancellation caused the dive. Hasn’t Norwegian been making continuous losses, or what?
The previous support was found sometime in May 2012, at 88.45, so that is also so far back in time that I no longer assign much value to those support levels. For this target, one would need to see a clear weekly change (LH/HL and “follow through”), which will certainly take a few months from now.
What would be your plan for buying this, or were you just looking for a short-term future bounce as an intraday flip?
1 Like
I noticed that many Norwegian flights are on sale for really cheap, so I decided to check the stock price, and it looks like cash flow is desperately needed.
I think I’ll skip this company’s flight offers and a short long.
1 Like
This caught my eye - I haven’t been following these recent developments myself, even though I use the company a lot for flights. A credit card purchase probably provides a lot of security, even if there’s a threat of operations stopping in the near future. The 300 million euros raised from the offering should be enough for a while, let’s hope.
1 Like
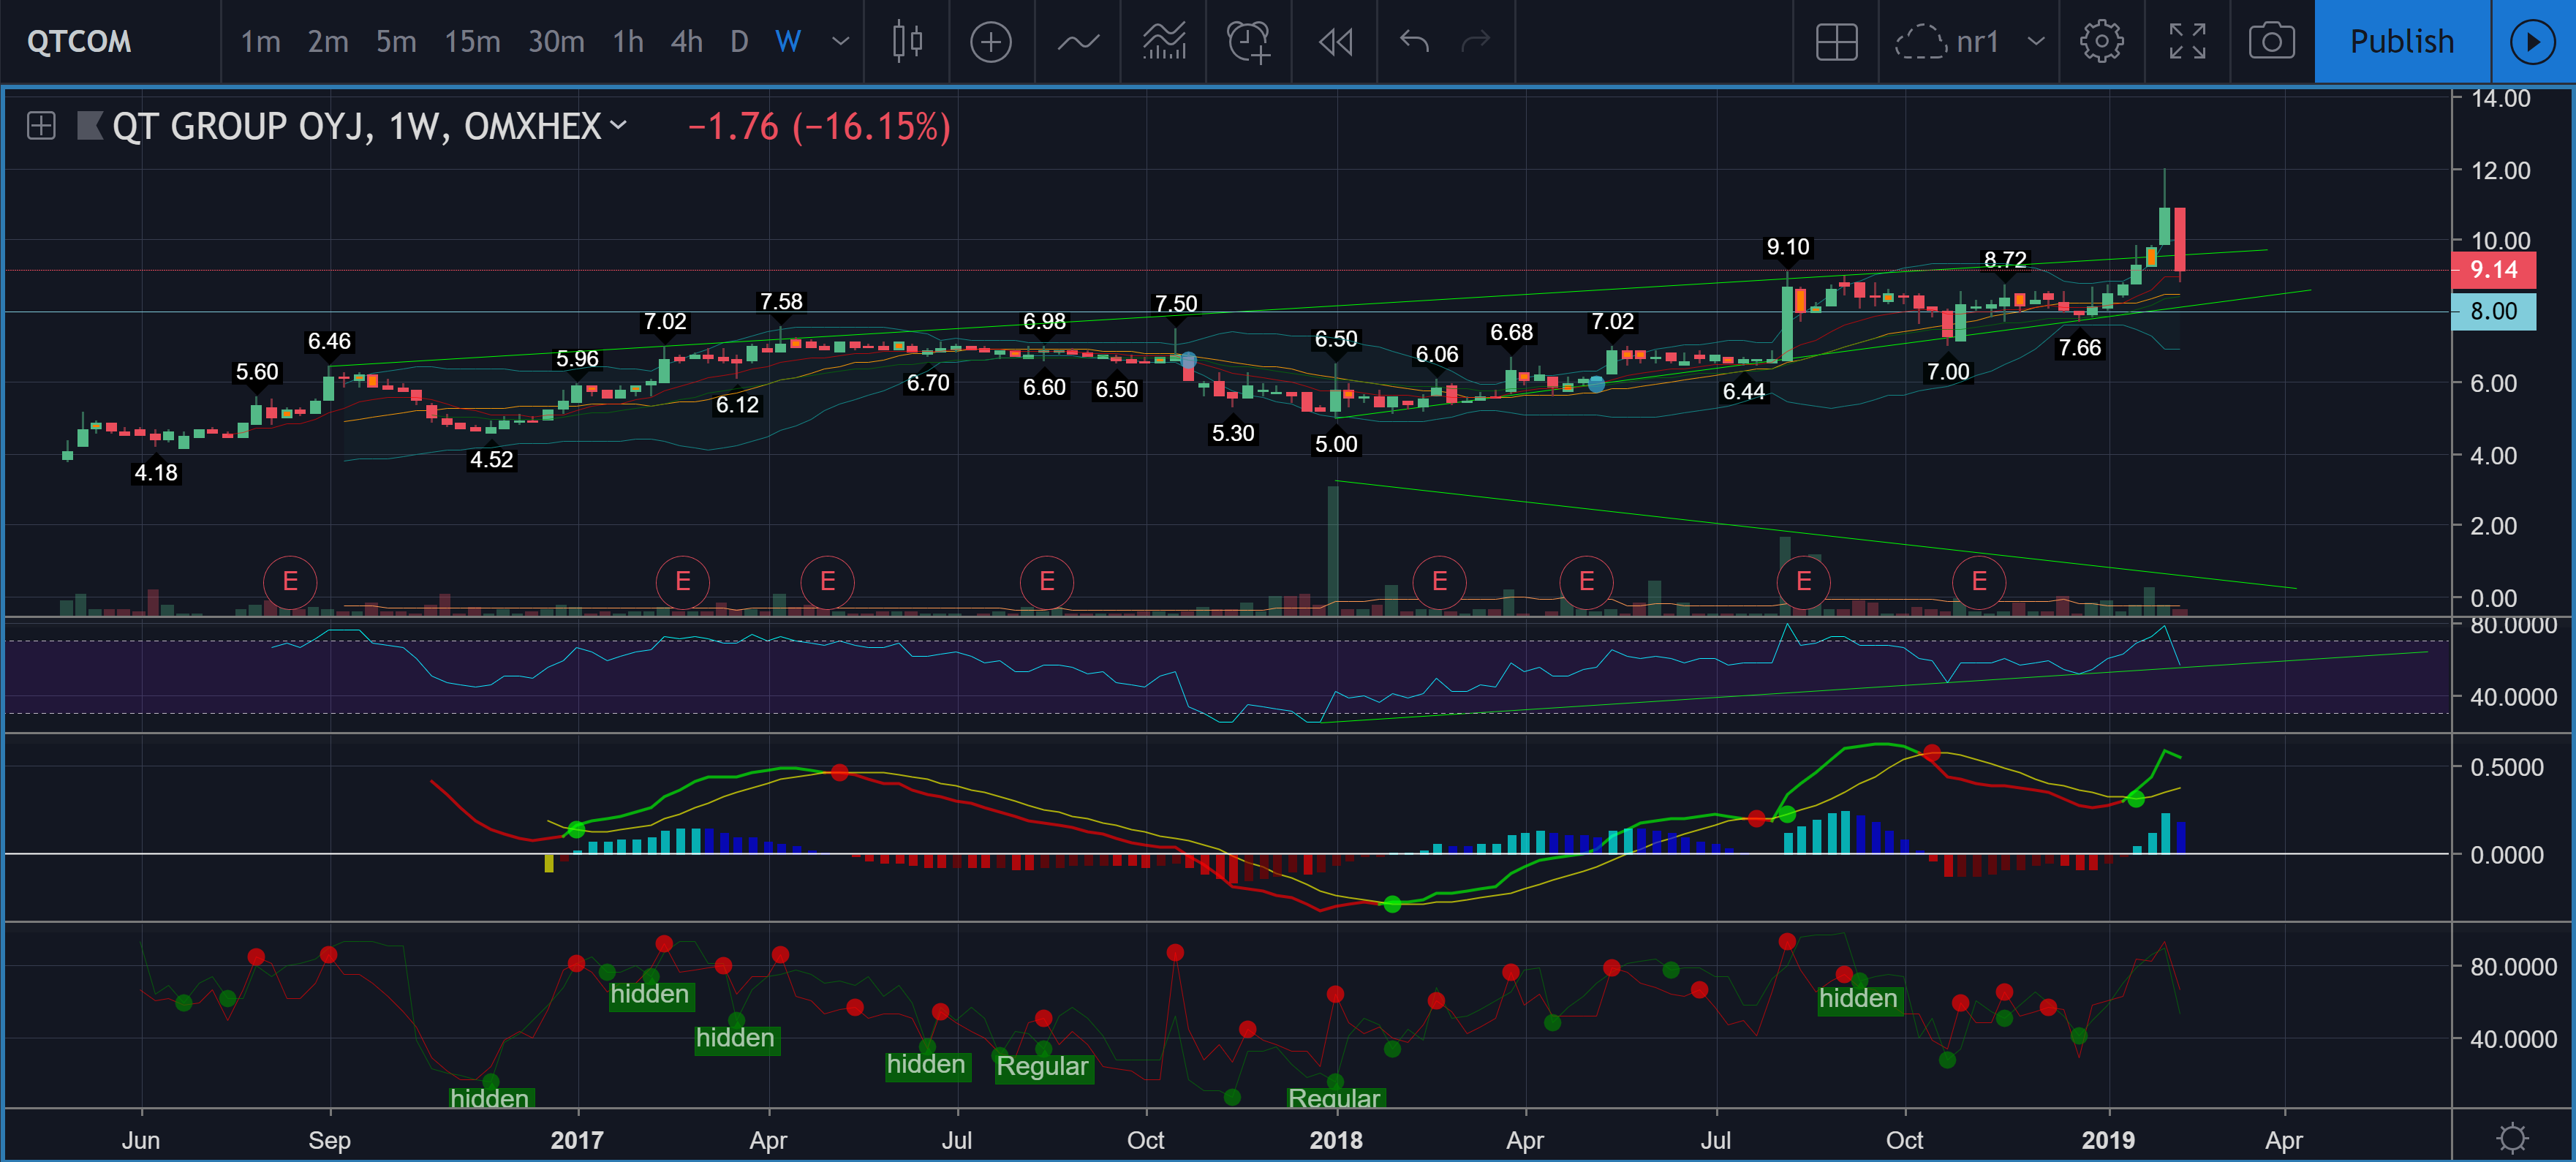
I’ve been following - from the sidelines for now - QT Group because I also have a long software development background. Somehow, I’m not entirely convinced yet about the management’s ability to truly take this globally. When the players are large, multinational giant corporations, unfortunately, a small company’s innovations are not bought very easily. There are many reasons for this, and I personally think that QT’s ownership hope lies in someone buying the company out.
Technically, an ascending wedge is visible, larger volume spikes are decreasing, we are at the RSI support level, MACD is waiting for a cool down, and poor outlook in the earnings report is a bad combination. The price level of 8e seems strong for now. It’s difficult to see what would make this stock rise during the first half of the year.
5 Likes
@Nyyb.K

I looked at Finnair following the earnings report, and the EQ (equity) seemed to have held up well, as I previously commented to you.
- there was a minor breakdown at the lower level around the turn of the year, but not significantly
- now the EQ clearly broke upwards with the good earnings report, and it is supported by the exponential moving averages 12 and 26, as well as the Middle Bollinger Band (MA 20). The upper limit of the BB also broke
- Nordea’s target price seemed to be closer to the mark this time compared to Inderes
A good performance from Finnair among airlines.
3 Likes
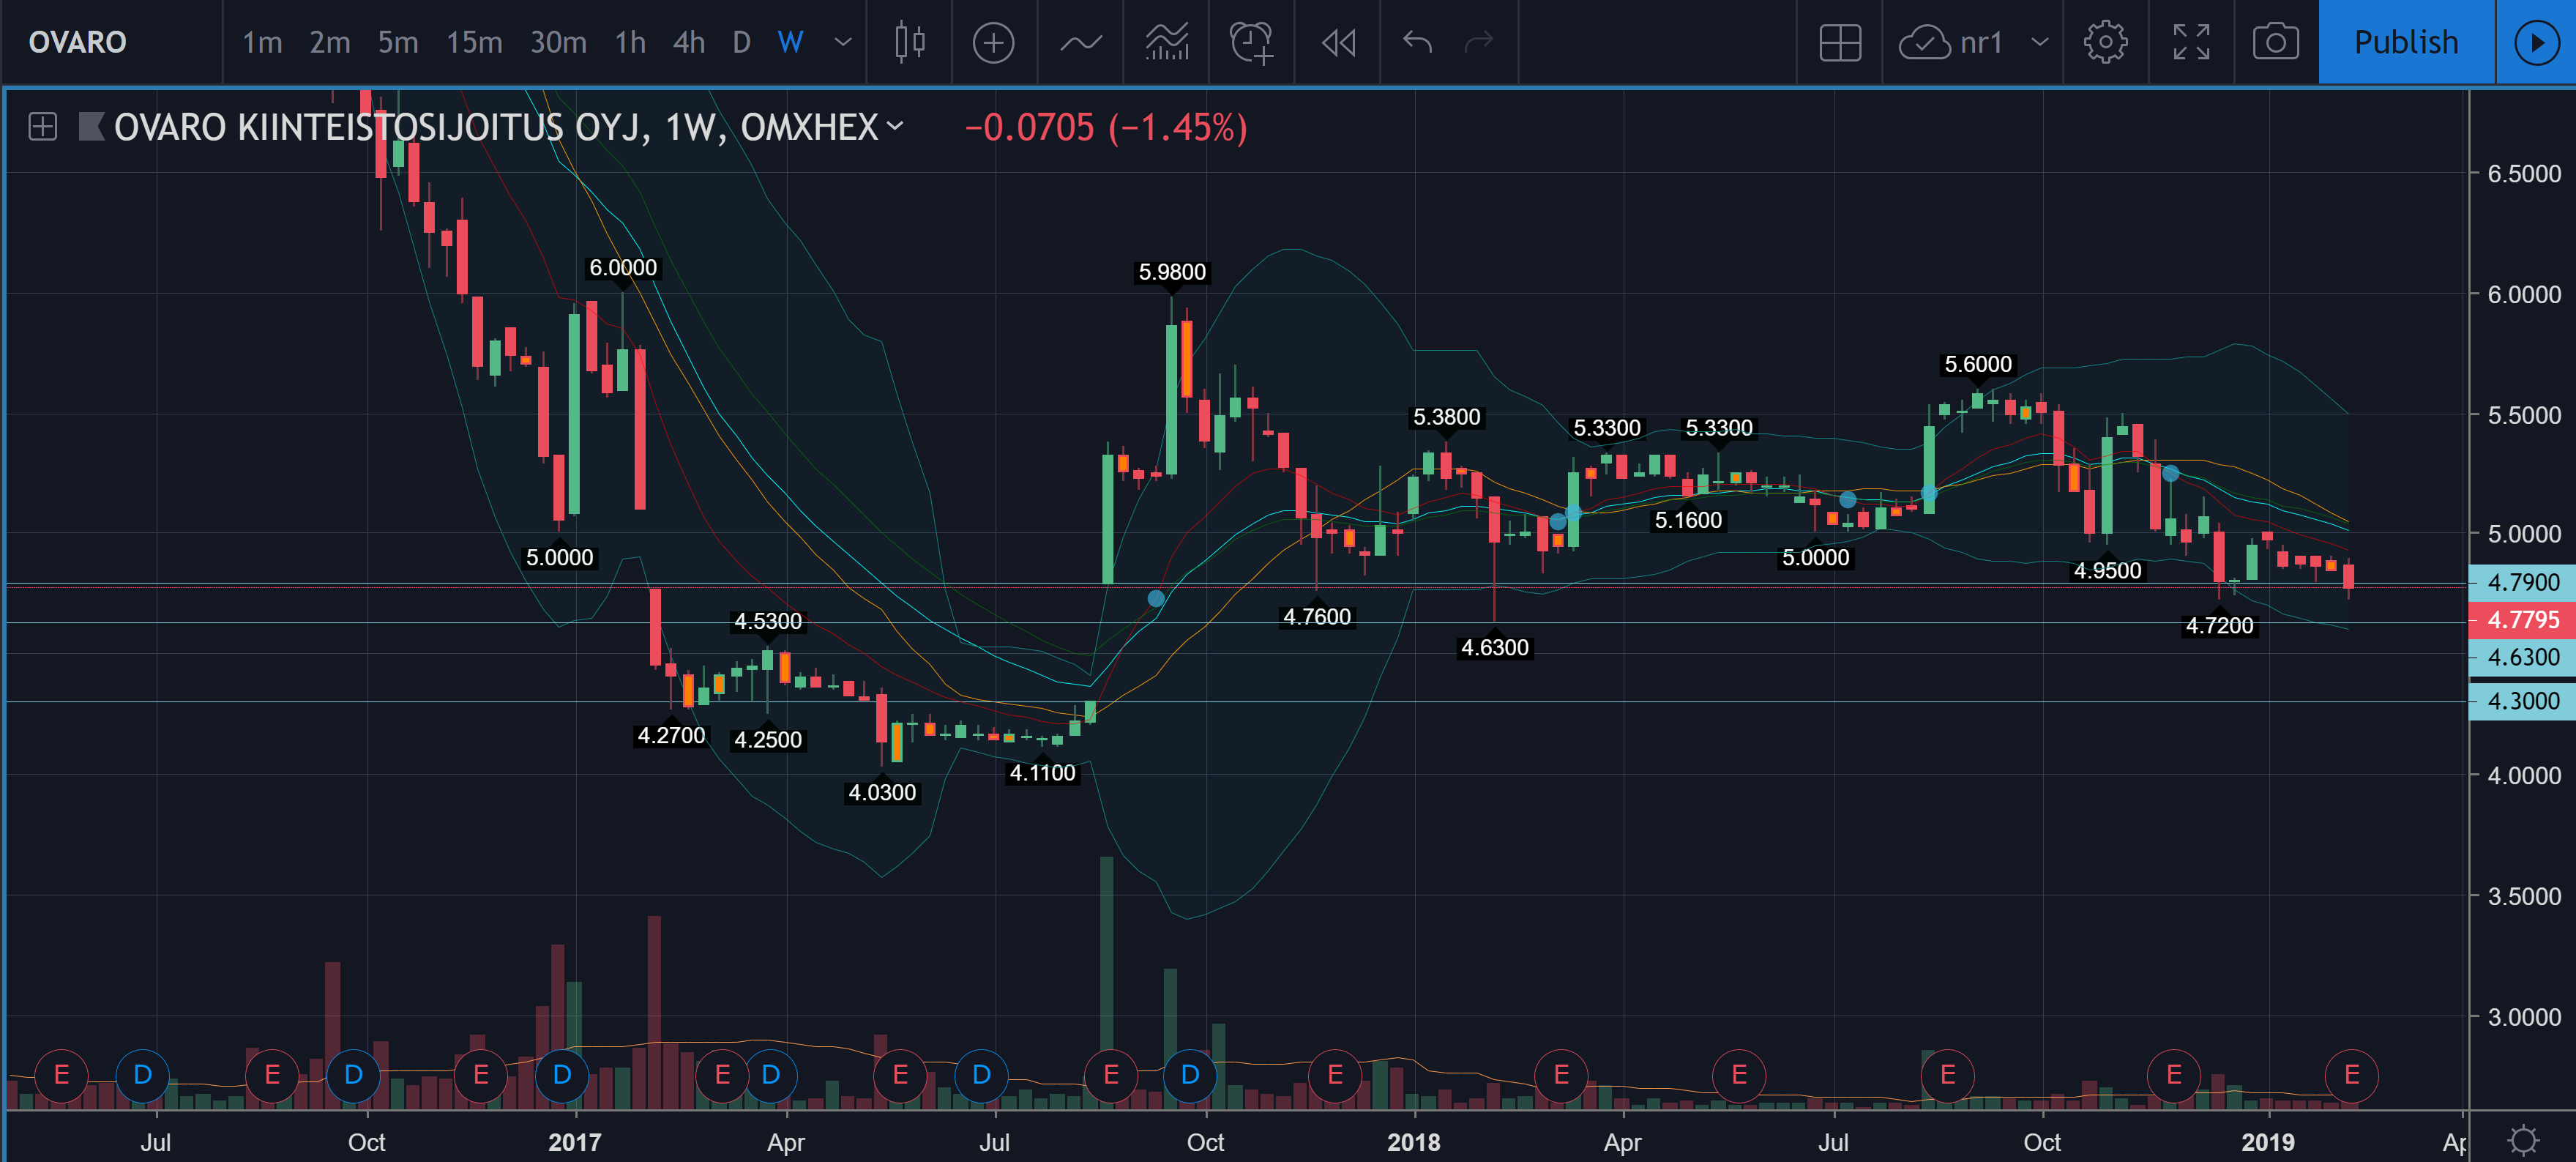
Very often, the market tends to do a so-called gap fill. What will happen with Ovaro (4.3-4.79), I wonder?
2 Likes