Minä luulen että kun öljyn hinta lähtee laskuun niin inflaatiopelot hellittää, korkotaso laskee, talous saa vauhtia ja raha siirtyy valtionlainoista osakemarkkinoille.
2 tykkäystä
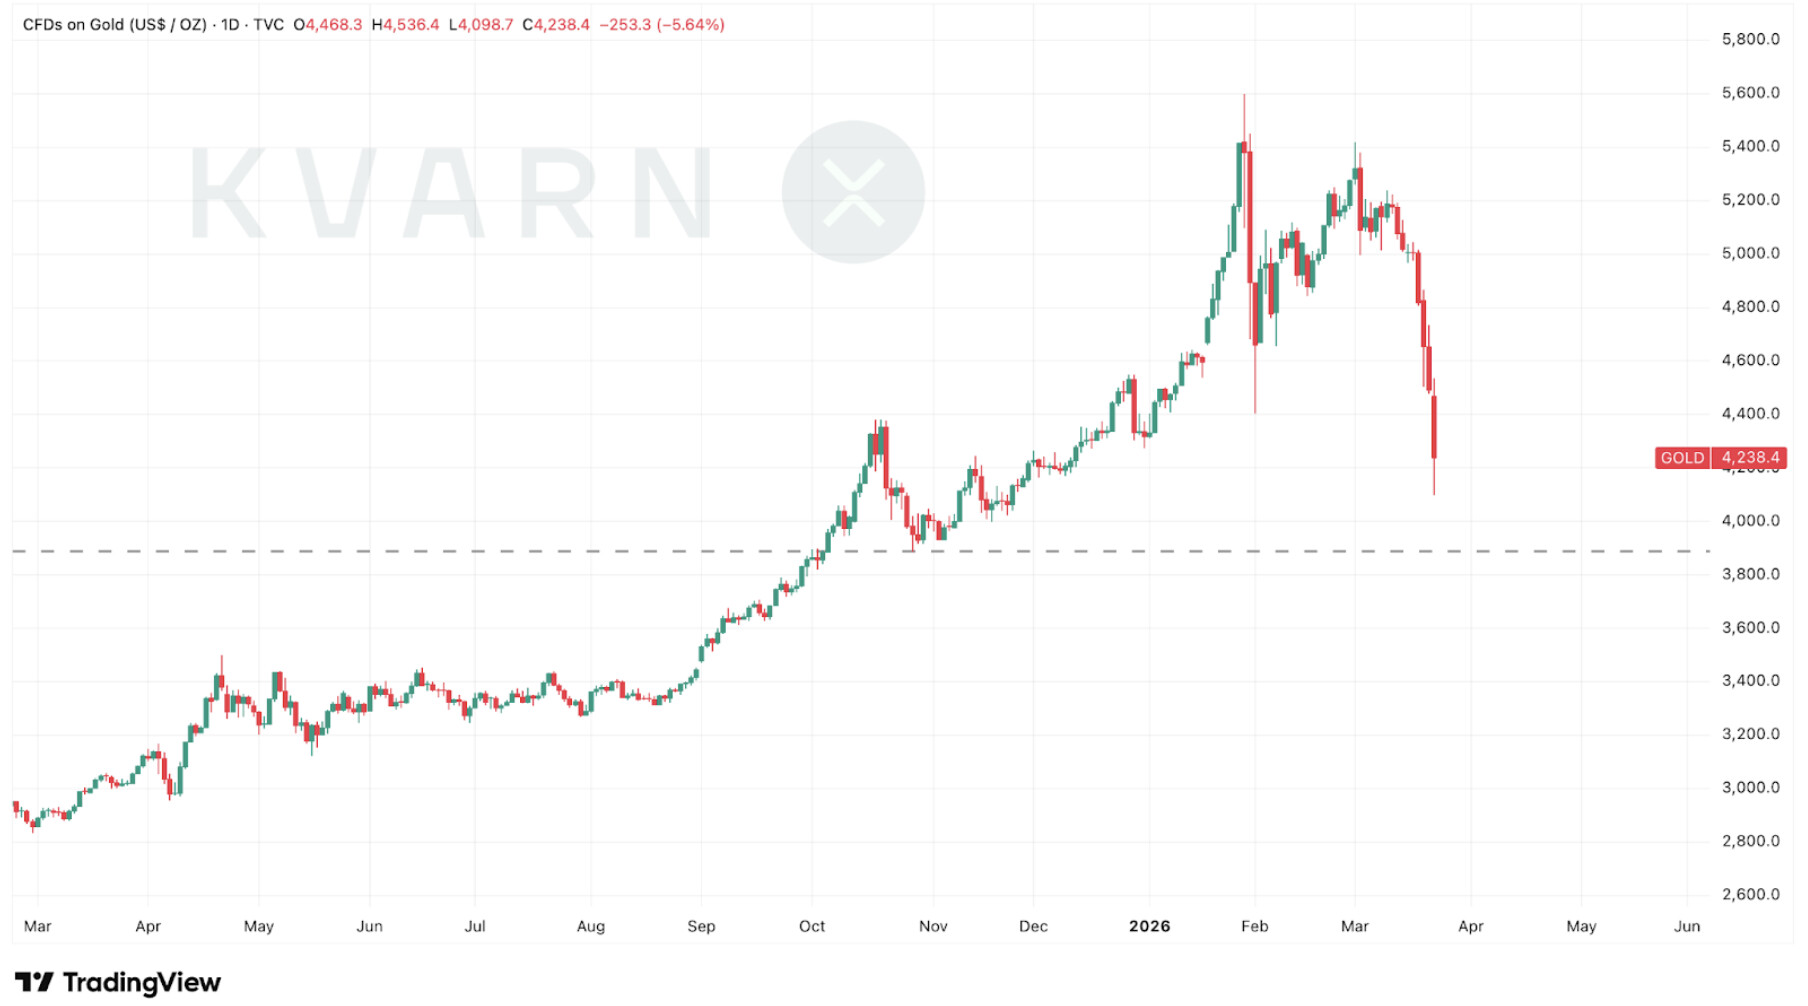
Kullan hinta on parhaillaan mielenkiintoisessa tilanteessa.
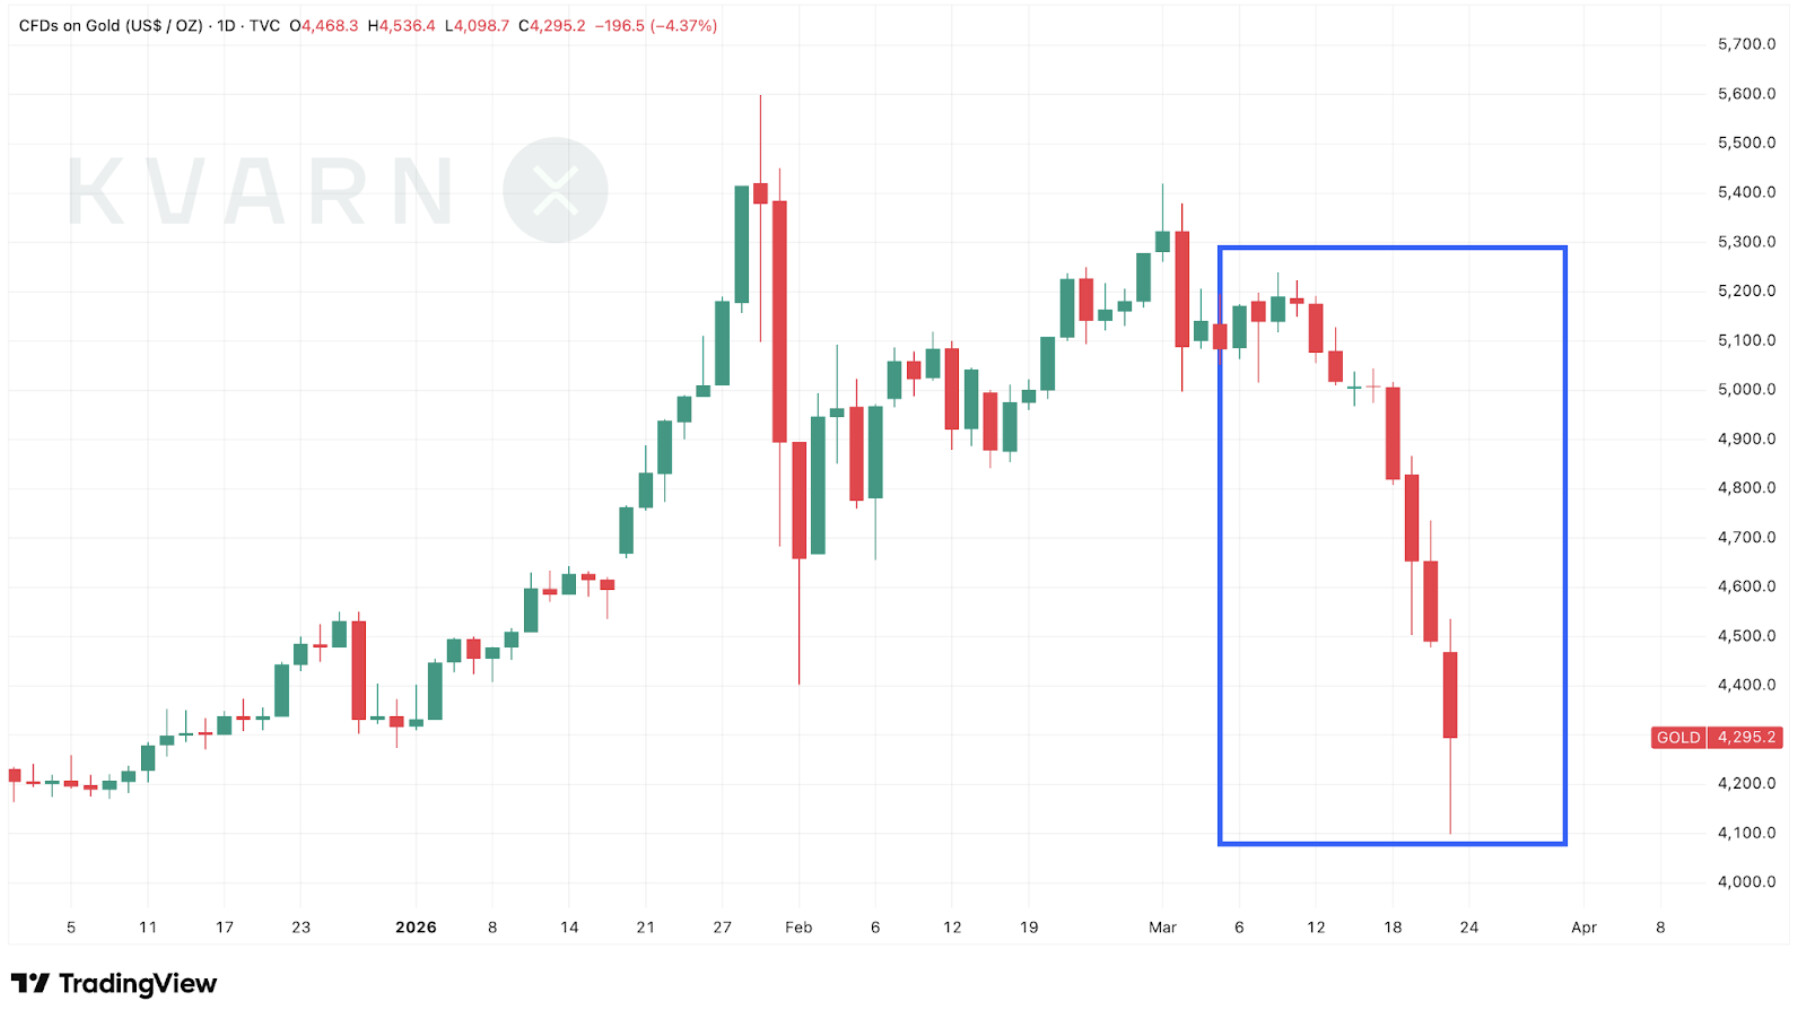
Kullan hinta on viime päivinä laskenut rajusti, sijoittajien vähentäessä riskitasojaan ja vapauttaessa pääomia. Reilussa viikossa pudotusta on tullut noin kaksikymmentä prosenttia.
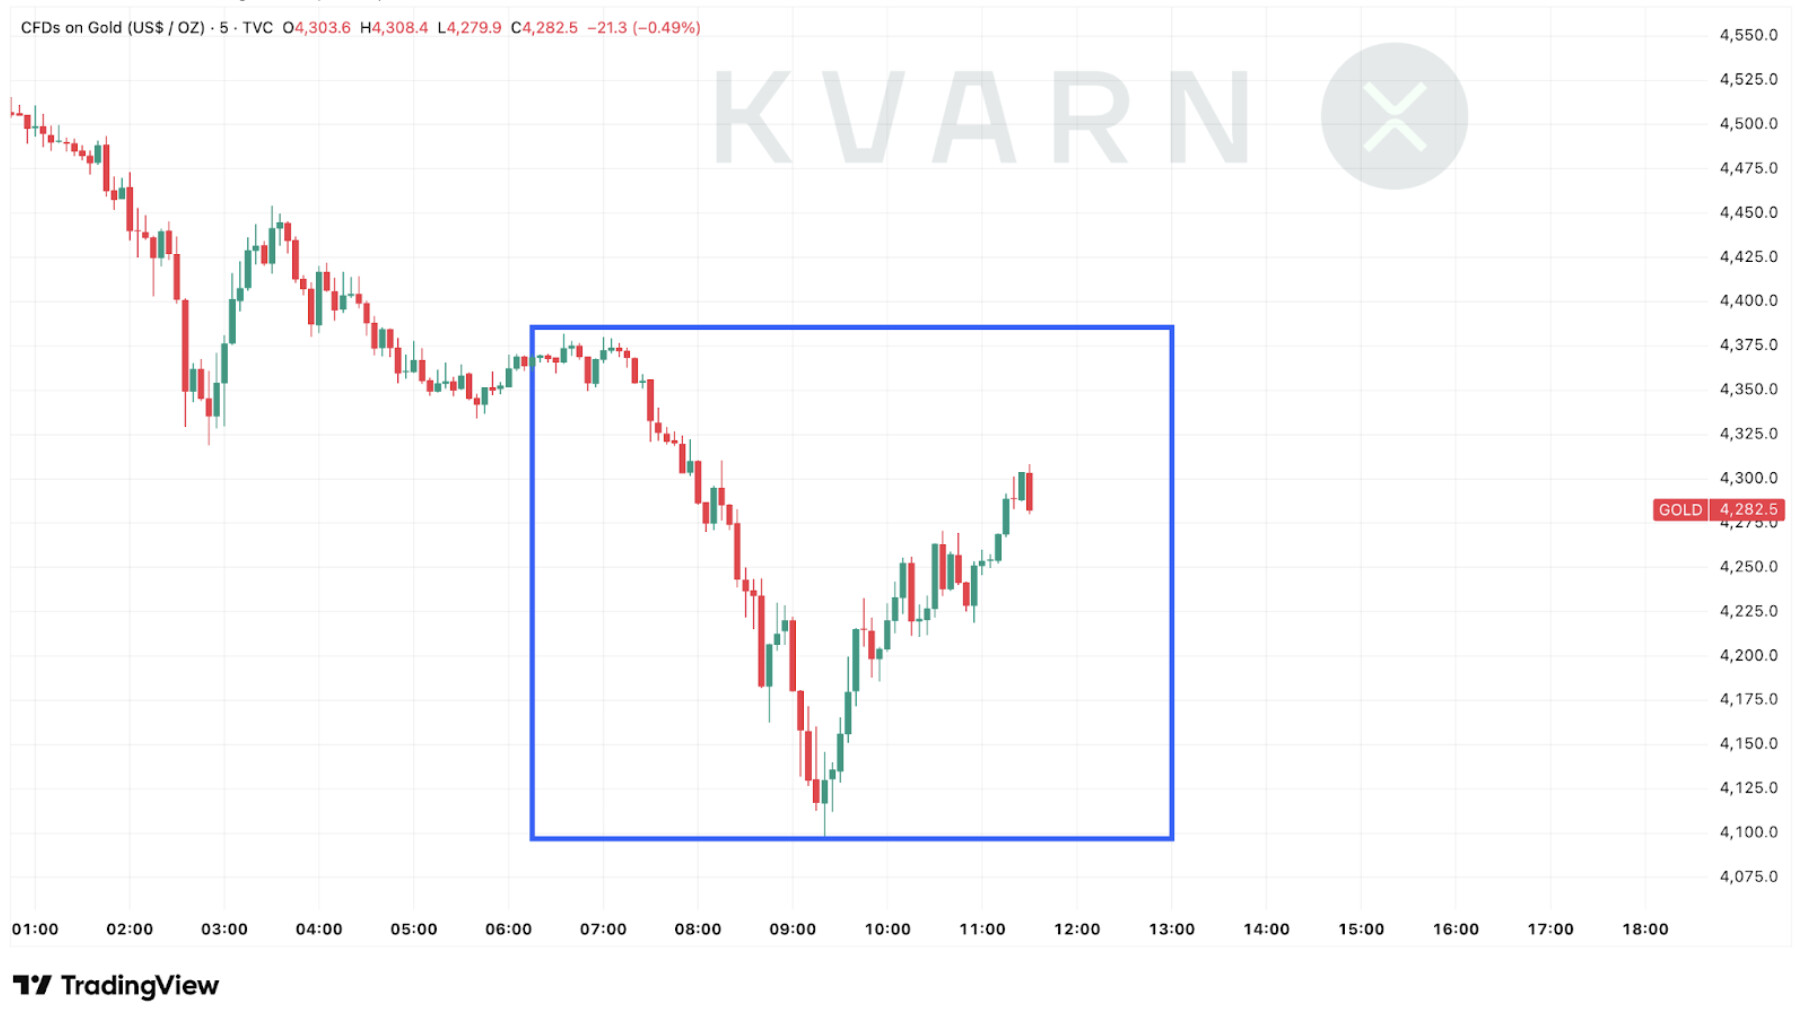
Maanantain aikana kullan unssihinta on laskenut alimmillaan noin 4 100 dollariin, josta se on lähtenyt terävästi kipuamaan ylöspäin.
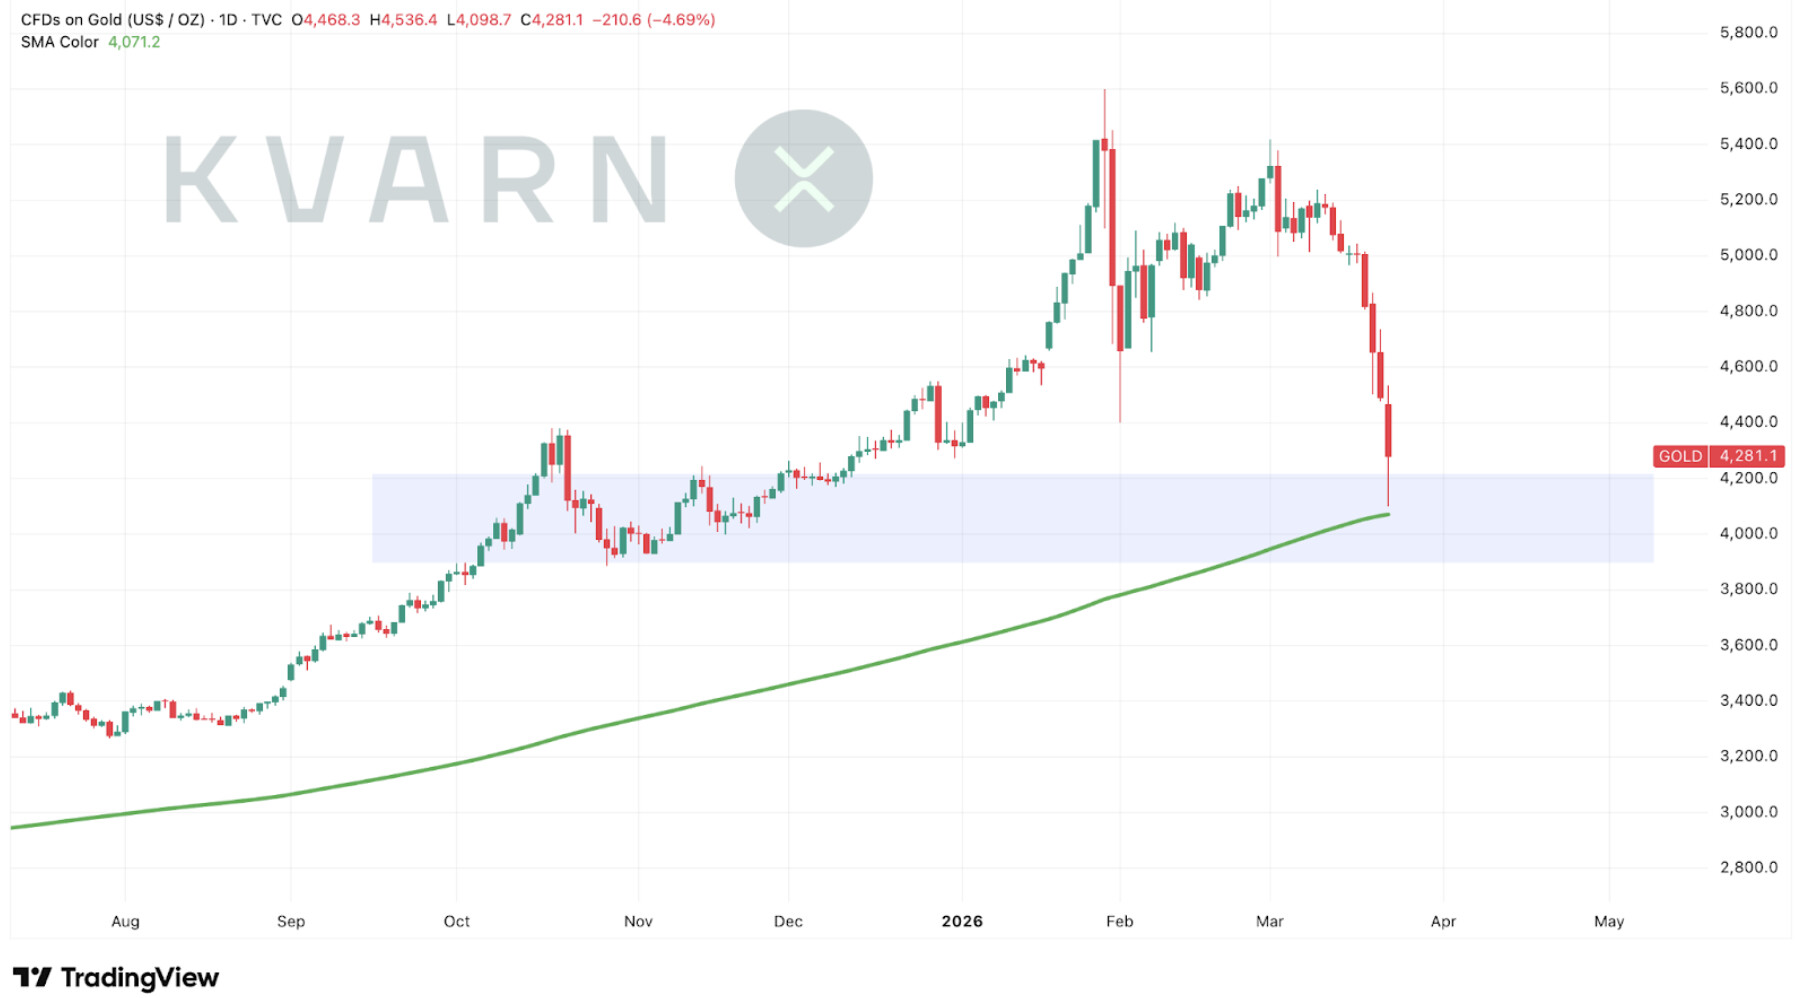
Alimmillaan kullan kurssi kävi lähes koskettamassa 200 päivän liukuvaa keskiarvoa, laskematta kuitenkaan sen alapuolelle.
Mikäli uskoo kullan hinnan pitkän aikavälin nousutrendin jatkuvan, on tällainen vetäytyminen 200 päivän liukuvan keskiarvon tuntumaan usein mitä parhain ostopaikka.
Toisaalta kurssin laskeminen alle 3 900 dollarin viittaisi pitkän aikavälin nousutrendin katkeamiseen, tarjoten täten luonnollisen stop-loss-rajan. Matkaa tähän rajaan on tällä hetkellä alle 9 prosenttia.
Mukavaa maanantaita!
9 tykkäystä
Tässä on Jussi Halmeen video kullasta. 
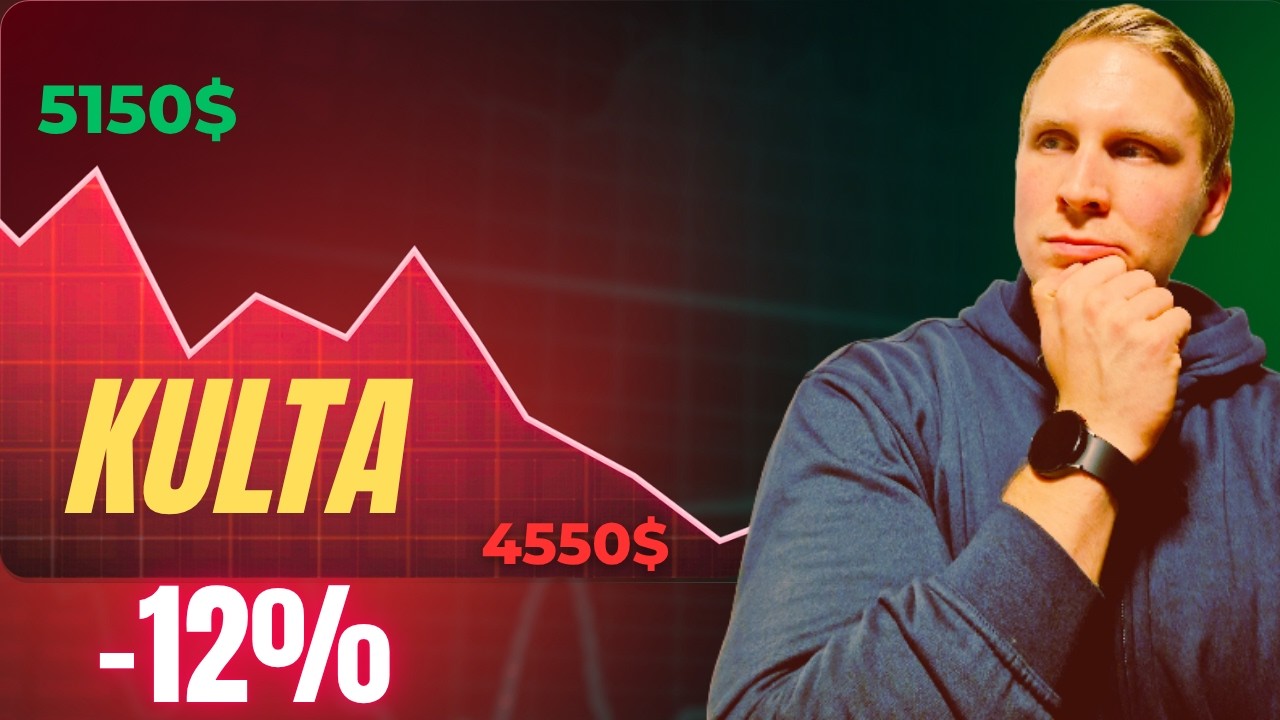
Miksi kullan hinta laskee, vaikka maailmantilanne on räjähdysherkkä?
Perinteinen sijoituslogiikka sanoo, että sodat ja inflaatio nostavat kultaa, mutta markkinat tarjoilevat nyt jotain aivan muuta. Tällä videolla puretaan kullan hinnan ympärillä vallitsevan paradoksin: miksi öljyn kallistuminen ja korkeat korot ovat myrkkyä “keltaiselle metallille”, ja miksi dollari on edelleen kriisin ykkösvaihtoehto.
Tässä jaksossa käymme läpi:
Korkojen ja kullan suhde: Miksi 5 % riskitön tuotto voittaa kultakimpaleen?
Reaalikorko-paradoksi: Miten inflaatio voikin kääntyä kultaa vastaan.
Likviditeetti ja “Crowded Trade”: Myydäänkö kultaa vain siksi, että se on helppoa?
Keskuspankkien rooli: Muuttuvatko ostajat myyjiksi energiakriisin keskellä?
Sijoitusstrategia: Onko kulta vakuutus vai sijoitus?
Kulta ei ole pelkkää metallia – se on peili, joka heijastaa luottamusta rahajärjestelmäämme. Jos haluat ymmärtää, mihin markkina on menossa, sinun on ymmärrettävä makrotaloutta kullan takana.
3 tykkäystä
Tässä on SalkunRakentajan juttu kullasta ja mm. keskuspankkien kultahankinnoista.
Keskuspankkien ostokäyttäytyminen luo kullalle rakenteellisen kysyntäpohjan, joka eroaa perustavanlaatuisesti perinteisistä hintaa ohjaavista tekijöistä kuten inflaatio-odotuksista tai reaalikoroista.
Kun lähes puolet maailman keskuspankeista aikoo kasvattaa kultavarantojaan, hinnan alapuolelle muodostuu eräänlainen institutionaalinen lattia.
Tämä ei tietenkään tarkoita, etteikö kullan hinta voisi laskea. Maaliskuun korjausliike osoitti, että lyhyen aikavälin heilahtelut voivat olla merkittäviä.
Pitkän aikavälin kysyntärakenne on kuitenkin muuttunut tavalla, joka suosii kultaa suhteessa aiempiin vuosikymmeniin.
Alaotsikot:
- Keskuspankit ostavat ennätystahtia
- Brasilia tuplasi kultaomistuksensa
- Mikä muuttuu sijoittajan näkökulmasta?
6 tykkäystä
Keskuspankit pysyivät ostopuolella myös helmikuulla 2026 eli Puolan keskuspankki oli suurin lisääjä muutama päivä sitten julkaistun World Gold Councilin raportin mukaan. Rajanaapuri Tsekki seuraa Puolan esimerkkiä ja jatkaa kultasijoituksien tekemistä – nyt tuli jo 36 peräkkäinen kuukausi lisäystä! Puolan lisäksi suurimpia ostajia tänä vuonna on ollut Uzbekistan.
Vähentäjien puolella on itänaapurimme ja Turkki.
7 tykkäystä
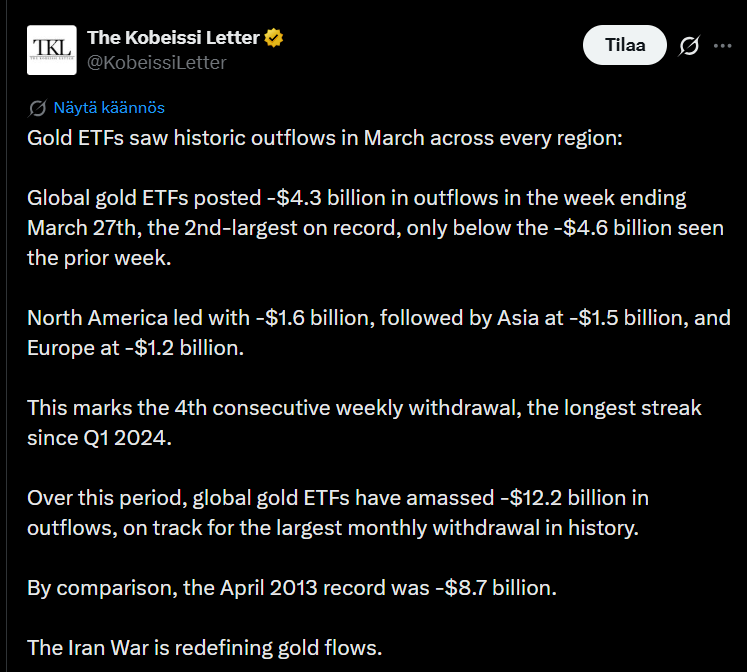
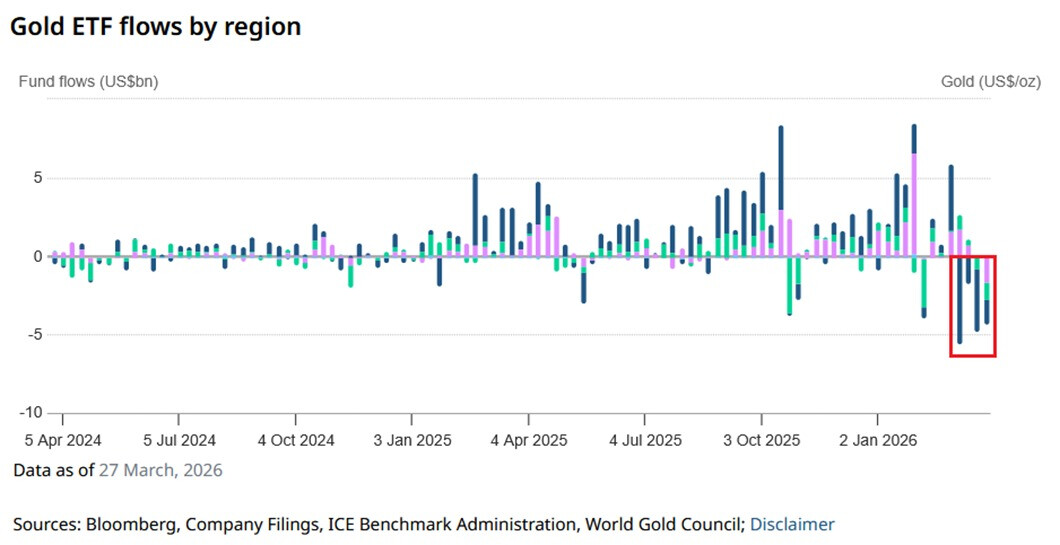
Kulta-ETF:istä on vedetty rahaa ulos poikkeuksellisen kovaa tahtia jo neljättä viikkoa putkeen. Kertonee ehkä, että sijoittajat liikkuvat nyt vähän nopeasti ja hermostuneesti. Kullan meininki ei välttis ole kadonnut, mutta muuttuneet massivirrat kertonevat tällä hetkellä jotain…
Over this period, global gold ETFs have amassed -$12.2 billion in outflows, on track for the largest monthly withdrawal in history.
By comparison, the April 2013 record was -$8.7 billion.
2 tykkäystä
Ranskan keskuspankki on parin viikkoa sitten kertonut, että he myivät kaikki New Yorkin kullat jollekin (129 tn) ja ostivat sitten uuden samanlaisen määrän Euroopasta takaisin. Tämän prosessin lopputuloksena tekivät kohtuullisesti voittoa, 12,2 miljardia EUR. Vähän toisenlainen operaatio, kun Suomen keskuspankilla vuotta aiemmin. Tässä oli ehkäpä enemmän tyyliä, ja älyä.
18 tykkäystä
Kullan hintakin nousi, koska Iran kertoi Hormuzinsalmen olevan taas auki kaupalle Israelin ja Libanonin aselevon aikana.
Tämä rauhoitti myös markkinoita; öljyn hinta laski ja osakkeet nousivat, mutta samaan aikaan Yhdysvallat ja Iran neuvottelevat sopimuksesta, mutta toki kaikki ei ole vielä todellakaan selvää.
Kullan hintaan vaikuttavat mm. myös korot ja dollarin arvo, jotka ohjaavat sijoittajien päätöksiä.
At the same time, the U.S. dollar firmed, buoyed in part by the view that heavy energy exports would help immunize the U.S. economy from oil supply disruptions through the Strait of Hormuz. A stronger dollar can make gold more expensive for overseas buyers. A tracker of the U.S. dollar slumped on Friday’s after Araghchi’s announcement, then recovered some losses to trade flat.
1 tykkäys
Alla olevassa jutussa kerrotaan, että kullan hinta laski jyrkästi, koska markkinat odottavat varmistusta Iranin ja Yhdysvaltojen mahdollisista rauhanneuvotteluista ennen varsinaisen tulitauon päättymistä.
Epävarmuus Lähi-idän sodasta, energiansaannista ja korkopolitiikasta painaa edelleen kultaa, tämän lisäksi samalla dollarin vahvistuminen ja korkojen nousu heikensivät tällaisten metallien kysyntää.
1 tykkäys
Yritin tuossa Comtradea kaivelemalla päästä käsiksi viime vuosien kullan hinnan nousun syihin, mutta se jäi vielä kesken, koska Intia ja Kiina eivät ole omaa kauppadataansa YK:n alaiselle järjestölle lähettäneet.
Tietysti meillä on keskuspankkiseurantaa Gold Councilin toimesta, mutta kokonaiskuva jää vailinaiseksi, kun yksityissijoitukset, rahastot, yritykset ja sitten valtioiden mahdollinen piilossa pysyvät ostot jäävät ottamatta huomioon. Tämän takia tullitilastot tarjoavat hyvän tien lisäymmärrykselle.
Kiinan tapauksessa kauppadataa kullan viennistä ja tuonnista on tarjolla vuodesta 2015 lähtien vuoden 2024 loppuun. Intialla taas on tätä aineistoa on 2010-2024.
Voisi sanoa, että maat ovat hyvin samanlaisia. Tuovat maahan paljon kultaa ulkomailta, mutta eivät sitä juurikaan vie muihin maihin (suhteessa tuontimäärään). Tämä tietysti on kovasti mielenkiintoista Kiinan tapauksessa, koska maa on kuitenkin maailman suurin kullan tuottaja. Eli jossain on kovasti kultaa tallessa, kun analyysivuosilta pelkkä ulkomaankaupan lisäys on ollut 599 miljardia USD. Intialla lisäys on samaa luokkaa, kun vuosia on viisi enemmän.
Kummankin maan tuonti ja ulkomaankaupan tuottama kulta omalle markkinalle kasvaa pitkällä aikavälillä, mutta 2021 lähtien Kiinan tuonti on noussut selvästi (ja tuplasti enemmän kuin hinta 2021-24). Eli voisi ajatella, että erityisesti Kiinan tuonti on ollut hintaa tukemassa tällöin.
| China | |||
|---|---|---|---|
| Export | Import | Import-Export | |
| 2010 | |||
| 2011 | |||
| 2012 | |||
| 2013 | |||
| 2014 | |||
| 2015 | $1 866 300 922 | $78 976 974 780 | $77 110 673 858 |
| 2016 | $1 237 265 211 | $63 984 721 454 | $62 747 456 243 |
| 2017 | $469 830 859 | $51 391 774 152 | $50 921 943 293 |
| 2018 | $783 268 372 | $62 273 206 906 | $61 489 938 534 |
| 2019 | $982 326 331 | $43 917 764 709 | $42 935 438 378 |
| 2020 | $3 545 015 055 | $11 414 919 164 | $7 869 904 109 |
| 2021 | $3 145 976 718 | $47 279 366 447 | $44 133 389 729 |
| 2022 | $3 281 251 509 | $76 653 531 864 | $73 372 280 355 |
| 2023 | $3 891 153 399 | $91 915 683 973 | $88 024 530 574 |
| 2024 | $12 358 141 473 | $102 710 597 652 | $90 352 456 179 |
| 2025 | |||
| Total | $31 560 529 849 | $630 518 541 101 | $598 958 011 252 |
| India | |||
|---|---|---|---|
| Export | Import | Import-Export | |
| 2010 | $109 439 843 | $38 352 372 133 | $38 242 932 290 |
| 2011 | $441 307 776 | $53 685 534 249 | $53 244 226 473 |
| 2012 | $34 105 846 | $52 606 771 655 | $52 572 665 809 |
| 2013 | $2 459 786 136 | $37 711 847 012 | $35 252 060 876 |
| 2014 | $2 433 076 925 | $31 039 689 173 | $28 606 612 248 |
| 2015 | $5 311 677 871 | $34 999 548 560 | $29 687 870 689 |
| 2016 | $4 335 429 094 | $22 944 489 540 | $18 609 060 446 |
| 2017 | $2 272 508 210 | $36 154 609 426 | $33 882 101 217 |
| 2018 | $233 023 | $31 756 390 865 | $31 756 157 843 |
| 2019 | $101 796 368 | $31 178 358 668 | $31 076 562 300 |
| 2020 | $255 352 177 | $21 922 211 576 | $21 666 859 399 |
| 2021 | $5 318 136 | $55 782 957 847 | $55 777 639 711 |
| 2022 | $75 275 837 | $36 574 558 371 | $36 499 282 534 |
| 2023 | $74 514 562 | $42 644 273 707 | $42 569 759 145 |
| 2024 | $347 236 209 | $57 568 300 894 | $57 221 064 685 |
| 2025 | |||
| Total | $18 257 058 012 | $584 921 913 677 | $566 664 855 665 |
4 tykkäystä
Keskuspankkien kultakaupan tilastot tulivat julki ensimmäiseltä kvartaalilta (World Gold Council). Maaliskuulla mentiin pitkästä aikaa reilusti vähennyksen puolelle. Suurimpana syynä on Turkki ja itänaapurimme (joskin 10-kertaa pienemmällä vähennysmäärällä). Kummallakin toki sama syy toimilleen - valtio tarvitsee nopeasti rahoitusta menoihinsa. Vähän samanlaista vähennystä oli muutama kuukausi 2023 ja silloinkin lasketeltiin jonkin verran (mutta vuosi päätyi toki kokonaisuudessaan 8,7 % nousussa).
5 tykkäystä
Kiina kasvatti kultavarantojaan viime kuussa eli jo 19. kuukautta peräkkäin.
Maa jatkaa kullan hamstraamista, samalla, kun sen hinta on laskenut kolmatta kuukautta. Tavoitteena Kiinalla on hajauttaa valuuttavarantoja ja vähentää riippuvuutta perinteisistä sijoituksista.
Goldman Sachs said last month that central bank purchases could accelerate further, citing geopolitical developments that may reinforce efforts by governments to diversify reserve assets.
The latest figures underscore the continued role of official-sector buying in the global gold market, even as investors weigh the impact of inflation, interest rates, and economic uncertainty on bullion prices.
6 tykkäystä
Tässä on SalkunRakentajan juttu kullasta.
Mitä pidempään korot pysyvät koholla, sitä vähemmän houkutteleva tuototon kulta on suhteessa korkoa maksaviin sijoituskohteisiin.
Myös Lähi-idän geopolitiikka heilautti kultaa, kun Yhdysvallat ja Iran allekirjoittivat keskiviikkona välirauhan, joka päättää helmikuun lopulla alkaneen sodan ja avaa Hormuzinsalmen laivaliikenteelle. Öljyn hinta painui kolmen kuukauden pohjalukemiin.
Aluksi sopu jopa tuki kultaa, sillä halpeneva öljy laski inflaatio-odotuksia ja heikensi dollaria hetkellisesti. Pian asetelma kääntyi, kun turvasatamapreemio suli pois ja keskuspankin kiristyslinja vei huomion.
Alaotsikot:
- Ennusteissa laskupaineita
- Suunta ratkeaa ensi viikon makroluvuista
Huom.
Juttu on tehty kaupallisessa yhteistyössä ja artikkelin lopussa on mainostusta.
Kulta kallistui jutun mukaan, koska markkinoilla seurattiin Yhdysvaltojen ja Iranin neuvotteluja sekä myös Fedin korkolinjauksia.
Iran-neuvottelujen edistyminen rauhoitti öljymarkkinaa ja vähensi siten inflaatiopelkoja, mikä tuki kultaa. Nousua toisaalta kuitenkin jarrutti vahva dollari ja odotus siitä, että Yhdysvaltojen korot voivat pysyä korkealla pidempään.
Gold prices climbed on Monday as investors monitored developments in U.S.-Iran negotiations in Switzerland and assessed the outlook for U.S. monetary policy following the Federal Reserve’s hawkish signals last week.
3 tykkäystä
Goldman Sachs uskoo ettei kullan nousu ole vielä ohi, vaikka hinta on lasketellutkin viime kuukausina.
Pankin mukaan erityisesti kehittyvien maiden keskuspankit ostavat kultaa edelleen vähentääkseen riippuvuuttaan Yhdysvaltain dollarista. Lyhyellä aikavälillä korkeat korot ja odotukset Fedin tiukasta rahapolitiikasta painavat kullan kysyntää, mutta toisaalta pidemmällä aikavälillä Goldman odottaa hinnan kääntyvän jälleen nousuun.
The researchers also noted that a recent World Gold Council survey said a record 45% of the 76 central banks surveyed between February and May expect to increase their own gold reserves over the next 12 months.
Cyclically, however, gold faces near-term headwinds as “a hawkish Fed helps fade the debasement theme” and as markets price in Fed hikes this year amid inflation concerns, weighing on rate-sensitive ETF demand.
4 tykkäystä
Alla on juttua siitä, miten Kiinan kullan tuonti nousi viime kuussa korkeimmalle tasolleen noin kahteen vuoteen.
Tässä syynä olivat kansainvälisten kultahintojen lasku ja vahvistunut juan, jotka lisäsivät markkinoiden ostohalukkuutta, lisäksi myös pankit kasvattivat kultavarastojaan vastatakseen sijoittajien kysyntään ja hyödyntääkseen niille myönnettyjä tuontikiintiöitä ennen jotain sääntömuutoksia.
3 tykkäystä
Nyt alkavat varainhoitajat heräämään Suomessakin siihen, että kulta on ollut itseasiassa ykkönen jo pitkän aikaa. Tämän LähiTapiolan kyselyn ja tuottotutkimuksen parasta antia on tiedotteen toinen kuva (tai jälkimmäinen).
6 tykkäystä
Tällaiset tarkastelut ovat kyllä todella harhaanjohtavia. Valitaan YKSI alkupiste (joka sattuu olemaan IT-kuplan huippuhetki) ja YKSI loppupiste ja sitten julistetaan joku assetti voittajaksi. Tällainen on äärimmäisen herkkä niille valituille pisteille ja kuvaajan laatija voi käytännössä päättää lopputuloksen. Entä jos olisi otettu 2003 tai 2009 alkuhetkeksi? Tai loppuvuodeksi 2023. Kuvaaja olisi todella erinäköinen ja osakkeet olisi ykkönen. Vuosi 2000 ei ole yhtään sen erityisempi kuin 2003 tai 2009.
Kun puhutaan jonkin ajanjakson tuotoista, niin mun nöyrä mielipide on että pitäisi laskea joku keskituotto säännöllisillä ostoilla (ja myynneillä).
Nyt tuo kuvaaja vastaa kysymykseen: “Jos ostit kultaa yhden kerran vuoden 2000 alussa ja myit kerralla vuonna 2025, etkä sijoittanut välissä yhtään lisää, mikä oli tuotto”. Se ei kerro 2000-luvun tyypillisestä tuotosta oikein mitään.
Ja tällaiseen kahden päätepisteen tarkasteluun syyllistytään todella usein sen ongelmia yhtään ajattelematta.
18 tykkäystä
Kullan tuotto ei vuositasolla aikoinaan 2001-2004 muuttunut kummoisesti (europohjainen; taalapohjaisesti alkoi jotain enemmän tapahtumaan 2003), vaikka vuoden 2001 tapahtumat olisivat antaneet sille hyvätkin lähtökohdat. Kullan taalahinta pohjasi vuoden 1999 aikana (jos nyt otetaan ajanjakso vuodesta 1990 alkaen). Vasta kun sotatoimet alkoivat todenteolla ympäri maailmaa ja alijäämät Yhdysvalloissa luonnollisesti kasvoivat tämän johdosta, niin koettiin hinnassa kovempia ensinousuja. Tietysti euromääräisissä nousuissa oli vähän viivettä, koska taala menetti ensin arvoaan nopeasti (ja kulta lähinnä reagoi tähän).
Seuraavassa on kullan europohjaiset vuosituotot aikaväliltä 2000-2025 (tämä on toki nimellinen, eikä inflaatiokorjattu, kuten tuo aikaisempi LähiTapiolan laskelma):
| Year | Change (EUR) |
|---|---|
| 2000 | 1,20 % |
| 2001 | 8,40 % |
| 2002 | 5,50 % |
| 2003 | -0,20 % |
| 2004 | -2,00 % |
| 2005 | 35,20 % |
| 2006 | 10,40 % |
| 2007 | 18,40 % |
| 2008 | 10,50 % |
| 2009 | 20,70 % |
| 2010 | 38,80 % |
| 2011 | 14,20 % |
| 2012 | 4,90 % |
| 2013 | -31,20 % |
| 2014 | 12,10 % |
| 2015 | -0,30 % |
| 2016 | 12,40 % |
| 2017 | -1,00 % |
| 2018 | 2,70 % |
| 2019 | 22,70 % |
| 2020 | 14,40 % |
| 2021 | 2,90 % |
| 2022 | 6,00 % |
| 2023 | 8,70 % |
| 2024 | 34,20 % |
| 2025 | 46,60 % |
| Keskiarvo | 11,39 % |
| Mediaani | 9,55 % |
| Min | -31,20 % |
| Max | 46,60 % |
| St. Dev. | 15,69 % |
| St. Dev. (%) | 72,61 % |
4 tykkäystä
Pahoittelen, jos kysymykseni menee aiheesta sivuun, mutta onko forumisteilla antaa suosituksia sen suhteen, mistä saisi parhaan hinnan nurkissa pyörivistä kultakoruista?
1 tykkäys