Amateur analyst did some quick calculations  . HelloFresh stock price of 55€ can be justified with fairly conservative assumptions.
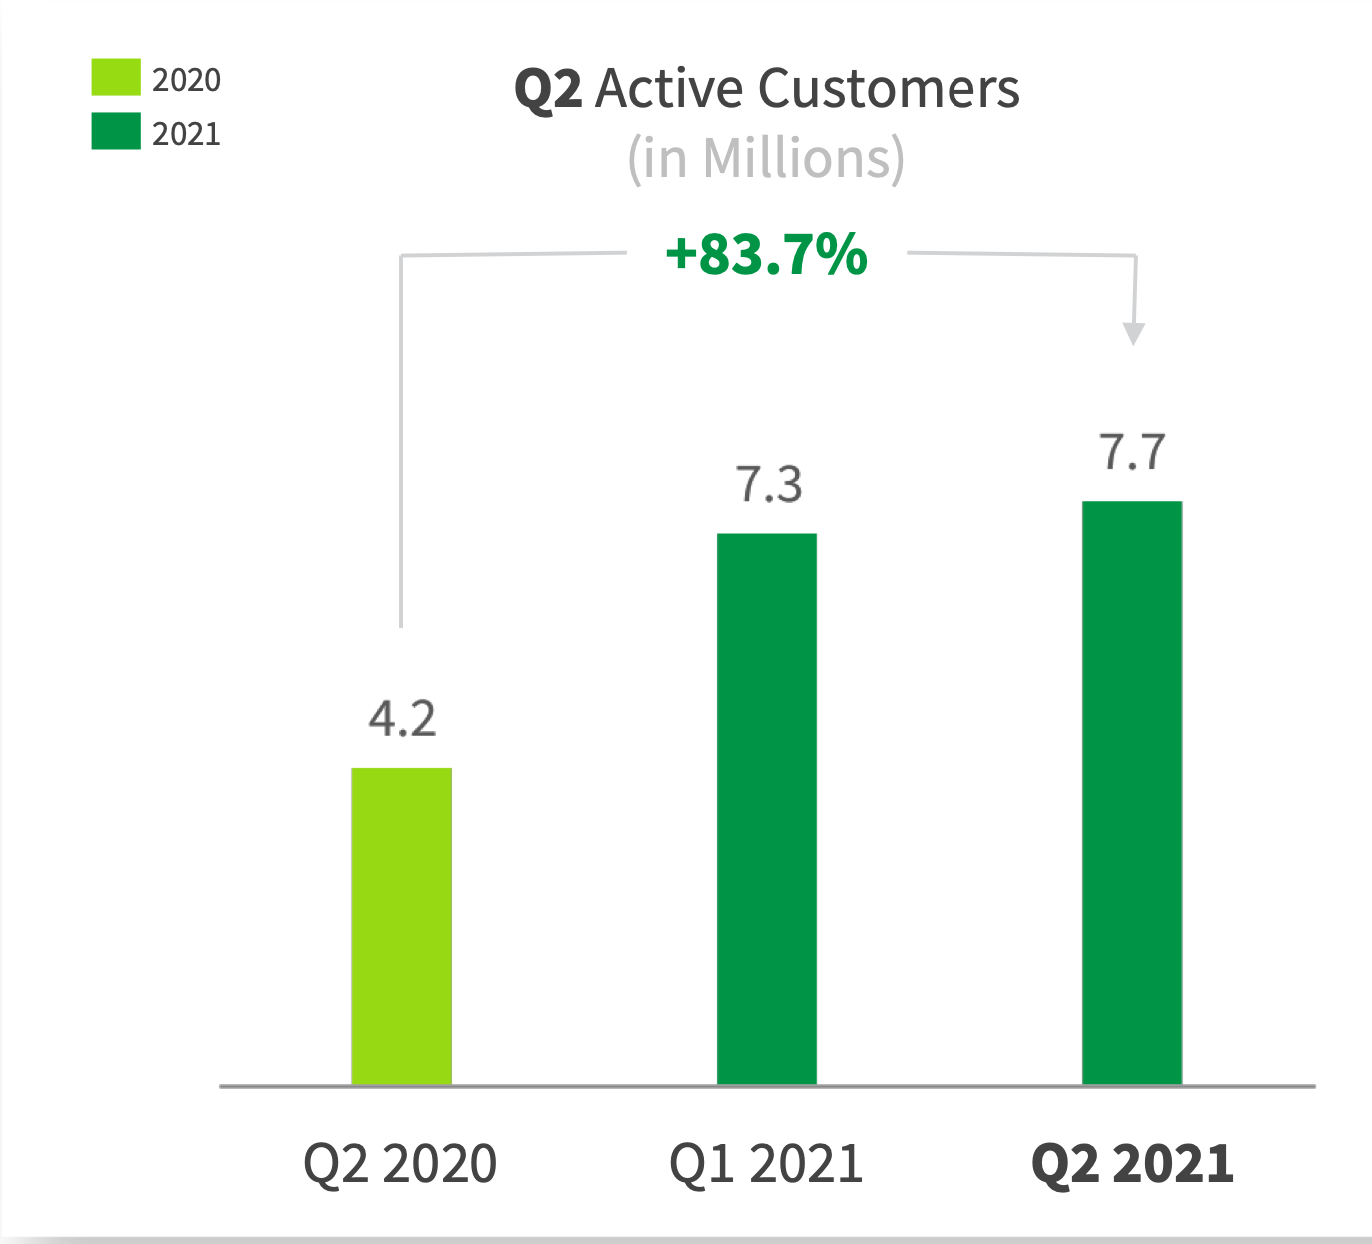
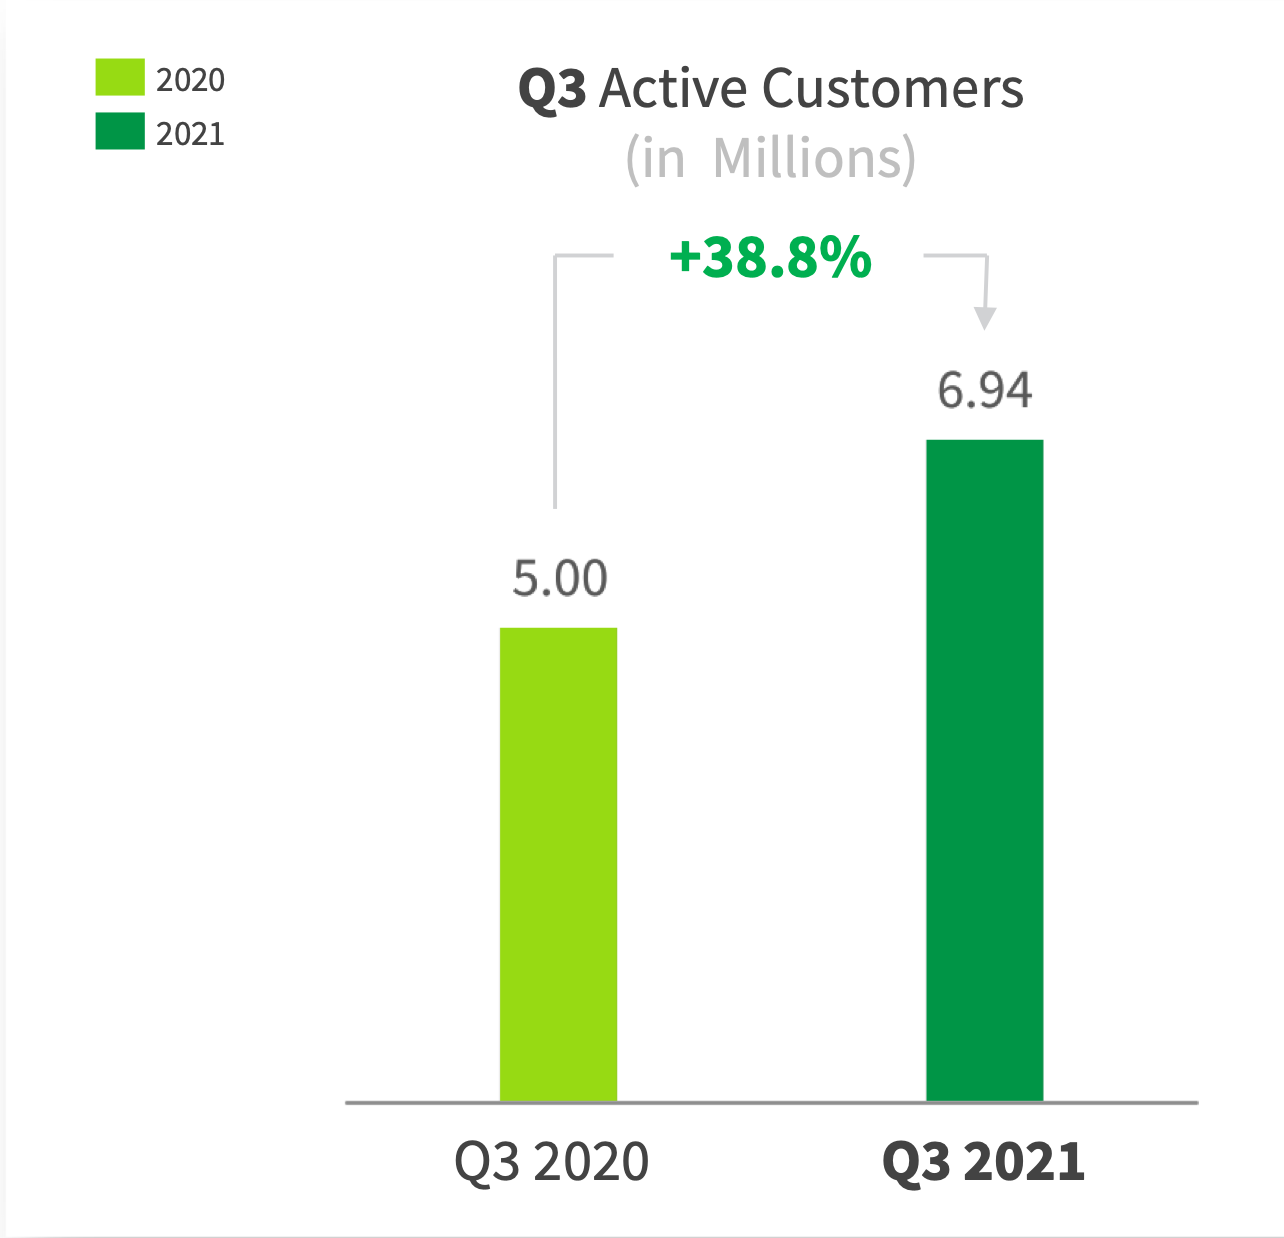
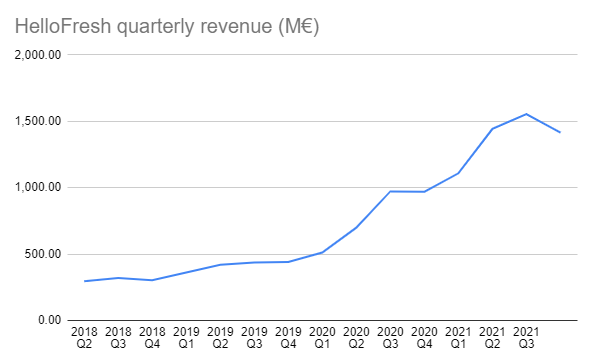
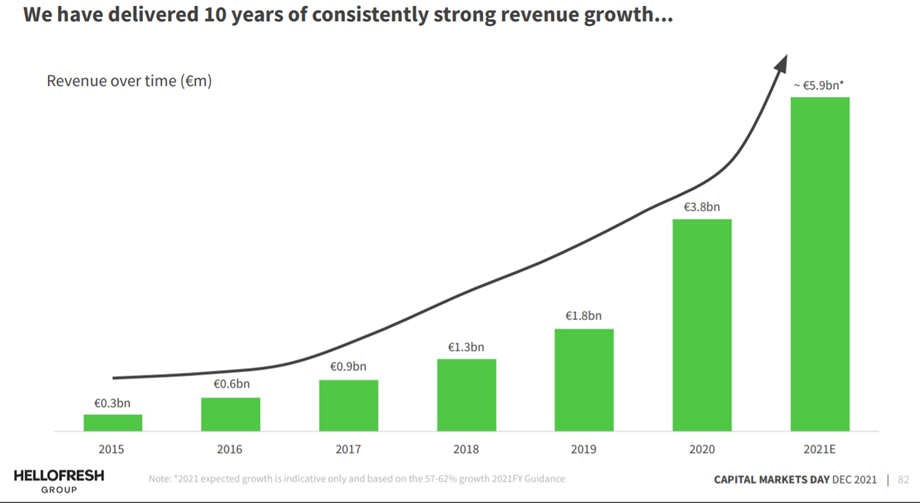
On December 8, 2021, the CMD presented the following graph, which the thread starter also referred to:
From this, the revenue growth rates since 2016 can be calculated as: 50%, 44%, 38%, 111%, and 55%. How to model this?
If we assume that from 2016 onwards, the growth rate would have decreased geometrically by 12% per year without the pandemic as the market saturates, we would get the following 20-year growth rates:
0.5, 0.44, 0.39, 0.34, 0.3, 0.26, 0.23, 0.2, 0.18, 0.16, 0.14, 0.12, 0.11, 0.09, 0.08, 0.07, 0.06, 0.06, 0.05, 0.04
How to model the pandemic? Let’s assume that its impact brought forward 5 years of growth from 2020-2024 to 2020 & 2021, with 2/3 in 2020 and 1/3 in 2021. This gives the following 20 years:
0.5, 0.44, 0.39, 1.2, 0.48, 0.18, 0.16, 0.14, 0.12, 0.11, 0.09, 0.08, 0.07, 0.06, 0.06, 0.05, 0.04, 0., 0., 0.
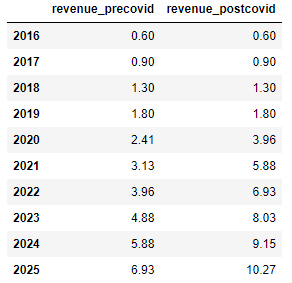
From this, we get the following revenue projection (€ BN):
These match well . Compare the company’s own statement at the CMD if 2025 is interpreted as ‘midterm’.
Midterm growth ambitions:
• Revenue € 10 BN
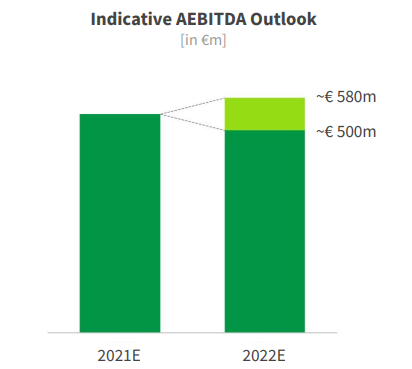
• AEBITDA margin 10-15%
• FCF conversion: Best-in-class
And also the company’s own targets. The assumed revenue growth rate for 2022-2025 is slightly below this:
We are targeting 20-26% (Constant Currency) revenue growth in 2022
- Increase penetration across existing markets, new geographies and launching US brands (RTE) into international markets 15%
- Expand monetization strategies, launch and scale new and adjacent verticals 5-7%.
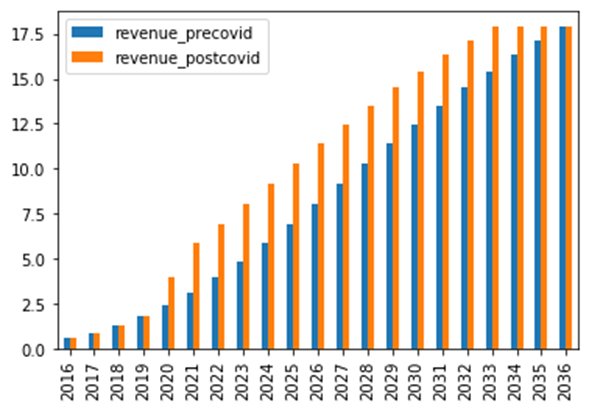
Finally, a longer-term visualization up to 2036:
Good. Then, let’s simplify things a bit. Current Q1-Q3 revenue is €4413M, linearly interpolating to €4413/0.75 = €5884M in 2021. The table predicts €5880M, and for the longer term:

Assuming a constant number of shares of 173,501,251, the company is debt-free, and earnings can be distributed to owners (justifications * and **). With an 8% EBIT margin and a 30% tax rate, we get the following EPS:
- 2021: €1.90
- 2025: €3.31
- 2030: €4.98
- 2035: €5.77
Let’s assume that in year X, the company distributes earnings as dividends, the real required rate of return is 5%, earnings growth equals inflation, and the company no longer grows in real terms. This would mean a PE of 20 for the stock and the following price:
- 2021: €37.9
- 2025: €66.3
- 2030: €99.6
- 2035: €115.4
Discounting the stock price to the present using this 5% required rate of return:
- 2021: €37.9
- 2025: €54.5
- 2030: €64.2
- 2035: €58.3
The present value decreases from 2030 onwards by extrapolation because the growth rate does not exceed the required rate of return, meaning the company would invest all earnings, and its marginal ROE % would be less than 5%.
The current price (€55) thus includes the company’s target of growing revenue to €10 BN in 2025 + EBIT of 8%, but any performance exceeding this brings excess returns. Quality companies tend to appear reasonably priced on paper and yet surprise expectations in a way that is not evident from the numbers in this type of analysis (Revenio, Qt, Talenom, Remedy, Admicom, etc.). Markets are not won with such a superficial analysis, but the idea is to justify that the company is at least reasonably priced.
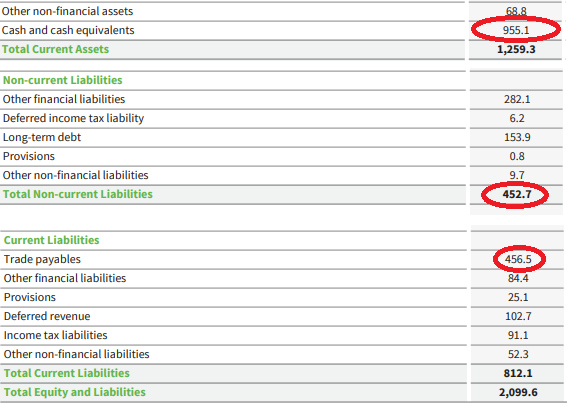
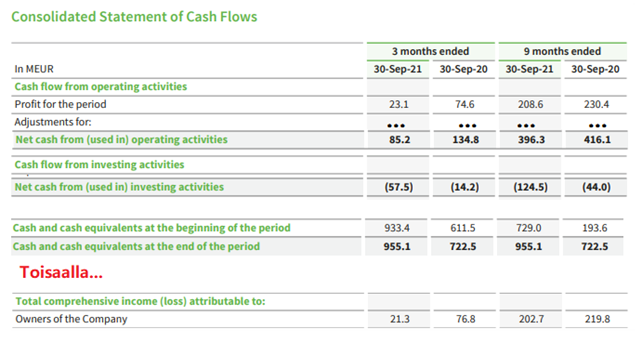
*) The company is practically net cash if one considers what part of the balance sheet is interest-bearing debt:
**) It converts earnings very well into cash flow: