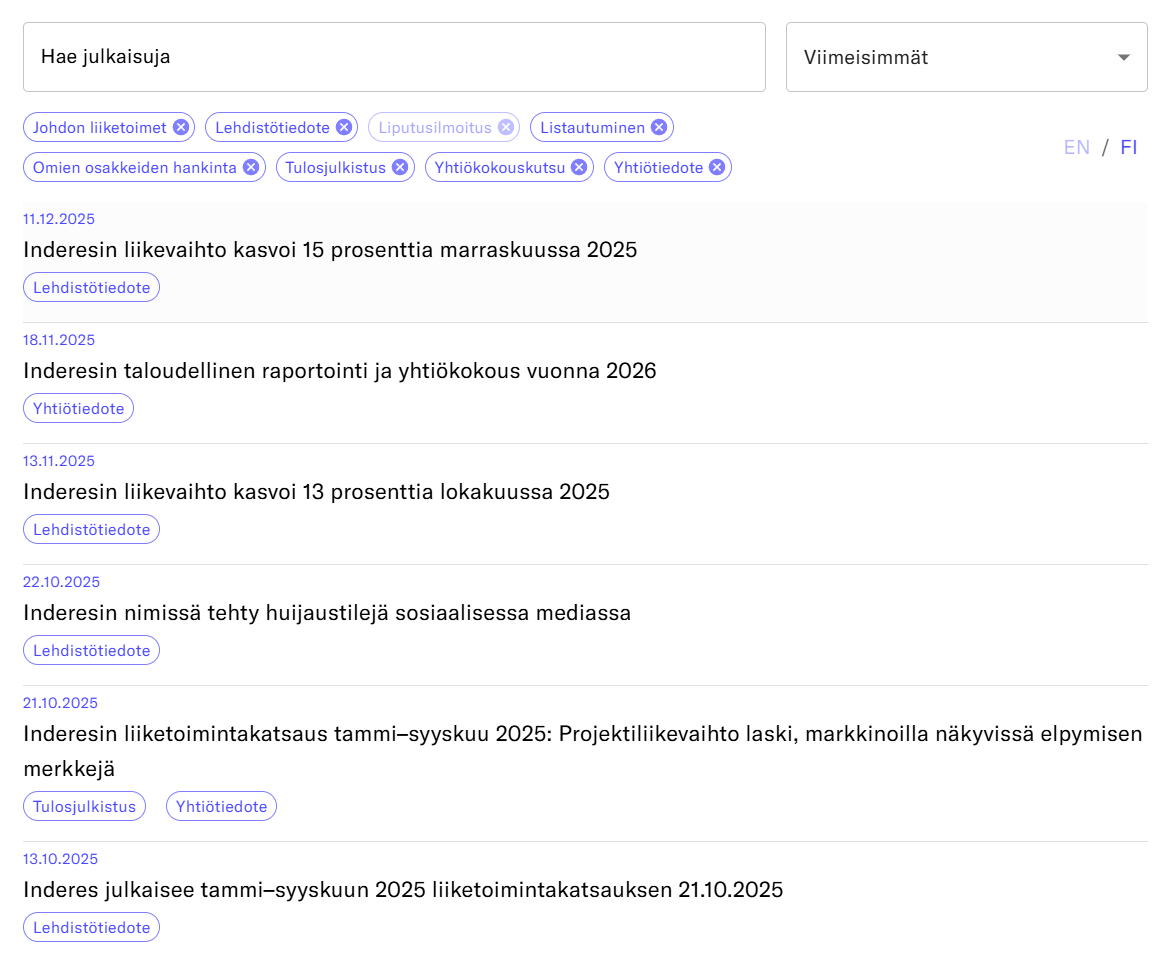
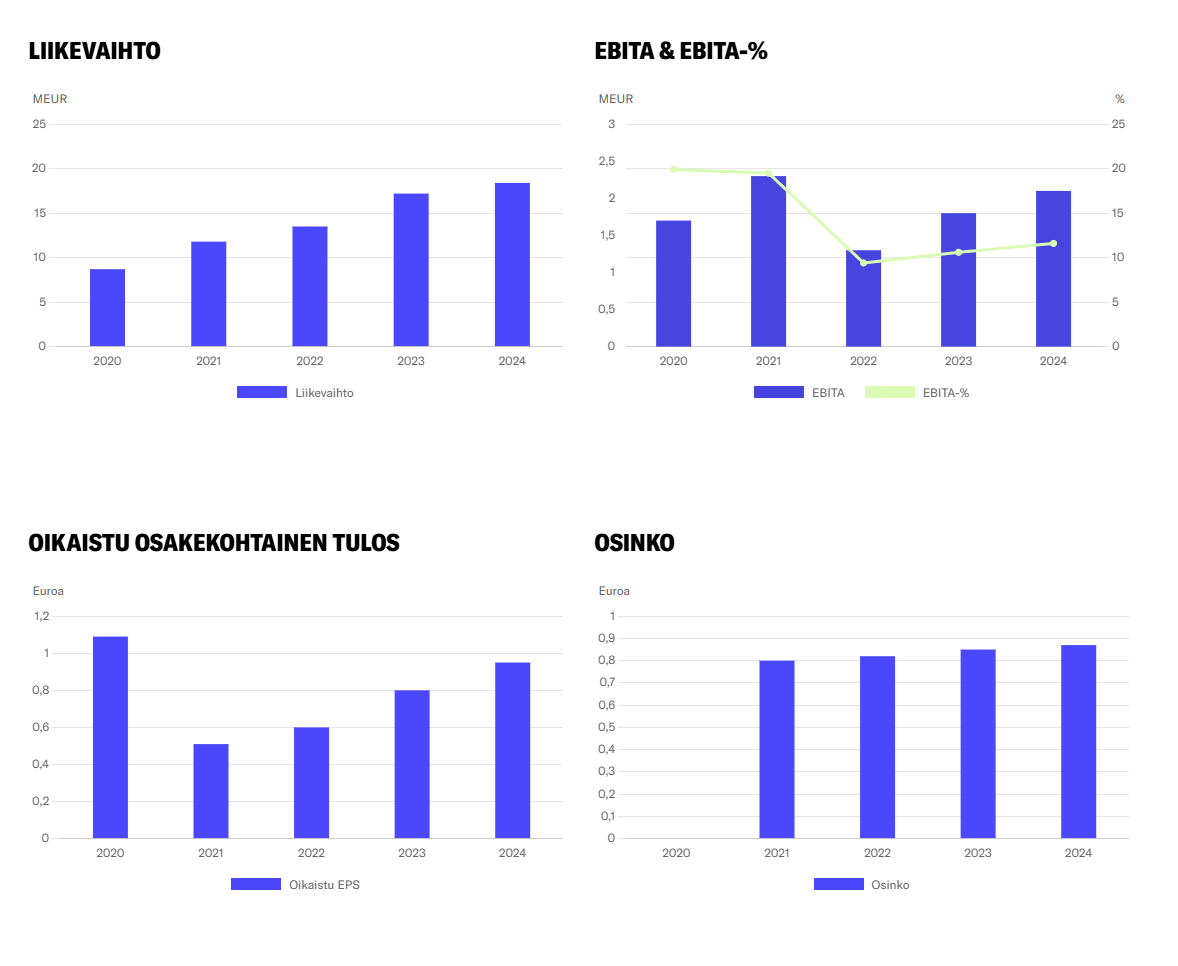
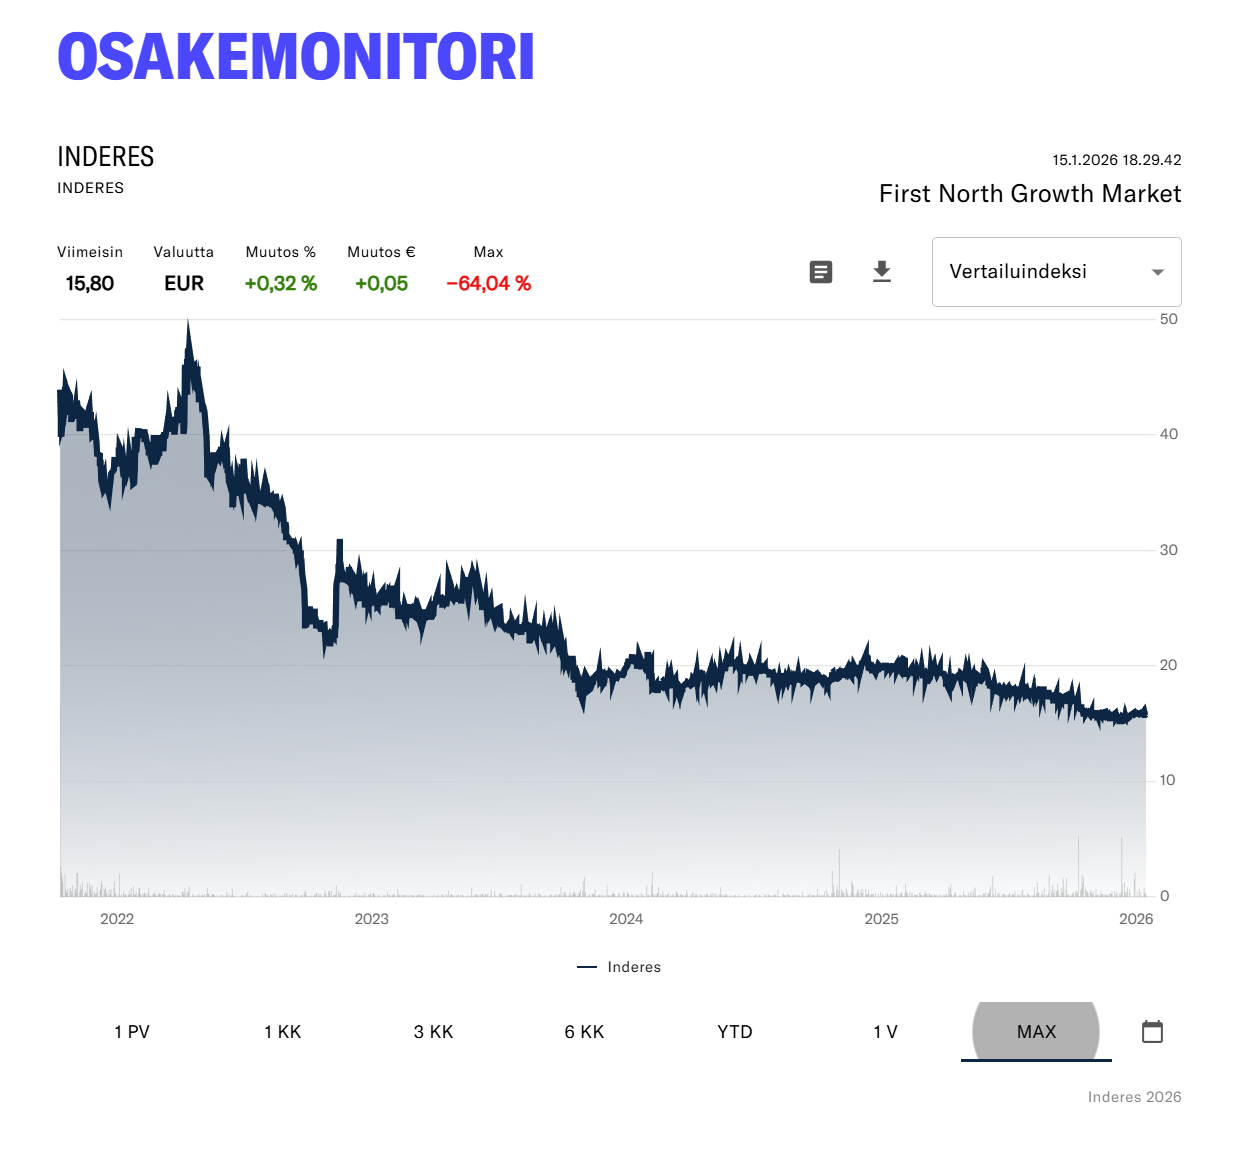
I am starting a thread here for development ideas for investor pages, press release distribution, and site components—i.e., our Inderes B2B IR Software products. We provide ready-made, regulatory-compliant components for listed companies’ investor pages, such as share price charts, shareholder information, management holdings, sentiment and key figure graphs, as well as press release distribution, archives, and feeds. We also offer the entire investor site as a SaaS service for listed companies, for example, https://investors.finnair.com/fi. Below are examples of individual components. We are already in a leading position in Finland regarding these products, but your support and feedback would be gold for our future The credit for the success of this product already belongs to you, as these were originally built based on your feedback!
As a product owner, I have been considering, among other things, whether we should offer our B2B listed company clients a return calculator as a ready-made component for their investor pages. Below is an example: https://www.sampo.com/fi/sijoittajat/osake/sijoituslaskuri/
What do you think? Does this provide added value for investors/owners?
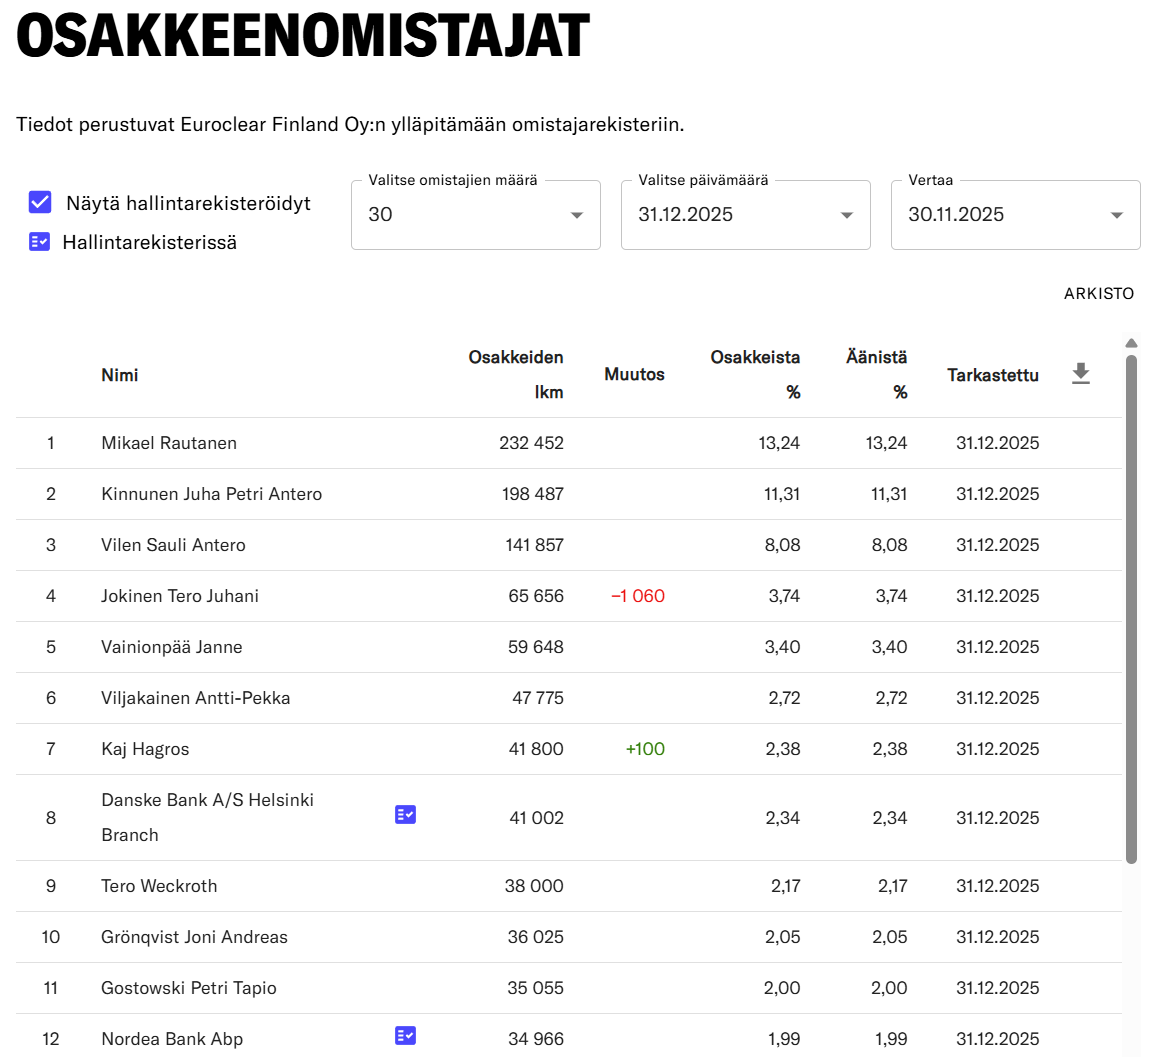
This gave me a small and simple idea that could make tracking TOP 100 shareholder lists easier. When a new name appears on the list, a small icon saying “NEW” or something similar would appear next to the name. When a name leaves the TOP 100 list, there could be a list of those who left within the chosen timeframe below the table. You would be able to see information about changes more easily at a single glance. Currently, in both Inderes’ and our competitors’ stock tools, one has to manually extract the information by comparing different lists in the way Nukke described.
And regarding changes in the amount owned, it would be nice to be able to click on an owner’s name to access that specific owner’s history without having to constantly scroll back the timeline for the entire list.
@Yu_Gong a tool depicting the historical development of companies’ share counts would be great.
Cancellations of treasury shares reduce the number of shares and share issues increase it, but clear descriptions of the historical changes in share counts are rarely found on companies’ investor relations pages. It should include at least:
Share count at the end of each year (preferably quarterly as well)
Annual change in absolute numbers and percentages for each year
The figures should be split-adjusted so they don’t get mixed up by splits
The return calculator could certainly be implemented somewhat like a total return index (GI index) but on a per-stock basis. In practice, in addition to the stock price, dividends would also be taken into account (plus breakdowns of how the price changed during the observation period, how much dividend was paid, and what the total return is). A CAGR-style average annual return could also be calculated from this if a multi-year period is being examined.
Additionally, it could be interesting to visualize how the ownership rankings of different owner entities have changed during the comparison period, e.g., with green up arrows and red down arrows. To get more specific, you could show the previous top 30/50/100 ranking from which they have risen or fallen.
By the way, was this already thanks to Inderes’ services? At least Neste has now moved to that long-awaited clarification in the headline. No one is actually interested in those share-based rewards, and quite a few unnecessary clicks are saved. I’m posting this in this thread since it’s active anyway. I believe previously only the “Paasikivi companies” had adopted this (Kemira, Uponor, and Tikkurila): Neste Corporation - Managers’ Transactions, Sipilä (receipt of share-based reward)