ChatGPT 5.4 Pro, Deep Research responded on April 7, 2026:[details=“Summary”]
A Viable Growth-Oriented Investment Portfolio for 2026
This is a model portfolio based on research and public sources, not personal investment advice. It is constructed for the situation on April 7, 2026 (Europe/Helsinki) and complies with the macro assumptions you provided (Iran war, data center power bottlenecks, decline in SaaS valuations).
A Sectors in Order of Preference
“Mandatory” Conclusions for Sector Screening Based on Macro Assumptions
The continuation of the Iran war for at least 3 months (and disruptions in the Strait of Hormuz) steers the model towards sectors that have (a) pricing power, (b) non-discretionary demand, and (c) the ability to benefit from or at least withstand an energy price shock. In this scenario, energy prices have risen sharply, physical crude oil prices have reached extremely high levels, and the IMF and central bank actors have warned of the impact on inflation and growth (as well as the risk of “higher for longer” interest rates).
The continuation of electricity availability issues for data centers is a clear signal that the bottleneck is not just “AI data centers,” but above all grid interconnection, power grid capacity, component availability, and execution schedules. The International Energy Agency (IEA) highlights power grids as a bottleneck, estimating, among other things, that over 2,500 GW of generation/load/storage projects are stuck in the queue, and that grid investments need to grow by about 50% by 2030 (from the current level of ~$400 billion/year) – while planning, permitting, and building new grids can take 5–15 years, whereas building data centers often takes 1–3 years.
The decline in SaaS valuations and the fear that “AI is eating SaaS” is twofold in the analysis: part of the software landscape is genuinely at risk of eroding pricing power, but the market may also generalize the fear too broadly. In this framework, I use:
- Gartner forecasts on IT and AI spending growth and the proliferation of AI agents into applications.
- BVP Nasdaq Emerging Cloud Index metrics as a “thermometer” for the valuation level and growth of cloud software (e.g., average revenue multiple).
- Goldman Sachs publications in framing the AI risk for application software (“AI can change the user interface and workflows, but the market may also price the risk too broadly”).
Systematic Screening and Ranking of Sectors
Below is the ranking (best → weakest) based precisely on the criterion of “strong revenue and operating profit growth over 2–5 years” with risk managed and binary risks avoided.
| Investment Suitability 2026 (Best→Weakest) |
Sector / Theme |
Why Attractive 2–5 Yrs |
Impact of Macro Assumptions |
Key Risk |
| 1 |
Power Infrastructure & Electrification (grids, distribution, switchgear, power modules, cooling, energy efficiency) |
Structural, investment-driven growth: electricity demand is rising and the grid is a bottleneck; component demand + investments support revenue and margins for leading suppliers. |
Data center power bottlenecks = “forced” grid and electrification capex. Iran scenario supports energy efficiency and security-of-supply investments. |
Capex cycle timing, component shortages (transformers, switchgear), project delays; potential “overcapacity” later. |
| 2 |
Cybersecurity (network, cloud, and identity security, SOC automation) |
Demand is close to non-discretionary: AI increases the attack surface, and the geopolitical environment raises priority. Gartner emphasizes AI, geopolitical tensions, and regulation driving cyber trends in 2026. |
Iran scenario increases cyber risk and the need to protect critical infrastructure; the proliferation of AI agents also increases “machine identity” security. |
Price pressure in “subcategories” (commoditizing features), as well as intensifying competition in platforms. |
| 3 |
Semiconductors & AI Infrastructure (chips, networking, ASIC/XPU, memory chain) |
The continuation of the AI investment cycle (AI spending and infrastructure) supports strong revenue growth. Gartner estimates AI spending will grow strongly in 2026 and IT spending will grow clearly. |
Data center power bottlenecks can delay deliveries (delays), but the capacity being built does not disappear → demand shifts. Iran scenario: energy prices and interest rates could weigh on valuations. |
Cyclicality and valuation risk; additionally, geopolitical constraints in supply chains (export controls). |
| 4 |
Defense & Aerospace |
Long “re-arm/restock” theme: defense spending has risen sharply, and geopolitical uncertainty supports order books. NATO reports that European allies’ and Canada’s defense spending has risen sharply in real terms, and SIPRI reports record global defense spending. |
Iran scenario supports defense demand and investments in logistics/air and missile defense. |
Political budget risk (if tensions ease), as well as valuation stretching in “one direction” (crowded trade). |
| 5 |
Healthcare Innovation (drug development, medtech, diagnostics) |
Population aging and the burden of chronic diseases support long-term demand; at the same time, drug development innovation continues (e.g., new FDA approvals). |
Iran scenario: inflation/interest rates could weigh on riskier biotech parts; on the other hand, demand is more defensive than in consumer sectors. |
Regulatory and reimbursement system changes; the innovation theme also includes high dispersion (winners vs. losers). |
| 6 |
High-Quality Cloud & Enterprise Software (SaaS winners, platforms) |
IT spending will grow in 2026 and AI infrastructure will remain strong. At the same time, SaaS valuations have fallen: in BVP Cloud metrics, revenue multiple levels have moderated compared to peak years. |
AI agents are changing usage and could erode “seat-based” pricing in some tools (justified fear), but the market may also price the risk too broadly for those with strong data/workflow moats. |
Loss of pricing power in certain horizontals; “AI crowding-out” (infrastructure taking budget from applications) in weaker categories. |
| 7 |
Consumer Discretionary |
Weaker: energy price and inflation pressure impair purchasing power and growth in the scenario. |
Iran scenario negative; interest rate risk negative. |
Demand shock and margin pressure. |
| 8 |
Leveraged / Rate-Sensitive (REITs, low quality) |
Weaker: interest rate risk and energy price risk, plus potential financing availability. |
Iran scenario increases inflation → interest rate pressure. |
Financing and valuation risk. |
SaaS and AI Fear Separately: Where Justified, Where Exaggerated
Justified Fear (AI can destroy pricing power), especially when:
- The product is a “thin” user interface around work and an AI agent can do the same work directly in backend systems; seat-based pricing is vulnerable if work is automated.
- Product differentiation is low (commoditizing categories where features are quickly copied by AI).
Exaggerated Fear (AI is more likely to strengthen competitive advantage) when:
- Software is a “system of record” and deeply embedded in processes: data, audit trail, compliance, and integrations create high switching costs; AI acts as an additional layer, not a replacement. (This is also a theme visible in SEG’s 2026 SaaS reports regarding buyer preferences: buyers reward sustainable growth, engagement, and workflow/data-anchored products.)
Winner Segments 2026–2030 (Probable):
- Cybersecurity (AI increases both attacks and the need for protection).
- Cloud platforms where AI infrastructure and distribution already exist (budget flows go to both infrastructure and AI features).


B Ready-Made Portfolio Proposal as a Table
Construction principle: 1) global core + risk brake, 2) clear “winner themes” (power infra, AI infra, cyber), 3) high-quality, profitable individual companies where growth drivers are structural rather than driven by a single event.
Note: ETFs have been selected as EU-region exchange listings (in practice Xetra here), and can be found on Nordnet’s listings with the chosen ticker.
| Investment target |
Type |
Sector / theme |
Weight |
Ticker |
ISIN (ETF) |
Exchange |
Short rationale |
| Vanguard FTSE All-World UCITS ETF (USD) Accumulating |
ETF |
Global equity core |
30% |
VWCE |
IE00BK5BQT80 |
Xetra |
Broad, cost-effective “all-world” core that diversifies the risk of individual themes. |
| Amundi MSCI World Minimum Volatility Advanced UCITS ETF Acc |
ETF |
Risk brake / lower volatility |
10% |
WMMV |
IE0001DKJVC2 |
Xetra |
Cuts the portfolio’s “worst drawdowns” in a scenario where an energy price shock keeps volatility and interest rates sensitive. |
| VanEck Semiconductor UCITS ETF |
ETF |
AI infra / semiconductors |
9% |
VVSM |
IE00BMC38736 |
Xetra |
Broad exposure to the semiconductor chain; benefits from AI capex, but weight kept controlled due to cyclicality. |
| First Trust Nasdaq Clean Edge Smart Grid Infrastructure UCITS ETF - Class A |
ETF |
Power infra / smart grids |
9% |
GRID |
IE000J80JTL1 |
Xetra |
Direct “grid and electrification capex” theme: bottlenecks are driving investments. |
| iShares Digital Security UCITS ETF USD (Acc) |
ETF |
Cybersecurity |
5% |
L0CK |
IE00BG0J4C88 |
Xetra |
Cyber is one of the most defensive themes of 2026: AI + geopolitical trends force spend. |
| iShares Global Aerospace & Defence UCITS ETF USD (Acc) |
ETF |
Defense |
4% |
5J50 |
IE000U9ODG19 |
Xetra |
Upward trend in defense spending, but weight kept small so the theme doesn’t dominate with “war cycle” risk. |
| iShares Healthcare Innovation UCITS ETF USD (Acc) |
ETF |
Healthcare innovation |
3% |
2B78 |
IE00BYZK4776 |
Xetra |
Long-term demand (aging) + innovation flow, but high dispersion → moderate weight. |
| Schneider Electric SE |
Stock |
Electrification, energy management, data centers |
6% |
SU |
– |
Euronext Paris |
Proven growth and profitability; data center drive and margin development. |
| Eaton Corporation plc |
Stock |
Power infra, power modules, data center demand |
6% |
ETN |
– |
NYSE |
Exceptionally strong order/backlog visibility and segment profitability; benefits from electrification and data center cycle investments. |
| Broadcom Inc. |
Stock |
AI chip infra (ASIC/XPU) & networking |
6% |
AVGO |
– |
Nasdaq |
Strong growth in AI chip and networking demand and long contract visibility (e.g., Google TPU partnership). |
| Microsoft Corporation |
Stock |
Cloud & enterprise software (AI + “core SaaS”) |
6% |
MSFT |
– |
Nasdaq |
Wide distribution and cloud earnings: Azure has grown strongly and the company reports growth in both revenue and operating profit. |
| Palo Alto Networks, Inc. |
Stock |
Cybersecurity platform |
6% |
PANW |
– |
Nasdaq |
Cyber platform also positioned for securing agentic AI; complements the cyber ETF’s diversification nature with an individual “quality winner” selection. |
C Rationale for Each Investment Target
Below for each selection: why chosen, 2–5 year growth driver, risks, why better than alternatives, role in the portfolio.
Vanguard FTSE All-World UCITS ETF (VWCE)
The selection is the core because it provides global stock market exposure through a single instrument, preventing theme bets from making the portfolio “messy.” The cost structure is low and the ETF is large, which is important in practical implementation. Vanguard
The growth driver in 2–5 years is the compounding of global earnings growth and dividends (company-level diversification across ~thousands of holdings).
Risk: global stock market risk (drawdowns), currency risk, and the fact that the index also includes lower-growth sectors. Role: the “spine” upon which themes are built.Amundi MSCI World Minimum Volatility Advanced UCITS ETF (WMMV)
Chosen because, in a scenario where an energy price shock and inflationary pressure may keep volatility high and increase the risk that rate-sensitive, long-duration growth stocks face valuation pressure. Amundi
Growth driver: not “maximal growth,” but risk-adjusted return; lower fluctuation makes the overall portfolio easier to manage.
Risk: lags behind in a strong “risk-on” rally (when high-volatility stocks lead). Better than alternatives in this portfolio because it acts specifically as a risk brake without moving into fixed-income instruments (which were not requested). Role: lowers the portfolio’s overall risk and reduces the fluctuation caused by the binary macro scenario (oil/inflation).
VanEck Semiconductor UCITS ETF (VVSM)
Chosen because semiconductors are the economic center of the AI infrastructure “bottleneck chain”: the growth of AI spending and IT spending creates a demand base for computing, memory, and networking chips. VanEck
2–5 year driver: the continuation of the AI infrastructure investment cycle.
Risk: cyclicality and valuation (chip demand could normalize; energy prices/interest rates could weigh on it).
Why an ETF instead of a “single chip company”: avoids binary company risk (product or customer dependency). Role: growth engine, but with only a 9% weight to manage risk.
First Trust Nasdaq Clean Edge Smart Grid Infrastructure UCITS ETF (GRID)
Chosen because the electricity bottlenecks of data centers make power grids and electrification a “mandatory investment destination.” According to the IEA, grids are a bottleneck and the need for grid investments is growing significantly, while implementation times are long.
2–5 year driver: grid expansion and modernization, investments related to unlocking capacity (switchgear, transformers, automation), and connecting data centers to the grid.
Risk: component availability and project delays; additionally, some holdings are cyclical infrastructure operators.
Why better than a “general industrials ETF”: hits the bottleneck (the power grid) more directly, which the IEA highlights as critical. Role: the portfolio’s most important “datacenters meet electricity” satellite.
iShares Digital Security UCITS ETF (L0CK)
Chosen because the 2026 cyber trend is driven by both AI and geopolitical tensions, and Gartner highlights these in its 2026 cybersecurity trends. BlackRock
2–5 year driver: companies increasing security in AI environments (data, identities, cloud, SOC automation).
Risk: competition and pricing pressure in certain categories.
Why this ETF: according to justETF, this is a cost-competitive and large digital security index tracker. Role: the diversified cornerstone of the cyber theme, complemented by individual stock selection.
iShares Global Aerospace & Defence UCITS ETF (5J50)
Chosen because the defense spending trend has been upward, and NATO’s latest report highlights the growth of defense investments in Europe and Canada; SIPRI reports record levels of global defense spending.
2–5 year driver: order backlog growth and rearmament.
Risk: the theme may be “crowded,” and if the geopolitical situation unexpectedly normalizes, valuations could unwind. Hence the 4% weight.
Why global instead of just Europe: reduces the risk of a single region’s budget policy (diversification). Role: a “geopol-hedge” but with a controlled weight.
iShares Healthcare Innovation UCITS ETF (2B78)
Chosen because healthcare innovation combines demographic demand (aging) with new drug development approvals. The WHO estimates the 60+ population will grow strongly toward 2030, and the FDA reports a significant number of new drug approvals annually (e.g., the 2025 and 2026 lists).
2–5 year driver: innovation flow (drugs, diagnostics, medtech) and demand stability.
Risk: dispersion in the innovation theme is high (some companies are more “binary” biotech cases), so the weight is kept at 3%. Role: diversification and a more defensive growth component.
Schneider Electric (SU, Euronext Paris)
Chosen because the company reported strong growth and profitability in 2025: organic revenue grew, Data Center stood out as a growth driver in Q4, and adj. EBITA and margin improved. This is directly aligned with the data center electricity bottleneck and electrification theme.
2–5 year driver: electrification (distribution, automation), data center investments, and energy efficiency (electricity is expensive → optimization).
Risks: industrial cycle and capex timing; currency effects (as a global operator).
Why better than closest alternatives (e.g., other electrical engineering conglomerates): in this portfolio, it is chosen for “proven” growth and data center-driven momentum (the company’s own reported figures). Role: the portfolio’s “quality winner” in the electrical infrastructure theme.
Eaton (ETN, NYSE)
Chosen because Eaton reported record sales and strong profitability in Q4/2025; furthermore, order trends and backlog grew significantly, especially in the Electrical segments, and the company is providing guidance for growth and strong margins in 2026. This fits the “grid is a bottleneck” scenario, where demand is visible in order backlogs.
2–5 year driver: investments in the electrification and data center cycle, which drive up demand for electrical components. (Conclusion based on the IEA’s growing need for grid investments and the order/backlog momentum reported by Eaton.)
Risks: capex overheating and subsequent normalization; valuation if the market prices in a “perfect cycle.”
Why better than alternatives: in this portfolio, it is chosen because the company simultaneously reports (1) growth, (2) profitability, and (3) backlog visibility. Role: the second “cornerstone” in the electrical infrastructure theme alongside Schneider.Broadcom (AVGO, Nasdaq)
Selected because Broadcom is reporting extremely strong AI segment growth and visibility: according to the company, Q1/2026 AI revenue grew strongly (company earnings release), and Reuters reported on a long-term agreement with Google to develop and supply custom AI chips (TPUs), which improves predictability.
2–5 yr Driver: growth in custom ASIC/XPU demand, AI networking, and customer (hyperscaler) capex.
Risks: AI capex “breather”, customer concentration, and semi-cycle volatility.
Why better than closest alternatives: the selection emphasizes a profitable, cash flow-generating, already scaled AI infrastructure player rather than a small “single product” story. Role: a single “AI infrastructure” stock in the portfolio that complements the diversification of the semiconductor ETF.
Microsoft (MSFT, Nasdaq)
Selected because Microsoft reported strong revenue and operating profit growth (FY2025) and Azure business scale (over $75 billion annualized), as well as rapid Azure growth also in the FY2026/Q2 reporting.
2–5 yr Driver: growth in IT spending in 2026 and AI spending, where cloud and AI features are central. (Conclusion based on Gartner IT/AI spend forecasts and Microsoft’s own reported cloud figures.)
Risks: AI investment capex pressure may temporarily weigh on cash flow and margins; additionally, in the SaaS market, some categories may face pricing pressure due to AI agents.
Why better than “narrower” SaaS companies: this portfolio aims to avoid the binary disruption risk of a single application category and instead take broad exposure (cloud + platform + ecosystem). Role: the portfolio’s “SaaS winner without a lottery ticket.”
Palo Alto Networks (PANW, Nasdaq)
Selected because the 2026 cyber trend highlights pressure created by AI, the geopolitical environment, and regulation – and Palo Alto is reporting and launching solutions specifically for securing agentic AI (company IR news feed).
2–5 yr Driver: “mandatory” growth of cyber budgets for AI environments and critical systems.
Risks: competition and valuation, as well as the commoditization of parts of the cyber market.
Why this stock + cyber ETF: the ETF diversifies the sub-theme, and the stock brings “convexity” (if platforms win in the new agentic AI security layer). Role: strengthens cyber weight in a controlled manner.
D ETF Review
Below is a separate review row for each ETF (UCITS / EU listing / Nordnet):
| ETF |
UCITS |
EU-Listed |
Available on Nordnet |
| Vanguard FTSE All-World UCITS ETF (VWCE, IE00BK5BQT80) |
Yes |
Yes (Xetra) |
Yes (Nordnet listing VWCE Xetra) |
| Amundi MSCI World Minimum Volatility Advanced UCITS ETF (WMMV, IE0001DKJVC2) |
Yes |
Yes (Xetra) |
Yes (Nordnet listing WMMV Xetra) |
| VanEck Semiconductor UCITS ETF (VVSM, IE00BMC38736) |
Yes |
Yes (Xetra) |
Yes (Nordnet listing VVSM Xetra) |
| First Trust Smart Grid UCITS ETF (GRID, IE000J80JTL1) |
Yes |
Yes (Xetra) |
Yes (Nordnet listing GRID Xetra) |
| iShares Digital Security UCITS ETF (L0CK, IE00BG0J4C88) |
Yes |
Yes (Xetra) |
Yes (Nordnet listing L0CK Xetra) |
| iShares Global Aerospace & Defence UCITS ETF (5J50, IE000U9ODG19) |
Yes |
Yes (Xetra) |
Yes (Nordnet listing 5J50 Xetra) |
| iShares Healthcare Innovation UCITS ETF (2B78, IE00BYZK4776) |
Yes |
Yes (Xetra) |
Yes (Nordnet listing 2B78 Xetra) |
E Risk Analysis for the Entire Portfolio
Key Macro Risks
Energy price shock + inflation + interest rates: In the Iran scenario, energy prices have risen and institutions have highlighted inflation pressure, which can keep the interest rate environment tight and raise the cost of capital. This weighs particularly on high valuation multiples (long-duration growth companies).
Economic slowdown: The IMF has signaled the risk of slowing growth due to war and energy disruptions. This increases cyclical risk (industries, some semiconductors).
Data center electricity bottleneck: Although this is the portfolio’s “thesis,” it is also a risk if the bottleneck changes abruptly (e.g., streamlining of permit processes + investment boom turning into overcapacity). However, the IEA emphasizes the long lead time and investment need of grids, which makes a quick fix unlikely – but not impossible.
Key Sector Risks
Power infrastructure: The biggest risk is that customers postpone projects (capex cycle) or that component shortages/delays disrupt deliveries. According to the IEA, the bottleneck is real and building grids takes a long time, which can cause “undulation” in the order and delivery cycle.
Semiconductors: AI capex may take a “breather” (budget rotation), or geopolitical restrictions may affect the supply chain. Return potential is high, but volatility can be among the portfolio’s highest.
Cyber: Competition and commoditization; parts of the security layers may turn into “bundled features” within large platforms. However, Gartner sees AI and geopolitical tensions increasing cyber priority.
Largest Single Misassumptions1. Assumption that the growth in power grid investments materializes quickly as revenue and operating profit: if permitting and labor shortages slow down “execution” more than demand, some companies may see their order books grow, but earnings will materialize with a delay.
- Assumption that AI infrastructure investments remain additive rather than substitutive: if AI infrastructure “crowds out” the budget for application licenses, some software sectors will suffer (this is part of the background fear behind the SaaS slump).
- Assumption that the geopolitical risk premium remains high: if the Iran scenario ends quickly and the risk premium unwinds, defense and energy shock hedges could lose momentum, while “risk-on” could bring higher volatility back to the forefront of growth.
What Could Go Wrong Most
The worst combined scenario for the portfolio would be:
- the energy price shock continues → inflation stays high → interest rates do not fall,
- at the same time, global growth slows down,
- and AI infrastructure investments slow down (capex pause).
In this case, both semiconductor and power infrastructure orders could normalize simultaneously, and valuation multiples would compress. The portfolio’s shock absorber is min-vol (WMMV) and a broad core (VWCE), but a drawdown would still be possible.
What Factors the Portfolio is Most Exposed To
- Continuity of the power infrastructure and data center capex cycle (GRID + Schneider + Eaton).
- Continuity of the AI infrastructure investment cycle (VVSM + Broadcom + Microsoft).
- Cybersecurity “mandatory” spend and the attack surface created by AI (L0CK + Palo Alto).
F Critical Self-Assessment
Where the Portfolio is Strongest
The portfolio is at its strongest if two structural themes hold:
- Electricity is the bottleneck (grids, connection, capacity) and the need for investment grows, as the IEA describes; in this case, power infrastructure positions will get both a revenue and operating profit engine.
- AI infrastructure continues to grow, keeping semiconductor and cloud platform earnings strong.
In addition, the cyber weighting is reasonably “defensive growth”: Gartner links 2026 cyber trends directly to AI and geopolitical tensions.
Where the Portfolio is Most Vulnerable
Vulnerability is highest if AI capex and power infrastructure capex slow down simultaneously, or if the market prices in a higher required rate of return (interest rates) for the long term. This would directly hit the portfolio’s biggest themes (power infrastructure + AI infrastructure).
What Alternative Weighting Could Be Considered If the Market Outlook Changes
If the Iran scenario calms down quickly and inflationary pressure eases (interest rates fall), the portfolio could benefit from:
- Reducing WMMV’s weight (e.g., 10% → 5%) and shifting part of the weight either to VWCE (core) or high-quality software winners (individual stock/ETF), because duration risk would ease. (Based on the idea that the interest rate environment heavily affects growth company valuations.)
If, on the other hand, the data center electricity bottleneck worsens and the need for grid investments accelerates, one could consider:
- increasing the GRID + Schneider/Eaton allocation slightly, but with caution: the same theme already makes up 21% of the portfolio and there is overlap (GRID’s holdings already include power infrastructure companies).
If SaaS fears prove to be exaggerated and “AI features” turn into a driver for pricing (rather than a disruptor), one could consider:
- increasing the weight in the high-quality cloud/software segment (e.g., by raising the MSFT weight or adding one broad, profitability-focused software ETF), while sticking to the principle of “no binary stories.”
[/details]
I chose the following all-world index as a benchmark ETF: Vanguard FTSE All-World UCITS ETF - (USD) Acc ticker XETR:VWCE
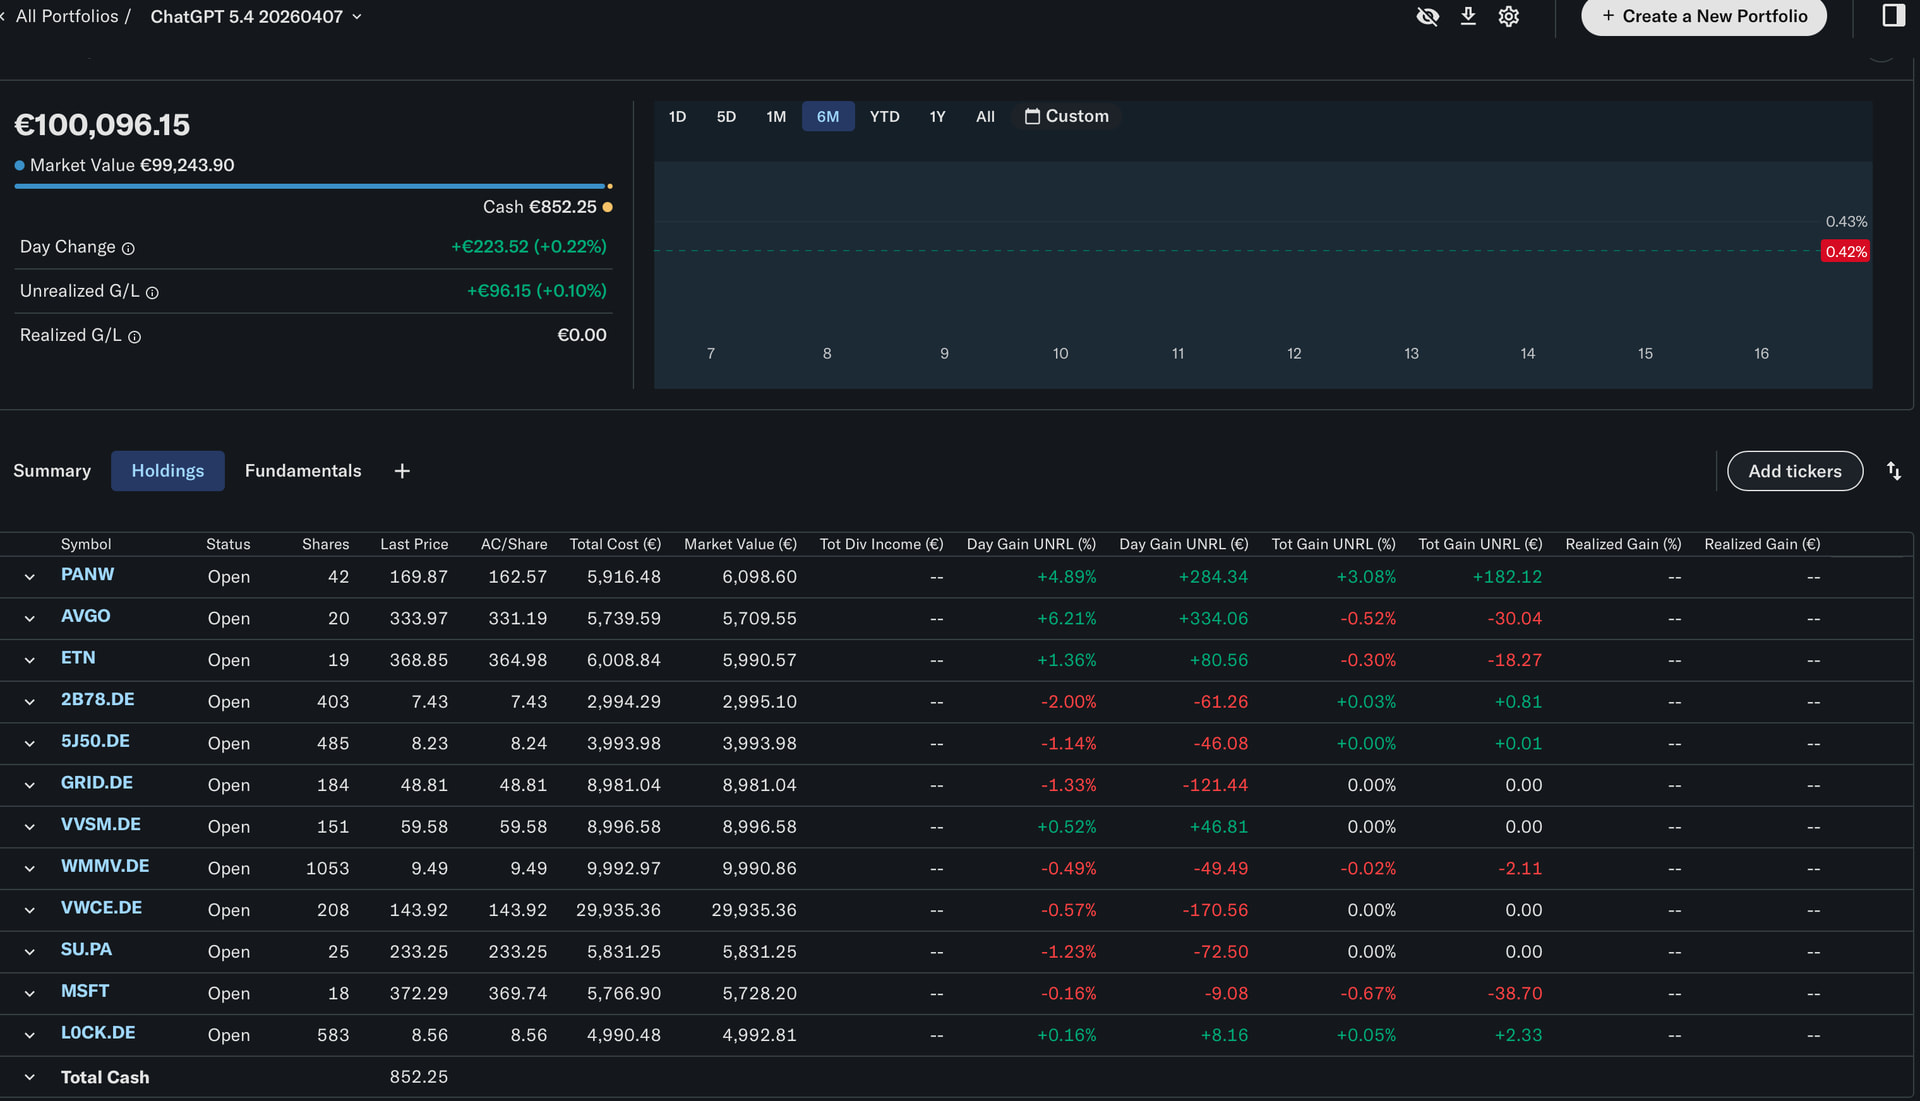
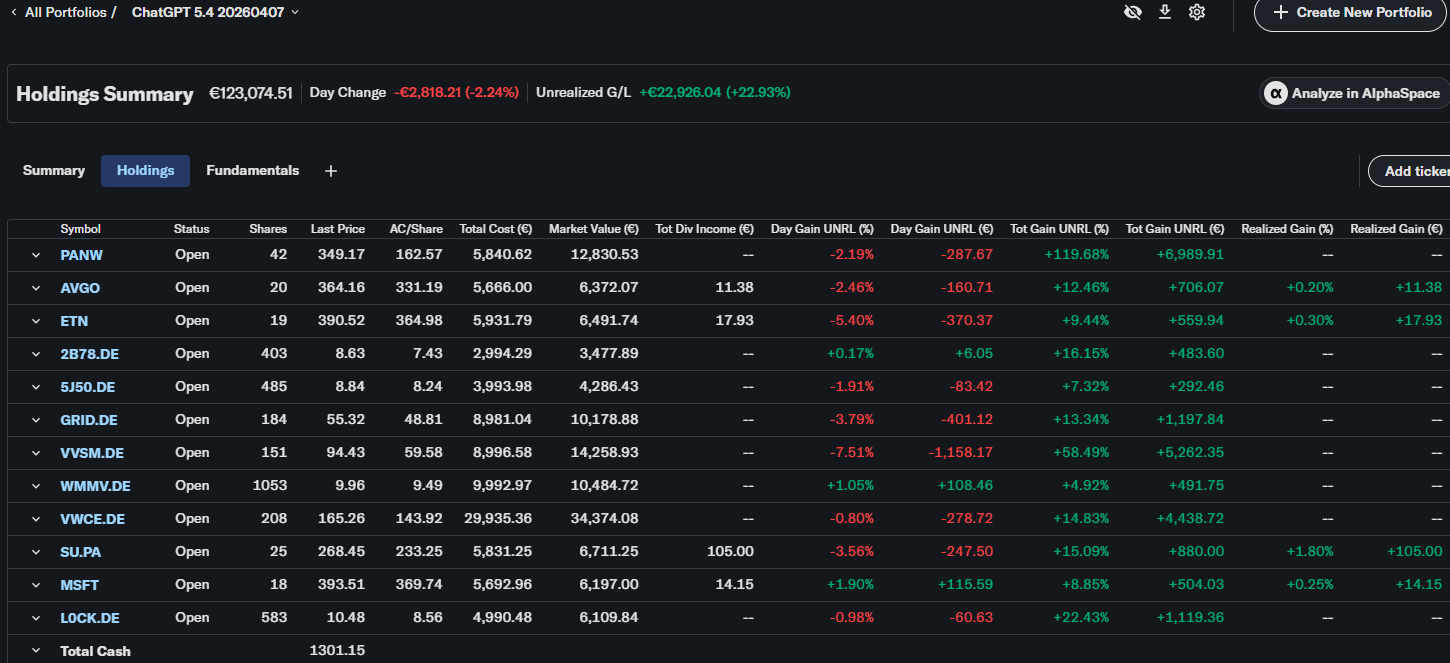
And the portfolio suggested by AI is this, in case you don’t feel like reading the whole post. I made the purchases yesterday for Yahoo’s portfolio tracker.
| Weight |
Ticker |
| 30 % |
FTSE AllWld UCITS ETF USD A (XETR:VWCE) |
| 10 % |
AmMSCIWldMinVltyAdvnUCITS ETFA (XETR:WMMV) |
| 9 % |
VESemiconductorUCITSETFUSDA (XETR:VVSM) |
| 9 % |
FTNasdaqClnEdgSGInfrUCITSETFAU (XETR:GRID) |
| 5 % |
iShs Digtl Sec UCITS ETF USD A (XETR:L0CK) |
| 4 % |
iShrsGblAerspc&DefUCITSETFUSDA (XETR:5J50) |
| 3 % |
iSh Hlthcr Innov UCITS ETF (XETR:2B78) |
| 6 % |
Schneider Electric SE (XPAR:SU) |
| 6 % |
EATON CORPORATION PUBLIC LIMITED COMPANY (XNYS:ETN) |
| 6 % |
BROADCOM INC. (XNAS:AVGO) |
| 6 % |
MICROSOFT CORPORATION (XNAS:MSFT) |
| 6 % |
PALO ALTO NETWORKS, INC. (XNAS:PANW) |
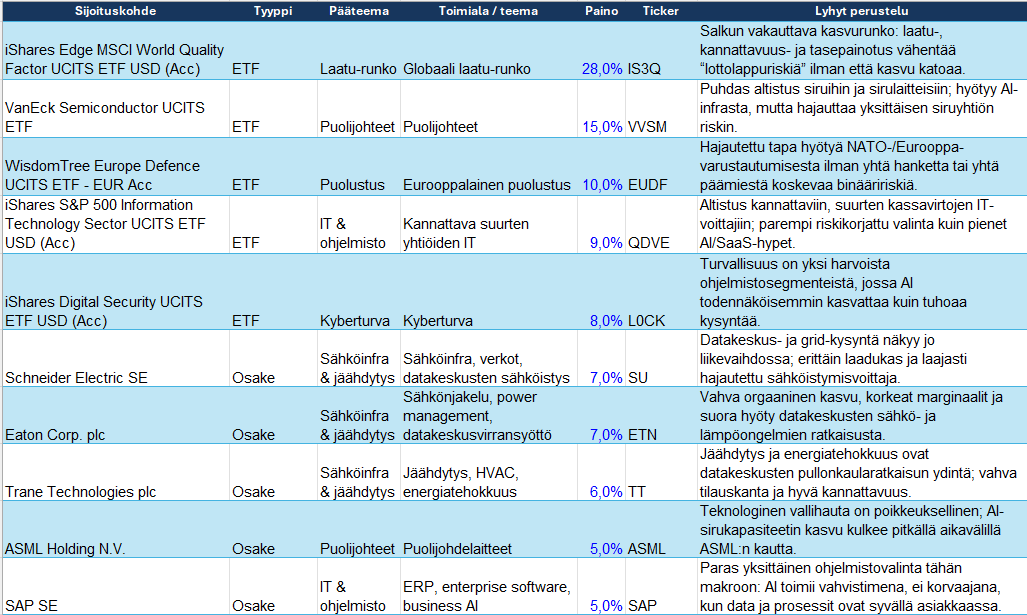
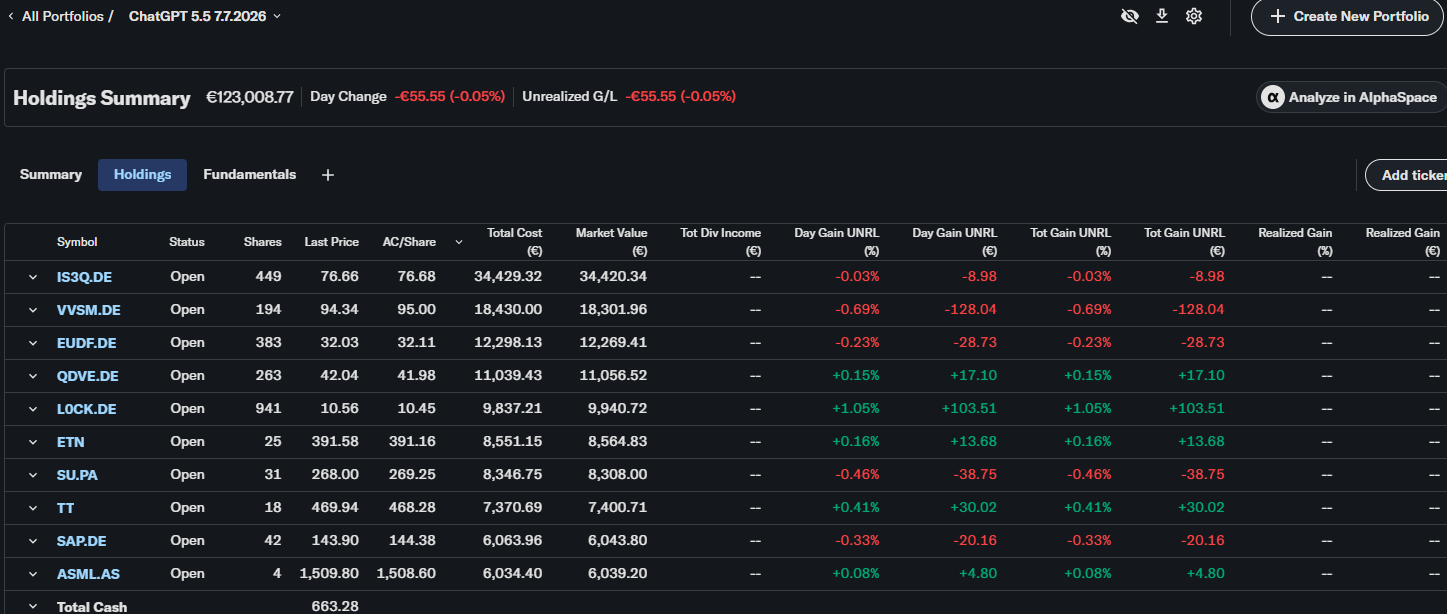
Tracking starts here. I set up a 100,000-euro portfolio to make it easier to get full shares and units. Still, I had a little cash left over. If the AI suggests changes to the portfolio later, I will update this thread. At most 4 updates per year.