Inderes Analyses (formerly Inderes's New Recommendation Policy)

image
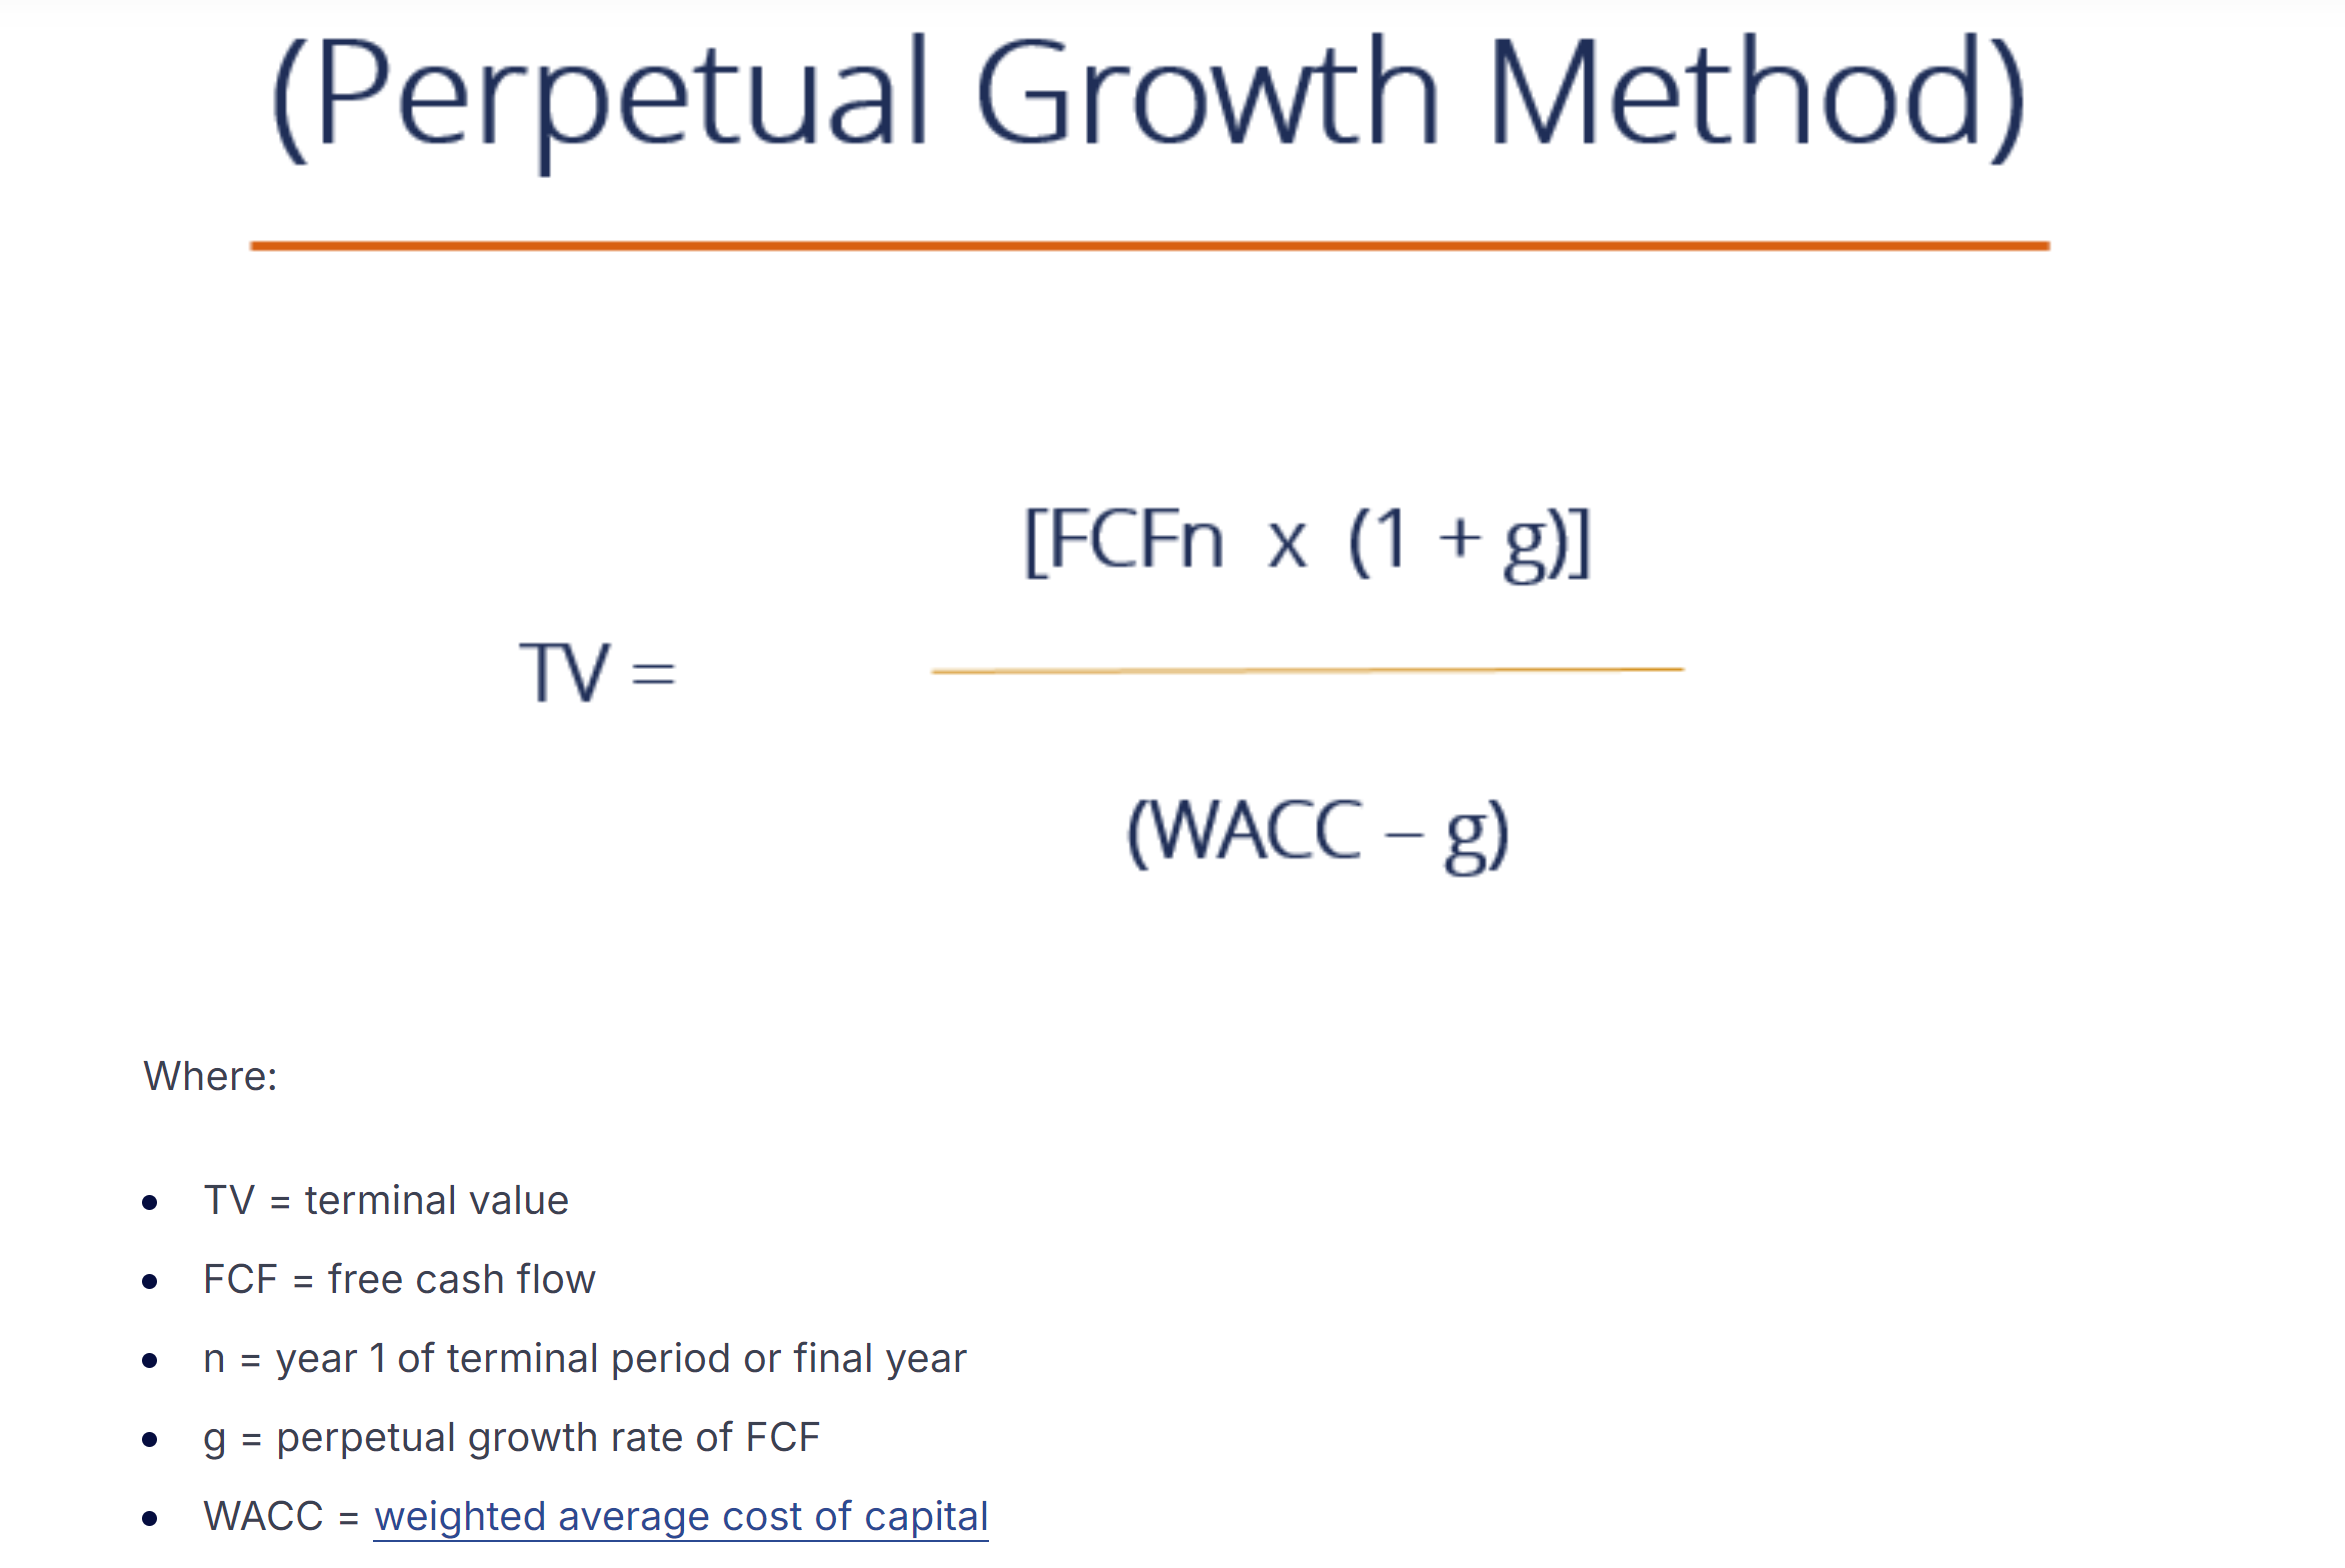
Inderes’ DCF model, like many other DCF models as I understand it, uses this so-called “perpetual growth method” (if I translated that correctly) for calculating the terminal value. In this method itself, effectively n years are discounted into the terminal value, where n approaches infinity (meaning all cash flows from years outside the forecast period are discounted to the present value). The terminal value is mathematically just a multiple of the last forecast year’s cash flow, but this can also be understood in a very simplified way such that the estimate for a single year’s discounted cash flow is some x = TERM-value/n, where n = the number of years included in the terminal period. You can vary the value of that n-variable as you wish, but the closer to infinity you go, the smaller the cash flow for a single forecast year becomes.

So, as an off-the-cuff example, if you chose n = 10, then with that value x = 10, but correspondingly with n = 20, the single-year cash flow would be x = 5. In the latter estimate, the “required” cash flow from the company in the first years of the terminal period is smaller, but the uncertainty of the forecast increases because you also have to assume a certain result from the company in year 20 (in this example, 5) :smiling_face:

I’ll conclude by saying that I simplified the concept of discounting in the terminal value quite drastically at the end here, and personally, I prefer the thinking that the terminal period contains an “infinite” number of years, all of whose cash flows are discounted to the present day using a single formula (see above). So, in practice, the cash flow of a single year itself has no greater significance to the terminal value than the fact that if cash flows are cumulatively smaller at some point in time than what has been included in the TERM-value, then the realization of the model’s value at some time t becomes even more uncertain (the possibility of which the company’s WACC should reflect somehow).

12 Likes

Nothing specific to add. @Johannes_Sippola is also right regarding the terminal growth assumption.

In my view, a few other assumptions need to be made—for example, regarding the future profitability of new sales and maintenance, as well as the net shares of the existing elevator maintenance base—before this conclusion can be drawn. As mentioned, in the terminal phase, profitability and/or return on capital should theoretically account for “perfect competition,” where no excess returns are generated. As noted, our 10-year DCF period is short for applying this in practice. Nevertheless, I believe it is worth keeping an eye on the terminal return on capital and profitability, especially for mature companies, to ensure that the differences are not absurd relative to the discount rate or historical margin performance.

5 Likes

In practice, excess returns are generated based on expertise or market position.

For example, Otis has such a strong position in some markets that it generates excess returns. This is reflected in Otis’s exceptional maintenance business profitability.

The persistence of excess returns, in turn, indicates that others are unable to break into the same position.

1 Like

This is how Inderes makes recommendations.

±15% from the target price is given as add/reduce. Above that, buy/sell.

The link in question is from 2018 and the content is outdated; the recommendation policy has since been updated to rely on risk-adjusted return/expectation. Mods might want to move messages to a better thread :slight_smile:

image

9 Likes

In Inderes’ recommendations, Duell stood out as the only company with a valuation risk of 1. (Excl. Purmo)

Is there any specific reason for Duell’s very low valuation risk?

6 Likes

Good question, and I’ll continue: What does valuation risk mean?

@Petri_Gostowski opened the topic in April 2024. I read this through a few times, and I still can’t say I understand what Inderes means by valuation risk.

Does the lowest valuation risk of 1 mean that, in the analyst’s opinion, the company’s share price is exactly right if the environment and business do not change? For Purmo, this would be understandable, as the company was delisting from the stock exchange at the time the analysis was written. But Duell?

Does valuation risk 5 mean that, in the analyst’s opinion,
a) the stock is extremely overvalued, or
b) a target price cannot be given for the stock, or
c) the stock is extremely overvalued, or
d) something else?

Edit: Thanks @Vara-Paavi, nicely phrased, and this certainly seems like an art-science setup :face_with_hand_over_mouth:

@Petri_Gostowski, could you clarify what valuation risk means?

Edit: Or would @Antti_Viljakainen like to clarify?

5 Likes

Based on Petri’s text, I interpret it as follows:

Valuation is always somewhat science and somewhat art. At the lower end of the valuation scale, we are firmly on the side of art, while at the upper end, we are already flirting with science (cash flows are easily predictable and do not involve significant variance + the cost of capital is relatively well determinable, e.g., an established industry and a large number of comparables).

6 Likes

Of course, @MoneyWalker

That valuation risk is thus formed from several variables, which can take values from 1-5, and whose average is the valuation risk figure shown in the matrix. In addition to the stock’s own valuation, these variables include, for example, the aforementioned general stock market valuation levels and how good a reference framework can be created for the valuation.

For example, in 2021, during high valuations, the market valuation would likely have been around 5, and for an early-stage company, the lack of a valuation reference framework would also increase the risk, potentially putting it at level 5. Conversely, now, for the entire stock exchange (in our opinion), we are in a phase of moderate valuation levels, which lowers the overall figure. At the same time, for a company like Elisa, there is a very clear valuation reference framework, which means this value (risk) is at the lower end, thus reducing the overall valuation risk.

Because the risk level related to an individual stock’s own valuation has a clearly higher weighting than others, it largely guides that figure. In short, 1 means the stock’s valuation risk is low, and 5 is high. However, there is no exact logic behind when one is at level 4 or 5, for example; this is the analyst’s subjective assessment.

In practice, values of 4 or 5 mean that the stock’s valuation is high, but theoretically, it could be that factors other than the stock’s own valuation receive values of 5 in the matrix, and the stock’s own valuation is 2 or 3, but still, the overall outcome for the total valuation risk is higher than a neutral level, i.e., 4 or 5.

8 Likes

Antti and Petri chatted + reflected on the past year and future development areas, especially regarding analyses. :slight_smile:

Topics:

00:00 Introduction
00:20 Helsinki’s bear market continues
01:51 Wave of profit warnings
03:50 Saving won’t get you far
05:01 Forecasting process
06:44 Year of Analysis: “Quite good”
08:10 Investors are interested in returns
10:58 Failures
17:11 Utilizing analysis
22:37 Analysts’ workload
26:50 Individual and team responsibility and coaching
29:30 Analysis and excess return
35:35 “AI Analysis”

12 Likes

I’m replying to you @Passi here, as I believe this thread is more suitable for this topic

https://keskustelut.inderes.fi/t/inderes-oyj-yhtio-kuuluu-kaikille/17104/2067?u=petri_gostowski

Your thoughts and questions were quite justified. Regarding our operating methods, I can tell you that we lead analysts regularly review forecasts and challenge analysts when we feel there is a reason to do so. Ultimately, however, the responsibility lies with individuals, i.e., the analysts following each company.

Regarding the data, that median earnings growth forecast is a bit problematic or misleading. This is because there is a large number of small companies whose earnings are predicted to rise from negative or very marginal levels. Thus, a small absolute improvement in earnings can appear as a relatively large change. From a high-level perspective, I would estimate that this is emphasized in the current market situation, with poor results in the background and at least some kind of macro turnaround predicted in the big picture. In addition to operational earnings growth, this is highlighted at the EPS level, as financing costs are presumably under downward pressure along with interest rates. It is also good to pay special attention to turnaround companies, where success must be examined not only through forecasts but also through the accuracy of recommendations, as predicting turnarounds is notoriously difficult. Due to this “structural” problem, @Juha_Kinnunen also pointed out that it is advisable to look at the predicted growth of the total earnings sum alongside the median earnings growth.

However, I am not trying to dispute the tendency towards over-optimism that we analysts have in earnings forecasts. We strive to combat this. Of course, at the same time, I think it’s important to remember that earnings grow more often than not, driven by economic growth, companies’ pursuit of growth, and the aim for continuous improvement. So, in the big picture, it’s more about the slope than the direction. Of course, the slope must hit the right ballpark, and simply estimating the direction correctly is not enough.

17 Likes

I have brought these up before, mainly in company threads, but in my opinion, that’s just an excuse. Overly optimistic turnaround results are predicted for unprofitable hot dog stands, and yet they are negatively recommended. These have been constantly in Inderes’ monitoring for years on end; a company has been unprofitable for 5 years in a row, next year it’s expected to turn profitable according to forecasts, the year after that results will improve even further, according to forecasts the company is ~PE=3 two years out, and yet the recommendation is reduce…
Then, WHEN the forecasts don’t materialize, they hide behind the fact that “we were partially right because the recommendation was reduce” :man_facepalming:

Since the chief analyst himself is commenting, let’s take a look at Inderes’ stock comparison:

image

The biggest upside potential from the share price to the target price among over a hundred companies is Boreo, but the recommendation is reduce? :man_shrugging:
If the company is doing poorly, we were right with “reduce”.
If the stock price rises, we were right as it moves towards the target price. :man_shrugging:

Time and again, in Inderes interviews and such, one also hears how overly optimistic forecasts are justified by saying that negative surprises and one-off items cannot be known in advance. That, supposedly, nothing “just in case” negative can be put into Excel.
I understand the argument, but I absolutely do not agree. Most people in their own lives know how to take a little safety margin:

  • If a person can afford it, few live paycheck to paycheck. A family’s finances are not usually budgeted so that if there are no unexpected negative expenses, the money will last until the next paycheck… The general advice is to keep, for example, a month’s salary in the bank as a safety net in case the car or freezer breaks down.
  • You don’t arrive at a job interview a second before, but you build in some slack into the schedule in case you need to stop for gas or there’s a traffic accident on the way.
  • etc. etc.
    But if two years ago the company had negative earnings surprises due to strikes, a factory fire, supply chain challenges.
    Last year there were one-off costs from change negotiations, one-off costs from reorganization, write-downs from acquisitions, unexpected investment needs at the factory, customers emptied their inventories and ordered surprisingly little.
    This year, unexpectedly, there are legal costs, they have to pay for breach of contract, their own procurement prices have risen faster than invoicing, the ERP needs to be renewed, they fall victim to fraud, and a flood destroys a warehouse in England.
    But in the future!! Not a single acquisition will fail and cause write-downs anymore! There will never be strikes, fires, accidents, change negotiations, organizational reforms again! In the future, every ERP renewal will go through on schedule and within budget! In the future, every investment will succeed on schedule and within budget! Every product development project will succeed, and there will be no more extra downtimes or maintenance costs at the factory :man_facepalming:
28 Likes

Loss-making sausage kiosks are predicted an overly optimistic turnaround in results, and yet a negative recommendation is given. These have been continuously under Inderes’s monitoring for years; the company has made losses for 5 consecutive years, next year it will turn profitable according to forecasts, the year after that results will improve further, according to forecasts the company is ~PE=3 two years out and yet the recommendation is reduce…

Yes, forecasting turnaround companies is challenging and forecast errors are certainly amplified in them. So there are certainly individual cases like these, but I don’t immediately recognize numerous examples like the ones you describe. I would also say that at some point the process has gone wrong if, with the valuation you describe, the recommendation is negative, but it would be more fruitful to look at this on a case-by-case basis, so I’d be happy to hear an example.

The biggest upside potential from the share price to the target price among over a hundred companies is Boreo, but the recommendation is reduce? :man_shrugging:
If the company is doing badly, then we were right to reduce.
If the share price rises, then we were right to move towards the target price. :man_shrugging:

I don’t recognize such cherry-picking in our communication – I believe we have consistently stated that the recommendation is what reflects our view of the risk/reward ratio. Sometimes the recommendation and target price can clearly be in conflict when we don’t see it meaningful to constantly adjust our view, but of course the analysis must generally be up-to-date. Therefore, updates are more about a frequency of a few weeks, but we don’t update every couple of weeks unless there is some significant company-specific news flow.

Time and again in Inderes interviews, etc., one also hears how overly optimistic forecasts are justified by saying that negative surprises and one-off items cannot be known in advance. That you supposedly can’t put anything negative “just in case” into Excel.
I understand the argument, but I absolutely do not agree. Most people in their own lives know how to take a little safety margin:

I wouldn’t say that they can’t be known in advance, but I do agree that forecasting them is difficult because it’s not as straightforward as, for example, forecasting the growth of production costs alongside sales volume growth. Some kind of cost inflation is always forecast, but estimating the scale is difficult. In this context, it should also be noted that if one tried to be constantly cautious in forecasts, it would likely lead to greater pessimism in views, as valuation levels would be higher with lower results. So I don’t see baking some kind of safety margin into all forecasts as a solution to this challenge. Thinking about it quickly, I also believe that since company results collectively grow in the long run, it’s better to be slightly too optimistic and forward-leaning than to be more pessimistic and always late. Of course, in an optimal situation, we would always be as accurate as possible in forecasts (and thus in views). That is certainly the goal, but it’s not realistic to expect that when forecasting.

11 Likes

I’m quoting @Antti_Siltanen’s post from another thread, and at the same time, I tip my hat to him for openly sharing the track record of the recommendations’ accuracy – absolutely fantastic :heart:

But:

Similar approaches could be implemented much, and I mean really much, more in Inderes’s communication. For example, I could give direct feedback to @Petri_Gostowski regarding the latest Inderes analysis “How Did It Go” video: if/when you have access, for example, via Bloomberg, to the accuracy of individual analysts’ recommendations at the company level, I would bet that you also have some numerical understanding of how well the recommendations have hit during year X. In the name of transparency, I think opening these up at least once a year in video format would be really good. You surely understand this analogy yourself: for analysts, it is sometimes (not always, but sometimes) frankly a pain in the ass to try to analyze what a company means, for example, when they say that “revenue will grow significantly.” So what does “significantly” mean then? Of course, there’s probably a good guess about this, but the analyst’s estimate of, for example, realized revenue is likely based on something completely different than that “vague” adjective in the guidance :smile_cat:

Well, the same applies to that last video. When you say that “it went pretty well”, what exactly does “pretty well” mean? Now we have to guess. Or what does it mean that the so-called long-side recommendations performed worse than the so-called short-side recommendations? In my perception, Inderes has always been the “analysis factory” that isn’t afraid to put precise realized figures on the table, and I think the same should apply especially here. Because quite frankly, we are all here to generate excess returns, and we need other data points than just the returns of our own portfolios (if following Inderes’s recommendations) to evaluate that :hugs:

I’m tagging the other lead analyst @Antti_Viljakainen here too, even though I don’t have very precise suggestions on what kind of reviews or similar these figures could be incorporated into. Other than, of course, encouraging all analysts to publish them occasionally in messages in the threads :heart:

Edit:

In my opinion, publishing these figures more precisely from time to time would also somewhat limit speculation about how accurate Inderes’s analysis really is, even nowadays. Or at least it would guide the discussion in a genuinely more constructive direction.

Edit 2:

For example, the 2018 and 2019 “annual reports” contain analysis of the accuracy of recommendations that goes somewhat in the right direction, although even there, no precise numerical values have been given for the accuracy of the recommendations (numerical values have been given for how many “excellent” / “catastrophic” or similar recommendations there have been, but what “excellent” or “catastrophe” means is not quantified).

34 Likes

If some kind of reliability index were developed (which probably won’t happen), it should also make visible what kind of companies an analyst’s recommendations concern. The recommendations of an Inderes analyst analyzing Nokia have little to no effect on the share price, but the views of an analyst analyzing small Finnish companies can significantly move thinly traded stocks. If a significant portion of owners follow a company through Inderes, the forecasts partly fulfill themselves, and lo and behold, the forecast accuracy is good. Is it really?

Furthermore, talking about excess returns can ultimately only concern a portion of investors, because if everyone blindly follows a buy/sell recommendation, not many in thinly traded stocks will have time to enjoy the benefit of the recommendation before the price collapses or skyrockets. Especially not those who have a bit more “exposure” to a certain company. Dynamic effects must also be taken into account, and not just theoretically looking at the price curve afterwards.

13 Likes

The Goal of Investing is Return

  1. If the goal of investing is to outperform market returns, a key concept is the margin of safety. The margin of safety refers to the difference between a company’s price and its value. If one succeeds in buying at a price that is 50% below its value, then the investor’s expected return will exceed the market return.

  2. The price is known. In investing, the biggest challenge is to determine the company’s value through company analysis. Factors influencing a company’s value include, among others, the company’s revenue growth and profitability development.

  3. The analysis identifies factors affecting revenue and profitability and presents a reasoned view on why revenue and profitability will develop in a certain way. The valuation multiple is also part of the valuation. As is the probability of better or worse development than presented.

  4. The reader of the analysis can assess whether the analysis corresponds to their own understanding or complements their own thinking. And based on this, decide whether to invest or not.

5 Likes

@Vino_Pino I’ll continue the discussion on this topic based on your excellent additions:

  1. I agree with the first paragraph. In my opinion, this is fundamentally about how deep an analysis of the accuracy of recommendations one wants to make. In my opinion, some kind of weighting factor should be devised, especially for small companies vs. large caps, precisely because of the liquidity problem you mentioned. Or simply state somehow that “this year, xx% of long-side recommendations succeeded in generating excess returns, of which the share in small-caps/mid-caps/large-caps was yy%).” From this, each investor can draw conclusions about how well it has actually been possible to achieve that excess return.
  2. Regarding the second paragraph, I agree with that too, but those dynamic effects partly underscore the point you mentioned in your first paragraph about the differences in companies’ (liquidity). We are inevitably relying on theoretical knowledge, because, for example, quantifying the magnitude of the “Inderes effect” into numbers is at least challenging in the overall picture (partly because such an enormous number of recommendations are given annually, and on the other hand, it’s even more difficult to interpret how much of, for example, the share price increase/decrease on the report publication day is directly due to the Inderes effect).
9 Likes

Good point! Blomma does have a history of returns per analyst.

This year, we have also started to calculate the accuracy of our recommendations from our ~15-year tracking history from the perspective of realized returns. We cannot yet promise a timeline for their publication, but it is in progress :+1:

23 Likes

Quite valid points @Johannes_Sippola, we’ll look into this matter more closely, in addition to Antti’s point, once we get a moment from the earnings season rush.

9 Likes

I’m a complete beginner with analyses and key figures, so I have to ask what’s the deal with Tecnotree’s 2026E share count almost doubling?
I was looking at a list of low P/E ratios and noticed that Tecnotree has a forecast of P/E growth, meaning a strong decrease in EPS.

IMG_1192