Morning. Yes, I completely agree. This was done in the model this way for some reason earlier, but it will be corrected soon.
2 Likes
In the mobile version, company stock charts have been updated, and stock performance can now be compared to OMX Helsinki and Stockholm.
A point of interest here is that the comparison index is the “GI” (Gross Income), which accounts for dividends. Perhaps it would be better to compare against a price index?
Another idea related to this would be to also include a total return graph for the stock, which accounts for dividends. In that case, comparison to an index that includes dividends would be adequate.
4 Likes
Different investors look at different key figures. A ready-made, selected set of key figures does not satisfy the needs of very many people as such, and supplementary information has to be found from several sources.
If the use of premium is to be increased, the best selling point would be if everyone could build their own review framework, e.g., from a selection of 20 key figures.
2 Likes
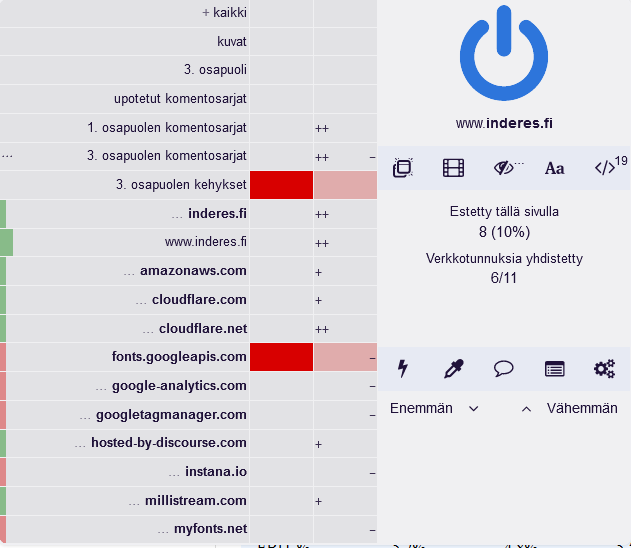
This page and other article-type pages do not scroll down at all. The problem started a few days ago. The problem occurs when logged out, it works when logged in. Blocking Javascript solves the problem, so what’s the problem here?
Firefox 101.0.1 (64-bit)
Blocks:
Thank you, Antti, for your response.
Yeah, it sounds like Inderes’ current table format is a bit “ancient” when an analyst wants to open up their forecasts at a more detailed segment level, for example, in the form of numbers.
For example: In its quarterly reports, UPM also presents delivery volumes for some segments, e.g., UPM Fibres Q122: Deliveries, pulp: 461 t tons. I can imagine that a professional analyst starts segment-specific forecasting by estimating the segment’s future delivery volumes (perhaps by pulp type and taking into account shutdowns) and so on. In simple terms, the analyst probably first aims to estimate the segment’s revenue (volume x average selling price) quarterly and annually, likely with a certain principle of caution. Then, the segment’s costs by cost type, etc. & etc.
What I’m trying to explain is that I really hope Inderes can present its forecasts in company reports segment by segment in much the same way and with the same content as the company itself presents the realized figures.
I can imagine that both Inderes’ corporate clients and investor clients would be very pleased with the method of presenting segment-level forecasts I described above. This idea related to the presentation method also applies to other companies.
Now, if we have notionally defined an “ideal” presentation method, the question arises: does Inderes’ current table format lend itself to it?
@Mikael_Rautanen is also welcome to participate in answering my question.
Greatly appreciating the analyst community,
R-o-E
3 Likes
You’re welcome, and happy Midsummer!
That’s how it works, and naturally, changes to these are commented on and explained in the text of the analyses. However, we have not, as a rule, opened up all the parameters behind the forecasts, at least not yet.
Honestly, probably not, because companies report differently, and our tables come into PowerPoint from a single Excel template that is the same for all companies (of course, for modeling, the analyst builds their own forecast model tailored to the company’s needs, but data from that custom forecast model doesn’t move to PowerPoint with the current model). Modifying this to take into account company-specific needs is not a simple task, and I can’t promise quick changes to this. Of course, we will do our best to make the presentation method as good as possible in the long run.
4 Likes
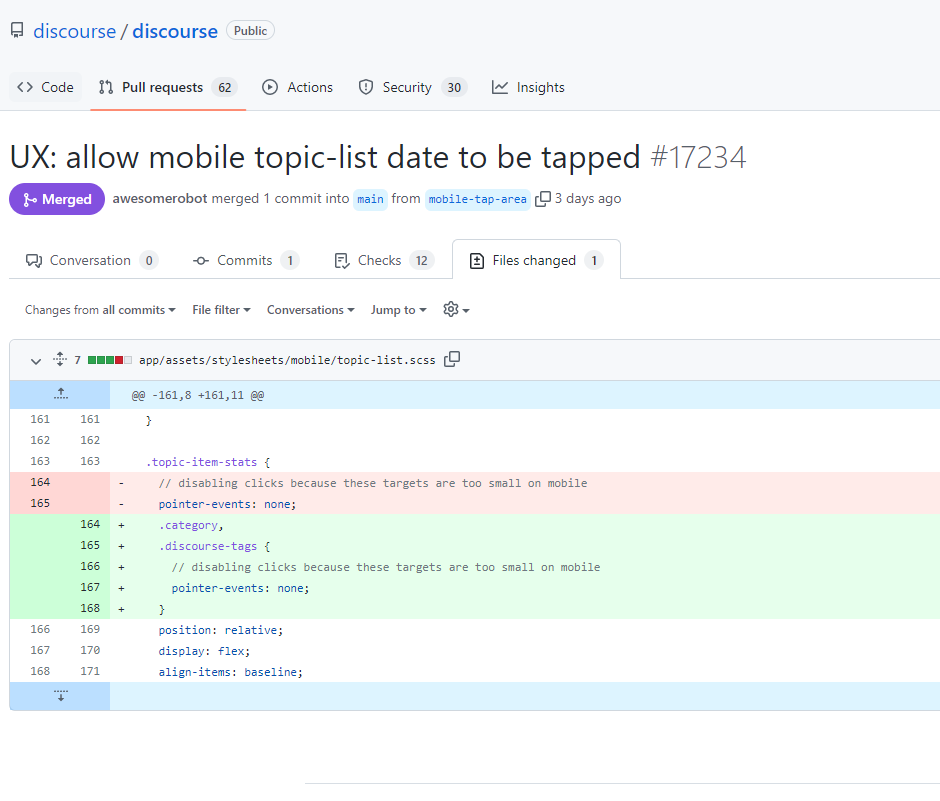
Would it be possible for registered users to add bookmarks to InderesTV videos?
Sometimes, for various reasons, interesting videos go unwatched, and it’s hard to remember to go back and watch them later when there’s time, even if it was intended. So, if videos could be “marked” in some way, more videos would get watched later with better time, as the marked videos would be conveniently found in one place (e.g., “Saved videos” in one’s profile or a separate sub-menu under InderesTV).

12 Likes
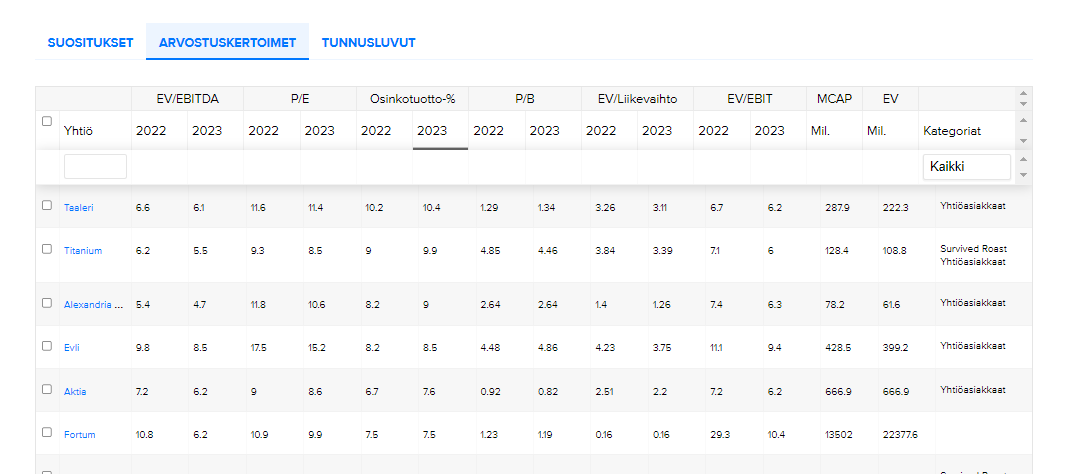
Hi! I think I’ve sent a message about this before, but are there improvements coming to the Stock Comparison page?
The most annoying thing about the page is that the desired order doesn’t persist when moving from one tab to another. If you sort companies, for example, by descending 2023 estimated dividend yield percentage and then want to check recommendations or ROE percentages from key figures, the companies revert to alphabetical order.
Of course, exporting to Excel helps with this, but it would be really great to get it to work in the browser as well 
4 Likes
Hi @TomiP, that feature isn’t available for InderesTV, but you can add bookmarks in the Inderes mobile app. This doesn’t fully solve your browser needs, but it’s a quick way to save clips for later in one place.

3 Likes
Adding it to the To-Do list. That’s actually pretty easy to do!
6 Likes
Let’s add this to the list too, there’s another change coming to the stock comparison
5 Likes
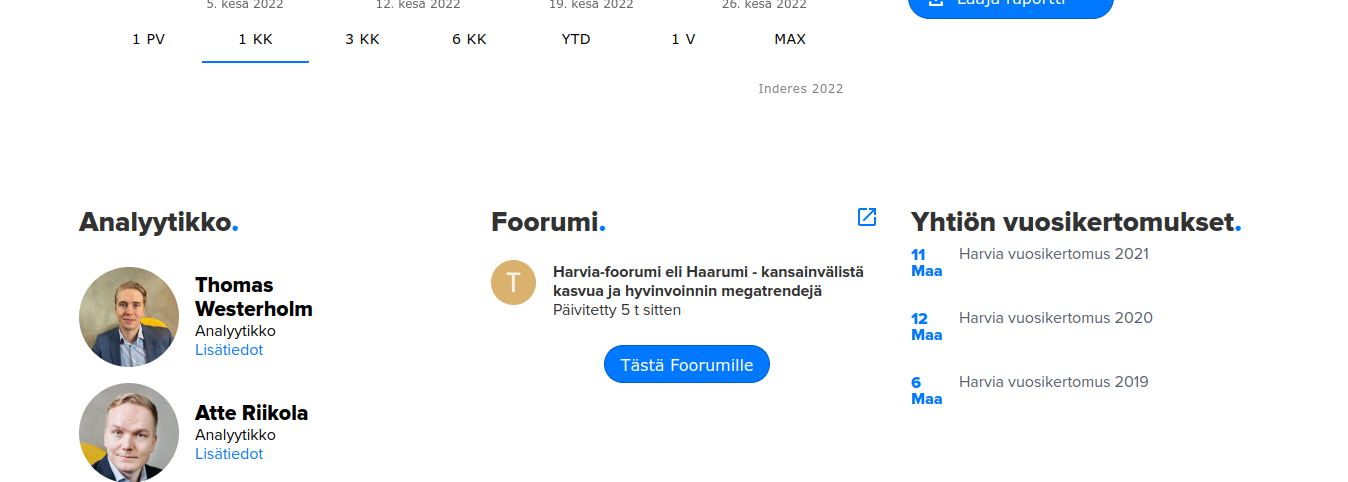
@Yu_Gong, is there a specific reason why the 2021 annual reports have not been updated on the company pages?
At a quick glance (3/3), these are missing from, for example, Harvia, Kamux, and QT, even though the companies have published them on their own investor pages during the spring.
For example, Harvia

5 Likes
We update those manually Our Miika is actually doing it right now
4 Likes

Is it possible to get the morning reviews read aloud somehow?
6 Likes
@Miikka_Laitila @Kaisa_Vanha-Perttula @Emma_Kuusinen @AaroV
This could be for you, were you thinking about this the other day?
5 Likes
“The production of this Morning Review in audio format has indeed been considered. There are some challenges associated with it, which is why at least immediately, this format for the Morning Review is not happening. In the future, the situation may of course be different, and considering an audio format for the Morning Review in the future is certainly appropriate :)”
13 Likes
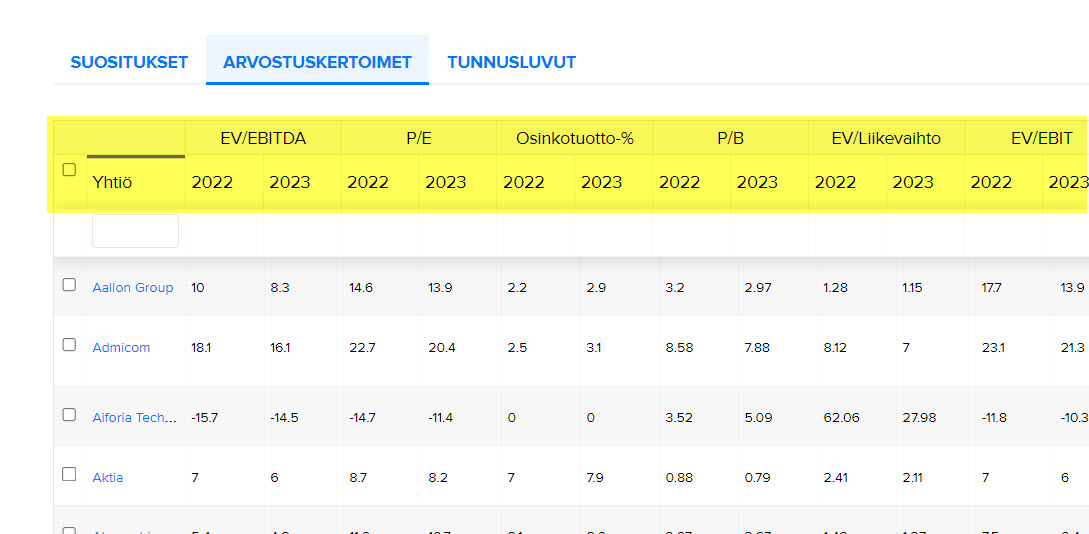
This may have been discussed before, but the problem still exists: the usability of the key figures in the company comparison table would be much better if the column headers (in yellow in the image) remained visible to the user at all times, i.e., when scrolling - don’t you think?
7 Likes

Why is it now possible to “zoom out” of this?
It wasn’t possible before, and I don’t necessarily want it to be now. 
(When scrolling down, that blue area annoyingly starts pushing in from the right.)
This is about the morning overview via email.
3 Likes