A few questions arose regarding them (we are talking about flexible packaging):
p 12: ‘‘Estimated 2024-29 growth CAGR’’ is globally closer to 5% according to the image. However, the company’s flex sales decreased by 2% in H2. Did they lose a significant amount of market share, or did the entire market decline proportionally?
p 12: the map shows 18 manufacturing sites. On the previous page, it is stated that there are 22 sites. Where are the missing 4? Is it true that there are no factories in North America, even though nearly half of the market is there?
p 18: In India, one of the challenges is strong competition, and it is further stated: ‘‘India: footprint optimized, build relations to local accounts,strengthen export sales’’
So, has production there already been optimized, when there appear to be as many as 7 sites?
Overall, the adjusted operating profit margin for flex was clearly the weakest among the segments, even though improvement has occurred. Profitability is already quite close to the target, but there is still a loooong way to go to reach the 6-7% growth target. How will these India and Turkey ‘‘turn around’’ teams achieve growth, is the intention to increase exports from these factories?
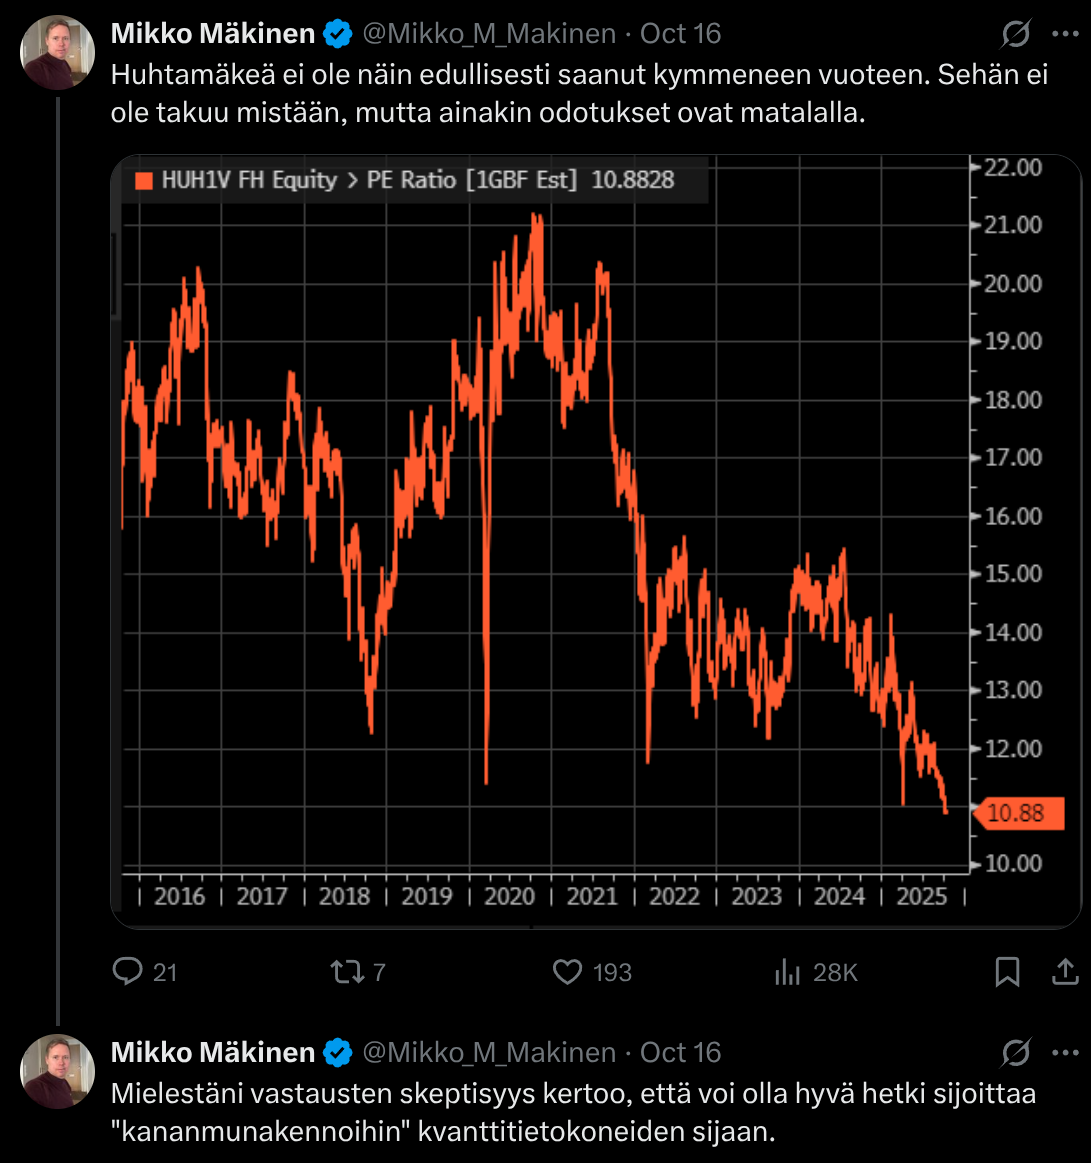
It was a positive signal, perhaps agreed with the board, hopefully we’ll see more. But overall, this doesn’t look good in terms of insider purchases, as the stock price is lagging near 10-year lows.
The additions by the management team, with the exception of the CEO, all appear to be receipts of share-based awards. I haven’t researched the history, but it’s possible previous holdings also came from share-based awards.
For the board, the situation is quite dismal, even though a couple of small purchases have been made. The entire 9-member board collectively holds a meager 16,000 shares. A bureaucratic board that doesn’t want to put its own skin in the game even at these prices?
For comparison, from UPM’s website: ‘‘Board members are encouraged to long-term ownership of the company’s shares, and most members do hold a significant number of shares, which indicates that the interests of the board members are aligned with those of the shareholders.’’
Very good comment. In most Finnish companies, the board’s and management’s shareholdings are negligible. It’s no wonder why Huhtamäki’s performance is what it is. If top management and the board are unwilling to put their own money into play to a significant extent, they should look for other jobs.
Wahlroos is no longer on UPM’s board and has reportedly sold a large portion of his shares in UPM already in the spring. Euroclear would show the remaining ownership, but I understood that Nalle consciously wanted to remain a so-called retired background influencer.
Regarding market growth, this is a consulting company’s forecast for market growth, not the actual realization. Furthermore, it describes the entire flexible packaging market of over 90 billion euros, of which the products/technologies we operate in cover about one-third. The market has remained weak in the early part of the year.
We do not have production in North America. In our factory network, for example, in Cairo and Thailand, there are two factories quite close to each other in both locations, and similar situations can be found in India. In India, we have merged production facilities, and we are continuously analyzing our entire network.
The main focus for the entire segment has been on turning profitability around. This has progressed well, although there is still work to be done. It is true that we also need to turn this segment to growth, as it would also support profitability development. This indeed applies to the entire segment, including India and Turkey.
Huhtamäki’s figures have indeed developed in the right direction year after year, and the share price is actually at the same level today as it was 10 years ago. Return on capital figures have slightly weakened, but on the other hand, the valuation has come down significantly. It is a very international company, where economies of scale and ESG matters certainly have increasing importance. In my opinion, Huhtamäki is well-positioned in this regard and has very local production close to customers. And it must be mentioned that Huhtamäki seems to have increased its dividend for, I believe, 15 or 16 consecutive years, so let’s
Their analysis seemed to focus more on an assumed lack of market (end-user) demand, which, according to their interpretation, has been indicated by some competitors’ subdued comments.
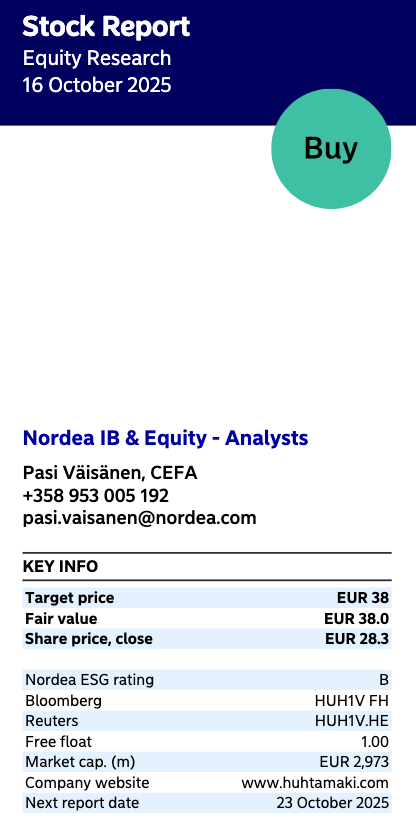
How long has OP had that Buy recommendation? I mean, the number of Huhtamäki shares in their own funds was 1.8 million at the end of January, and by the end of September, holdings had decreased to less than a million shares. They recommend buying, but they themselves are dumping shares aggressively.
Well, fortunately, the biggest seller, the OP-Suomi fund, didn’t have 240,000 shares left in September; soon it will run out of things to sell if it continues at the same pace. In January, it had 855,000 shares.
S-Bank’s Varis has already dug up some figures from India. Kristian from communications there clarifies for clarity that India, but to me, this was very peculiar information that India reports something in advance.
Well, the good thing is that profitability looks good.
Huhtamäki India Limited is indeed its own listed company manufacturing flexible packaging and labels, and is listed on the Mumbai stock exchange. Its market value is currently approx. €195 million and Huhtamäki’s ownership share is 67.7%.
Here is the HIL Q3 earnings report from the day before yesterday:
Here is also last year’s annual report:
In India, according to Huhtamäki’s annual report, in addition to HIL, there is also Huhtamäki’s wholly-owned subsidiary Huhtamaki Foodservice Packaging India Private Limited, which appears to manufacture fiber packaging.
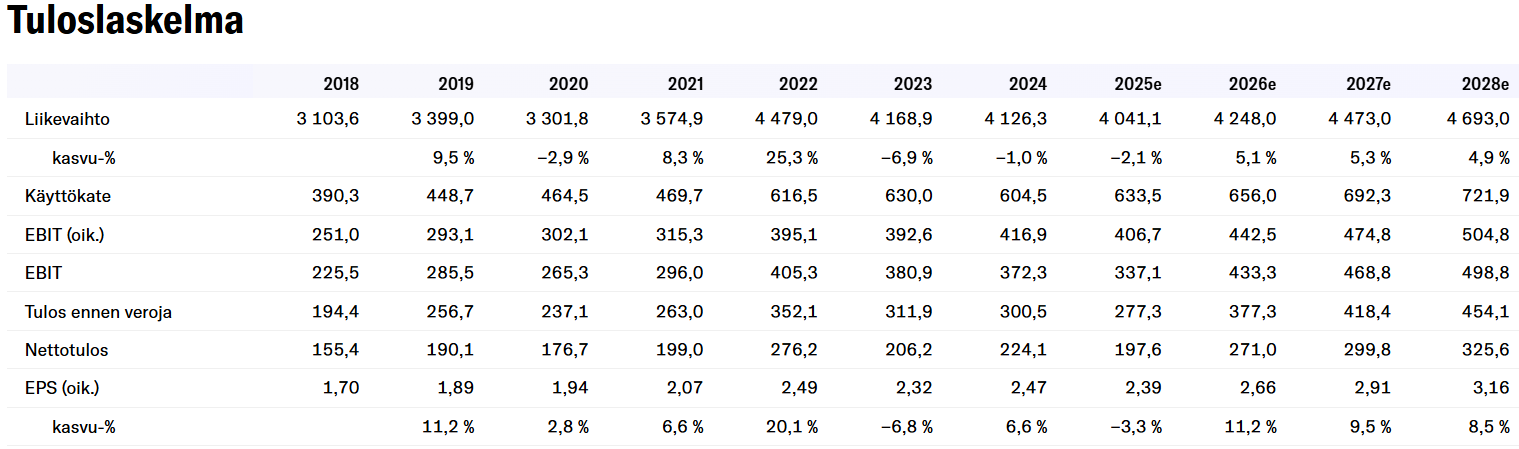
Huhtamaki’s Q3 is out, so we are once again free to discuss the company! The quarter largely unfolded as we discussed after Q2. The demand situation has not improved, and the entire industry faces headwinds. In addition, currencies, especially the USD, had a significant negative impact on both net sales (EUR 44m) and operating profit (EUR 4m). Considering this, our comparable net sales decreased by 1%. Adjusted operating profit decreased by 2%; without the currency impact, growth would have been 2%. We reduced investments and free cash flow improved, and these are part of our new CEO’s focus on more disciplined capital allocation.
Comparable operating profit strengthened in all segments except North America. Fiber Packaging continued its strong growth and profitability improved, albeit compared to a low base period last year. Flexible Packaging significantly improved its profitability, though partly supported by lower raw material prices. In any case, the segment has significantly improved its profitability from the low point of a couple of years ago. Foodservice Packaging succeeded in protecting its profitability, and the comparable net sales trend also showed small signs of improvement. For North America, the challenge lies in lower sales prices and increased costs. Costs are increased, for example, by the start-up phases of two new factories.
Overall, the quarter unfolded in much the same way as the entire year; growing net sales is challenging in a difficult market situation, but we have successfully improved our profitability and tightened capital allocation.
Thanks @Kristian_Tammela for sharing and commenting, I’ll open these result sheets here as well, because we forum members are such comfort-loving people and don’t want to operate with tabs
Q3 2025 in brief
Revenue decreased by 5% to EUR 970.6 million (EUR 1,026.2 million)
Comparable revenue growth at group level was -1%
Reported operating profit EUR 91.6 million (EUR 95.1 million); adjusted operating profit was EUR 100.3 million, including an unfavorable exchange rate impact of EUR 4 million (EUR 102.4 million)
Reported earnings per share EUR 0.56 (EUR 0.57); adjusted earnings per share was EUR 0.62 (EUR 0.63)
The impact of exchange rate fluctuations on the Group’s revenue was -EUR 44 million and on operating profit -EUR 4 million
Q1-Q3 2025 in brief
Revenue decreased by 3% to EUR 2,979.6 million (EUR 3,067.6 million)
Comparable revenue growth at group level was -1%
Reported operating profit EUR 231.5 million (EUR 277.3 million); adjusted operating profit was EUR 301.8 million, including an unfavorable exchange rate impact of EUR 5 million (EUR 306.7 million)
Reported earnings per share EUR 1.30 (EUR 1.53); adjusted earnings per share was EUR 1.83 (EUR 1.80)
The impact of exchange rate fluctuations on the Group’s revenue was -EUR 66 million and on operating profit -EUR 5 million
Investments were EUR 109.7 million (EUR 134.1 million)
Free cash flow was EUR 136.9 million (EUR 160.2 million)