Vuoden kasvuksi jäi AOT:n puolella 12,3% ja yrityksen AOT:lla 12,1%. OST 10,9%. Toissavuoden yli 30%:n tuotoista jäätiin pahasti. Sijoittaminen näyttää silti kannattavan🙂. Indekseiltä otettiin pataan inhottavasti, mutta kuuluisan foorumistin sanoja mukaillen kivasta harrastuksesta voi vähän maksaakin. Hienoja tuottoja ja upeita salkkuja. Hattu pois päästä varsinkin Kainalniemen sankareiden kohdalla, loistavaa suorittamista👏
13 tykkäystä
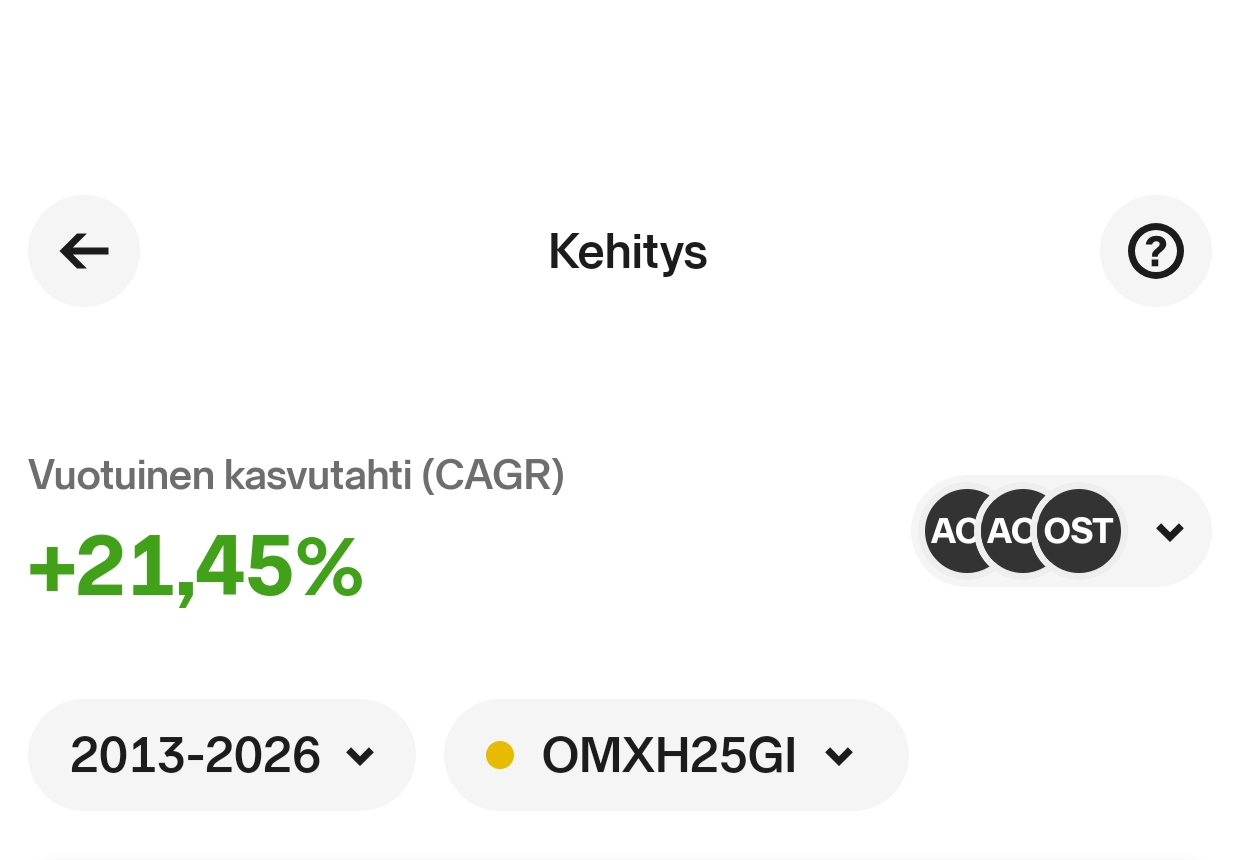
13 vuoden CAGR 5,72% tuntuu huonolle, mutta toisaalta asioihin nyt ainakin mahtuu kaikenlaisia vuosia
16 tykkäystä
Sen verran ok 12kk pätkä, että postataan nyt kuva vielä, kun ei tiedä, että pystyykö enää koskaan.
Myös menettelevä CAGR.
36 tykkäystä
Tällaista täällä. Ehkä hivenen kehnolla hajautuksella menty mutta kaippa tuossa aika moni indeksi on taakse jäänyt.
34 tykkäystä
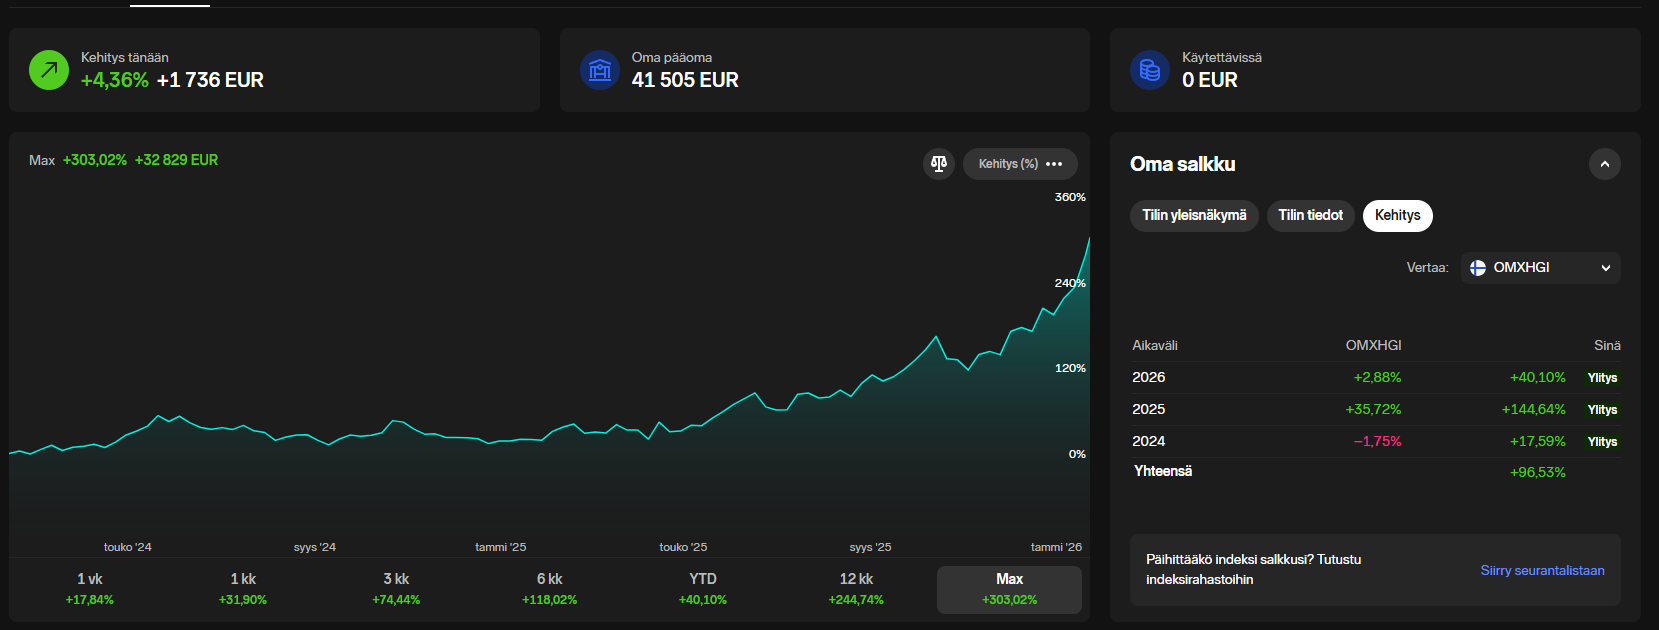
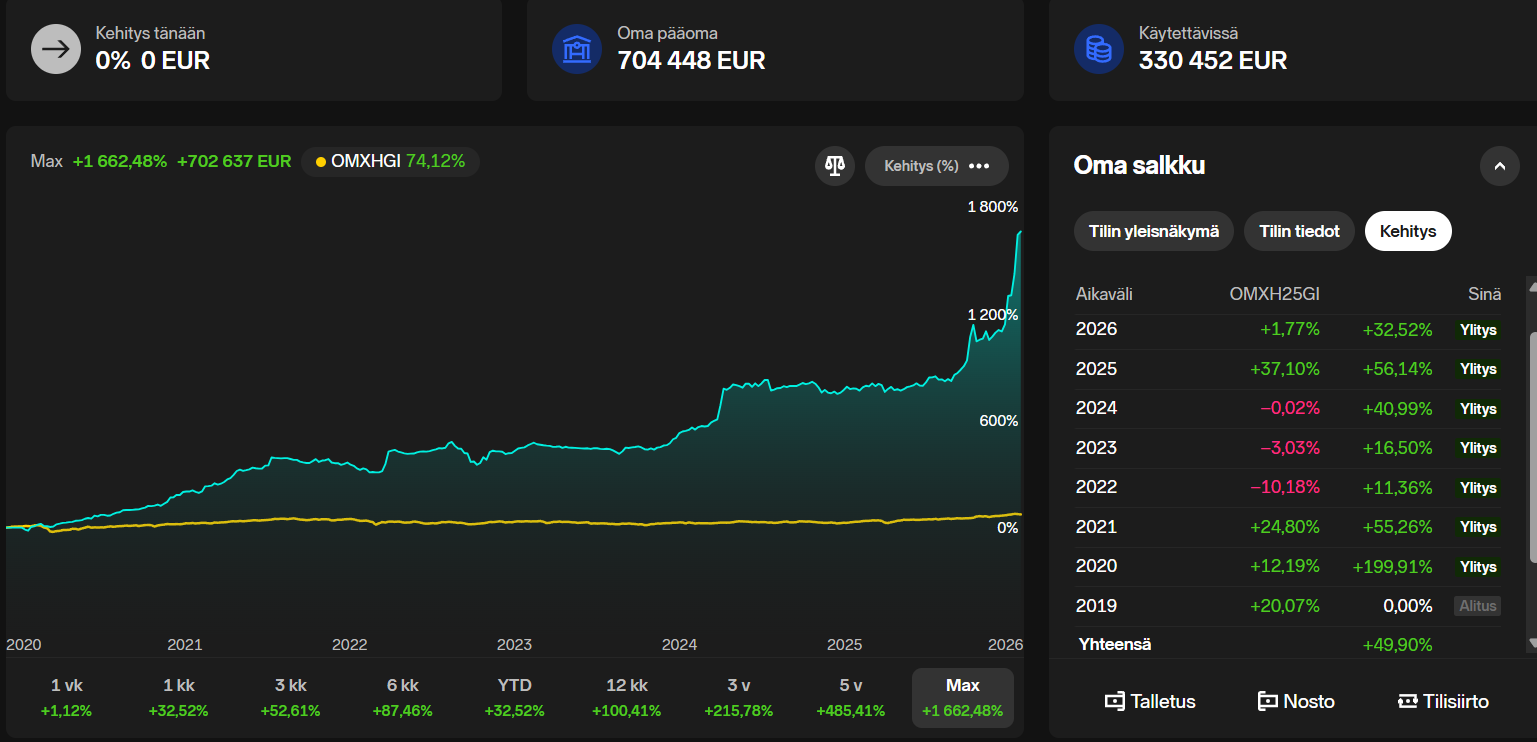
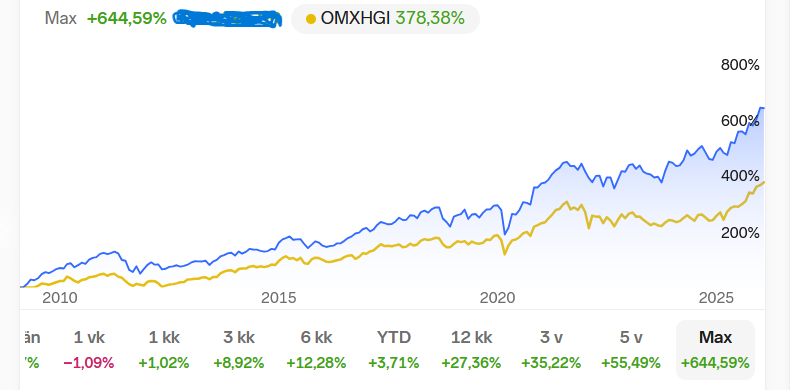
Alla näette oppimiskäyräni. Tänään YTD:ssä OMXHGI meni mun ohi, mutta kuten jotkut viisaat sanovat, niin kannattaa katsoa pidemmän aikavälin tuottoja:
30 tykkäystä
Suhteellisen tuoreena foorumilaisena olisi mielenkiintoista tietää, mihin sudenkuoppaan (kuoppiin?) alokas astui herran vuonna 2022, kun tuo ero indeksiin näyttää revenneen? ![]()
2 tykkäystä
Tällaiset osakkeet mulla oli 2021 elokuussa ja näillä mentiin eteenpäin ![]()
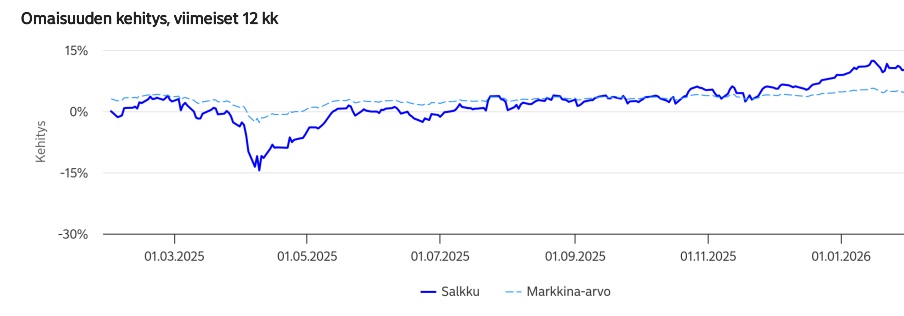
Ei viimeiset 12 kuukauttakaan ole kyllä kovin hyvin mennyt ![]()
16 tykkäystä
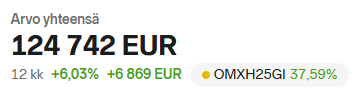
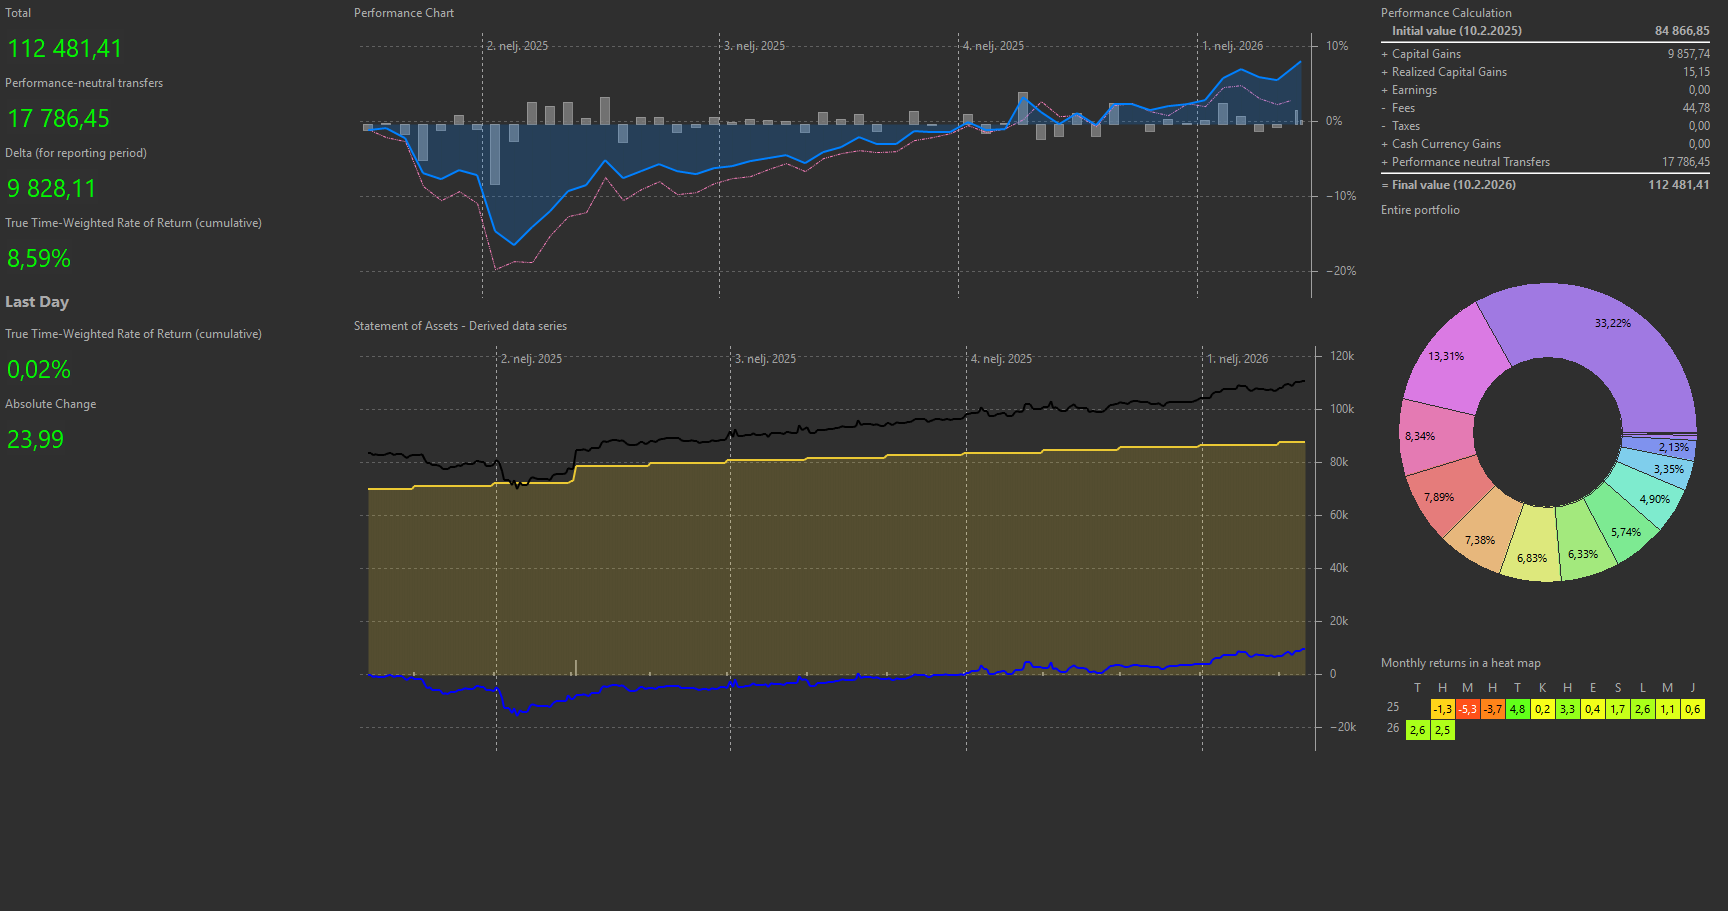
Tämän vuoden YTD luvut, eli tammikuun luvut 2026. Noin 9% kokonaistuotto ja n. 5% tuottoa salkun pääomasta. Miten tuon nyt ilmaisee, kaupanteon tulos siis.
2 tykkäystä
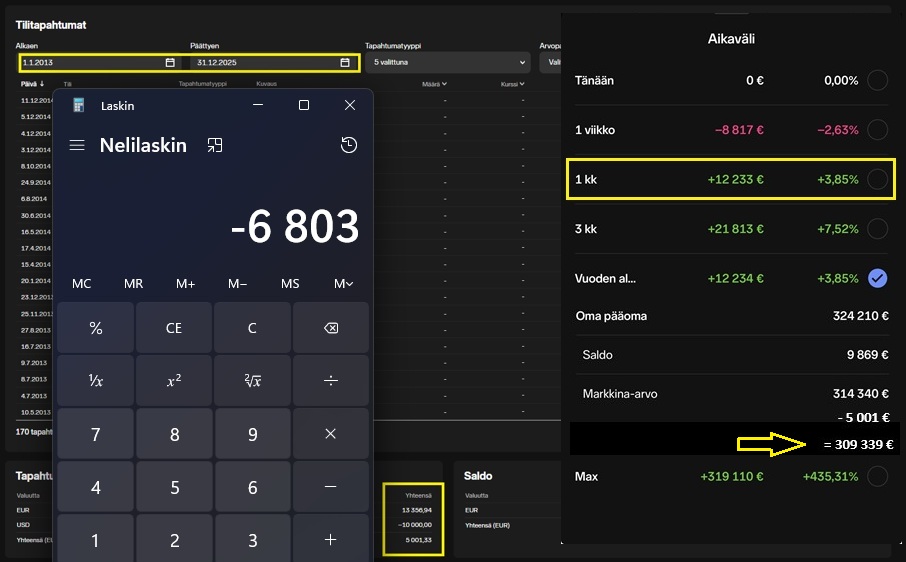
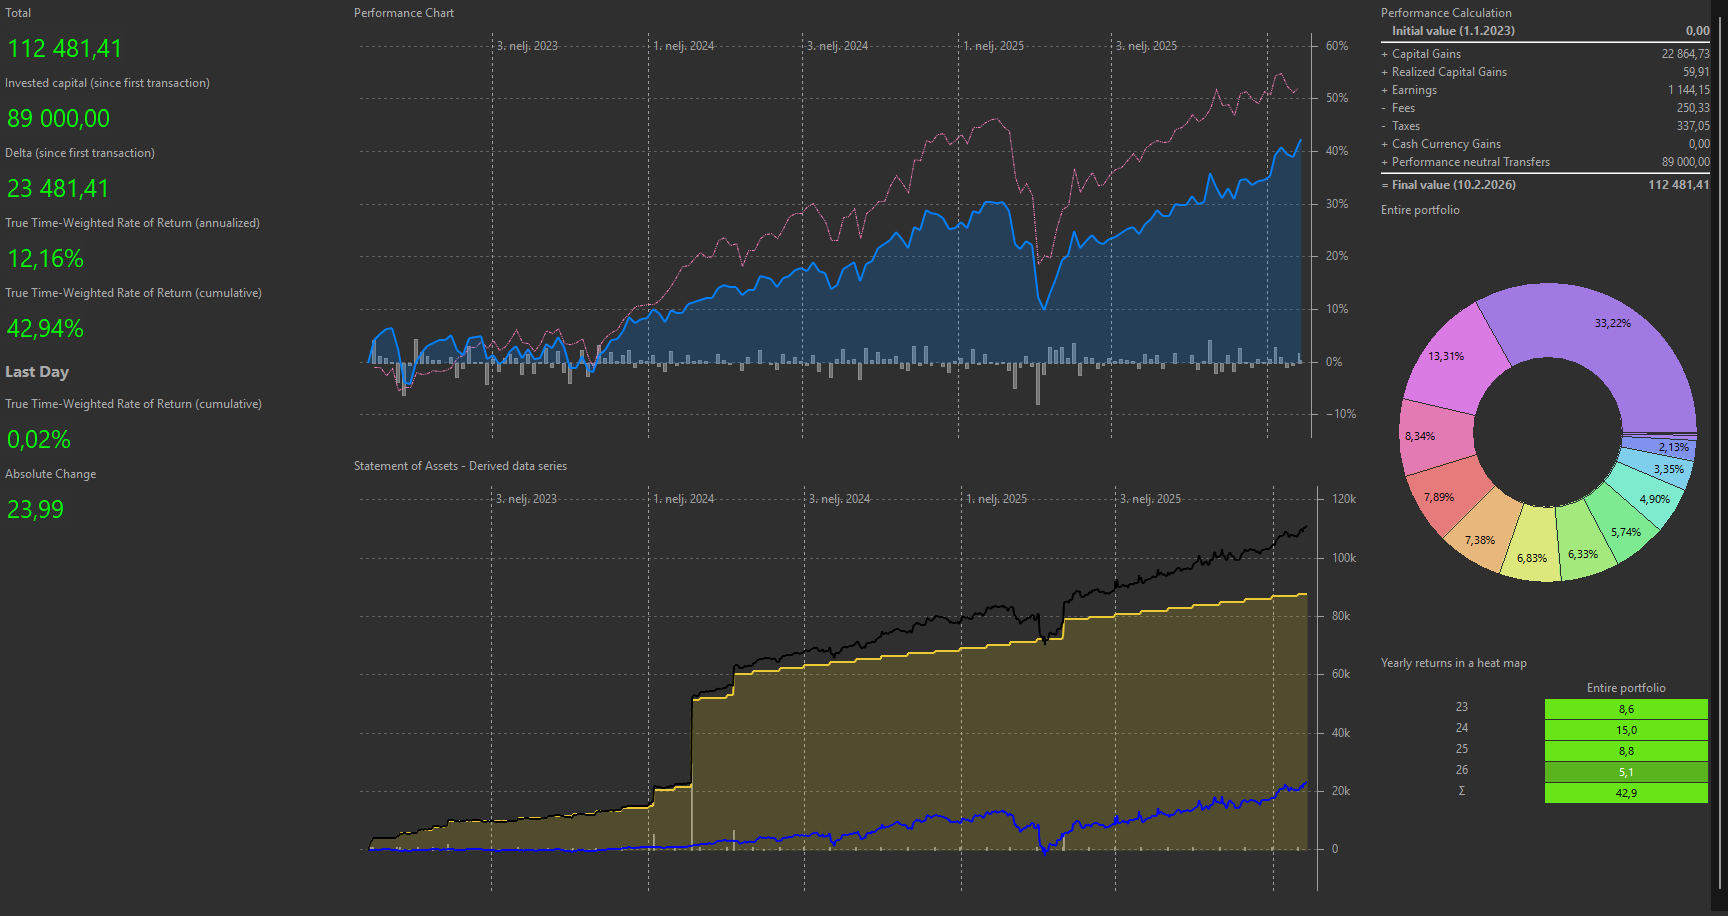
Salkun antomia Nordnet ajalta eli about 2013 toukokuu eteenpäin ja 2025 loppuun.
Tuo laskin kuvassa kertoo sen erotuksen salkkutalletusten ja salkkunostojen välillä kun tein jokaiselle vuodelle oman (2013-2025) ja laskin ne yhteen eli hieman eroaa siitä kun otin koko tuon ajan yhdellä listauksella eli talletuksia on 6,8K vs 5K enemmän kuin nostoja. Olen joskus näyttänyt täällä aivan toisenlaisia lukuja ja ne eroavat varmaan siksi etten ole älynnyt ruksata kaikkia laatikoita kun siellä on 2x nosto ja 2x talletus ja vielä nosto/talletus, ihme pelleilyä??
Aika hyvin kuitenkin lopputulos täsmää salkun arvon ja tuoton kanssa, pientä heittoa mutta siellä on niin paljon muuttujia ettei mikään ihme. Tulos on kelvollinen omaan riskinsietokykyyn…tuolla X:ssä pantterit postaa ihan kipeitä prossia ja ammattimiehet toki tekee tämän tuoton viikoissa mikä minulta on vienyt 11½ vuotta.
Edit: En nyt jaksa korjata kuvaa enää mutta harhainen pääni teki taas tepposet ja vähensin tuon 5K tuosta markkina-arvosta kun se olisi pitänyt miinustaa oma pääomasta kun tuo käteinen salkussa on tullut Bittium myynneistä ja silloin se täsmää justiinsa tuon 319K tuoton kanssa. ![]()
![]()
6 tykkäystä
On ollut kova tammiralli salkussa. Saatu mukava etumatka jo indeksiin.
Hieno laitos tämä osakesäästötili, “korkoa korolle ilmiö” pääsee oikeuksiinsa.
51 tykkäystä
Ajattelin ruveta vähän tarkemmin seuraamaan kuinka osakesäästötilini pärjää kuutta ETF-rahastoani vastaan. Pääasiallinen vertailuindeksini olkoot Seligsonin OMXH25 ETF.
Olen vielä melko aloittelija ja sijoitussuunnitelmaa enemmän luotan intuitiivisiin päähänpistoihini. Joten tämä ei välttämättä tule olemaan kaunista katseltavaa.
TAMMIKUU 2026
MUUTOKSET SALKUSSA
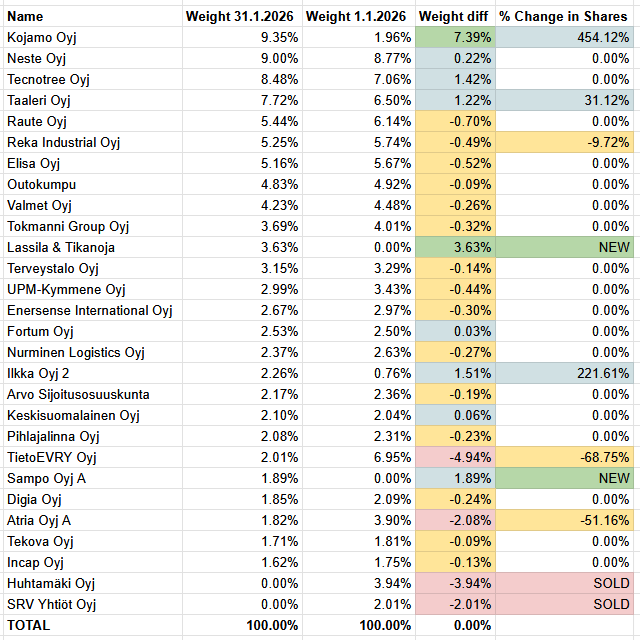
Kuun alkuvaiheilla tein merkittävän kevennyksen Tietoon, koska en pitänyt sitä enää niin houkuttelevana. Myin sen itse asiassa jopa kokonaan pois hetkeksi, mutta ostin sitten vähän halvemmalla osan takaisin.
Kevensin Atriaa luettuani otsikon Mercosur-sopparista. Ilmeisesti väärä johtopäätös, koska osake vaan jatkoi nousuaan.
Aki Pyysingin kirjoitukset olivat suurin inspiraationi Kojamon lisäämiseen. Sitten tuli vielä Trumpin tulliuhkailut, johon reagoin myymällä Huhtamäen ja laittamalla nekin eurot Kojamoon.
Virheellinen taka-ajatukseni oli, että muutkin siirtäisivät rahojaan Kojamon kaltaisiin tullien suhteen turvallisempiin kohteisiin johtaen sen kurssinousuun. No väärinhän se meni.
Näin siis Kojamosta tuli OSTin suurin positio. Ei välttämättä itsessään huono asia, mutta epäonnistumisiksi tässä voidaan laskea virheelliset päätelmät, liian suuret liikkeet ja huonot ajoitukset. Ja tietty ettei sen enempää tehnyt omaa tutkimusta.

Siinä ne tärkeimmät muutokset. Yleisesti ottaen tuli liian paljon säädettyä tammikuussa.
TULOS
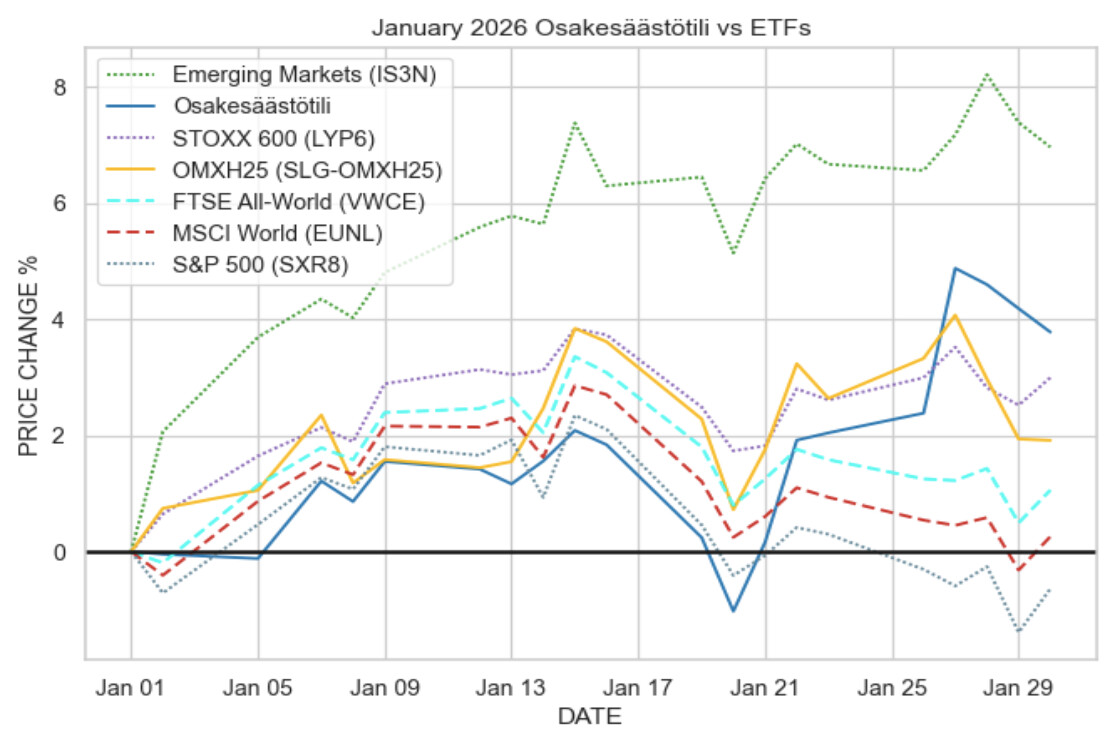
Suurimman osan tammikuuta olin häviöllä jokaista indeksirahastoani vastaan. Sitten vielä Trumpin tulliuhat iskivät salkun miinukselle.
Loppukuusta kuitenkin noustiin. Ensin SRV vähän piristyi ja pari päivää myöhemmin Tecnotreen ostotarjous nosti OST:n peräti kakkosijalle.
Tammikuun ylivoimainen voittaja oli kuitenkin iShares Core MSCI Emerging Markets IMI UCITS ETF (Acc), joka liihotteli omissa korkeuksissaan koko kuukauden.
OST: +3.78 %
OMXH25: +1.92 %
(Emerging Markets: +6.96 % !)
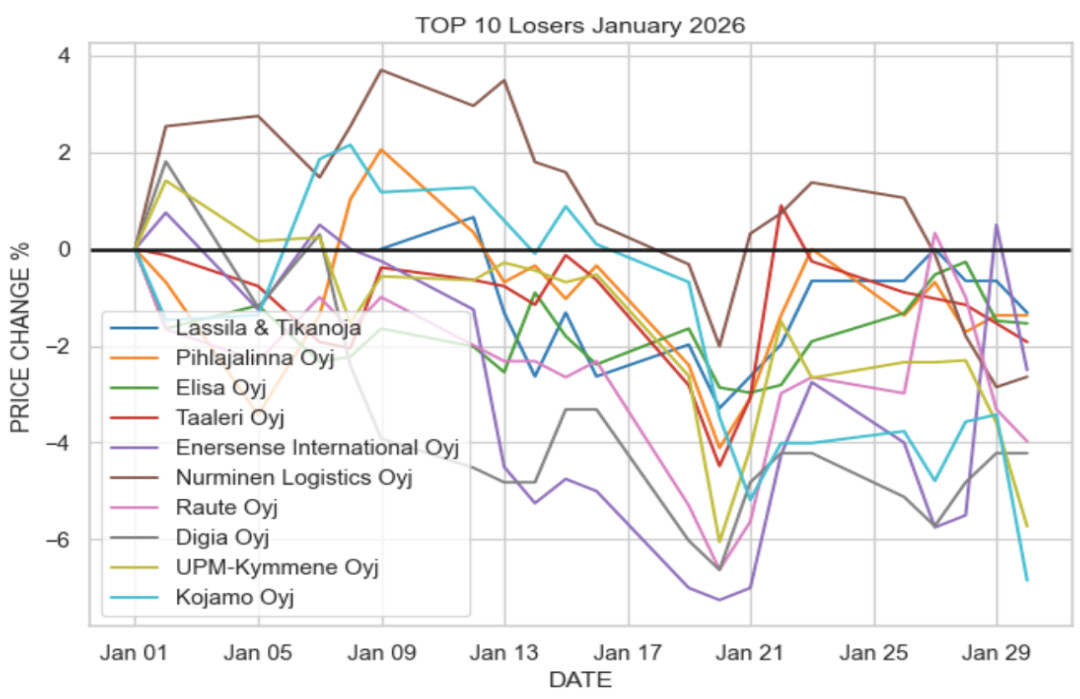
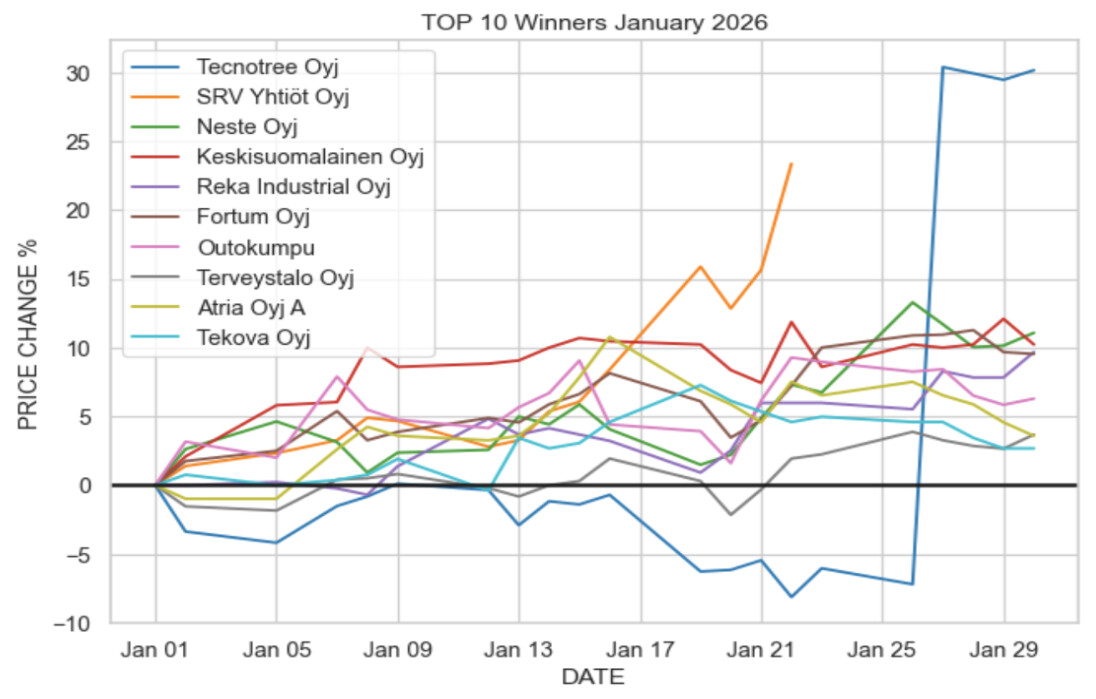
Tässä vielä yksittäisten osakkeiden häviäjät ja voittajat:
8 tykkäystä
Eilen tuli oman salkun 1-vuotis syntymäpäivä täyteen.
Tuotto oli 35,3%, eli yli indeksin. Onneksi Novo julkaisi tuloksen vasta päivän päätyttyä…
22 tykkäystä
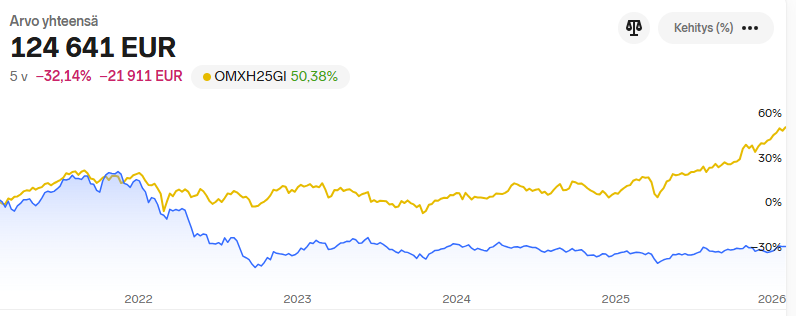
Taas on vuosi vierähtänyt. 2025 meni ihan hyvin, vaikkakin keväällä käytiin hieman pakkasella tuotoissa koko salkun osalta. Tämä oli kuitenkin hyvä hetki kaivaa sohvatyynyjen välistä viimeiset roposet ja heittää ne markkinoille. Salkku ylitti myös 100 000 euron rajapyykin syys-lokakuun vaihteessa. Toivottavasti ei käydä enää sen alla.
Koko sijoitusaikaa katsellessa tahti on ollut aika tasaista. Vertailuindeksiä (OP-Maailma indeksi A) on otettu turpaan, eli helpommallakin olisi päässyt parempaan tulokseen.
Tämä vuosi on kuitenkin alkanut suhteellisen hyvin. Seuraava tavoite onkin 200k € salkku ja Nordnet PB jäsenyys. Nykyistä säästösuunnitelmaa ylläpitämällä ja 8% tuotoilla kultainen Nordnet sovelluksen logo odottaisi vuoden 2029 lokakuussa.

12 tykkäystä
Merkittäköön tänne muistiin, että tänään salkun tuotto ylitti 20k 
Elokuu 2025: 10k
Lokakuu 2025: 15k
Helmikuu 2026: 20k
33 tykkäystä
Muistiin tämä myös… Sen verran hyvin osui kyllä tänään reilussa ylipainossa olevaan lappuun päälle 30% nousu, että käväistiin hetkellisesti yli kolmen vuoden vuosipalkkani kokoisessa päivänousussa. ![]() Kyllähän sieltä sitten alaskin päin päästiin, mutta onneksi kerkesi kuvan saamaan, niin voi joskus sitten kyynel silmässä, kun kaikki on kustu, miettiä, että lähellä oli selviäminen jaloilleen.
Kyllähän sieltä sitten alaskin päin päästiin, mutta onneksi kerkesi kuvan saamaan, niin voi joskus sitten kyynel silmässä, kun kaikki on kustu, miettiä, että lähellä oli selviäminen jaloilleen.
![]()
32 tykkäystä
Kova nousu tahti ![]()
Itsellä tuo 20t on 200e päässä. Tällä hetkellä ytd n. 4%.
Omaa pääomaa laitan vain 120e kuussa rahastoihin. Välillä jos on jostain vähän enemmän kertynyt rahaa, saatan ost:lle jotain lisäillä/poimiakkin. Asentajan palkoilla ei parempaan pysty ![]()
60% rahastoissa ja 40% osakkeissa.
17 tykkäystä
Laitan vasta nyt tammikuun 2026 toteuman sijoituksissani.
Tammikuun 31. 2026 tilanne oli seuraava:
YTD 2026: + 1,16 %
12 kk: + 10,02 %
2 v: +22,52
Tammikuussa oli siis hienoista nousua. Toivottavasti suunta pysyy samana jatkossakin ![]()
12 tykkäystä
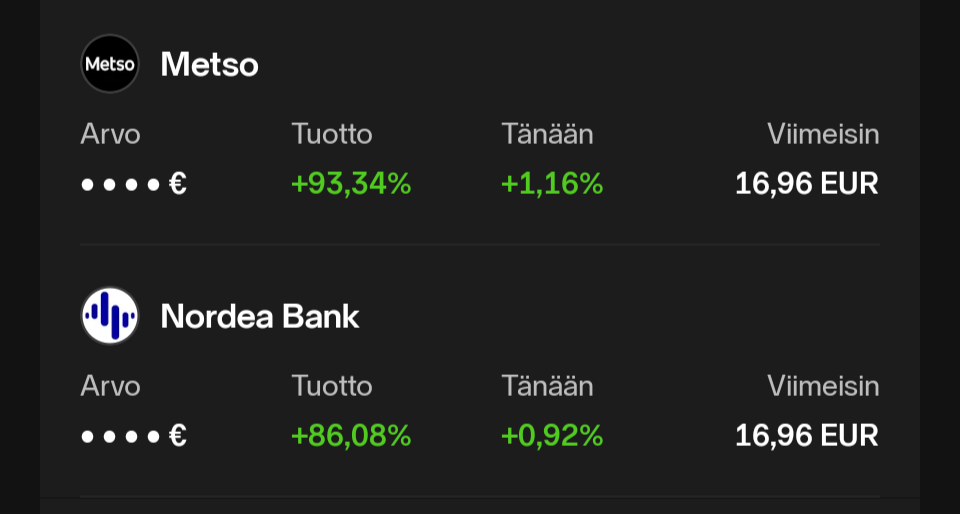
Aika tasan vuosi sitten mulla oli OST:illa käteistä jonkin verran ja mietin sille sopivaa kohdetta. Halusin salkkuun kotimaista ja päädyin Metsoon. Ostin osaketta kahdessa erässä ja ostot osuivat lankulle lähes täydellisesti. Tämä on kautta-aikain parhaiten tuottanut sijoitukseni ja näyttäisi siltä, että vielä ei ole kiirettä myymään.
27 tykkäystä