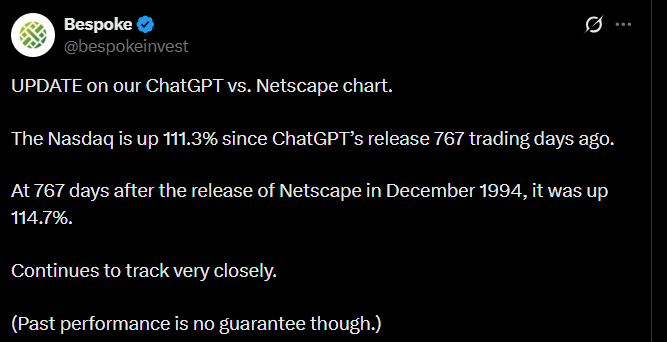
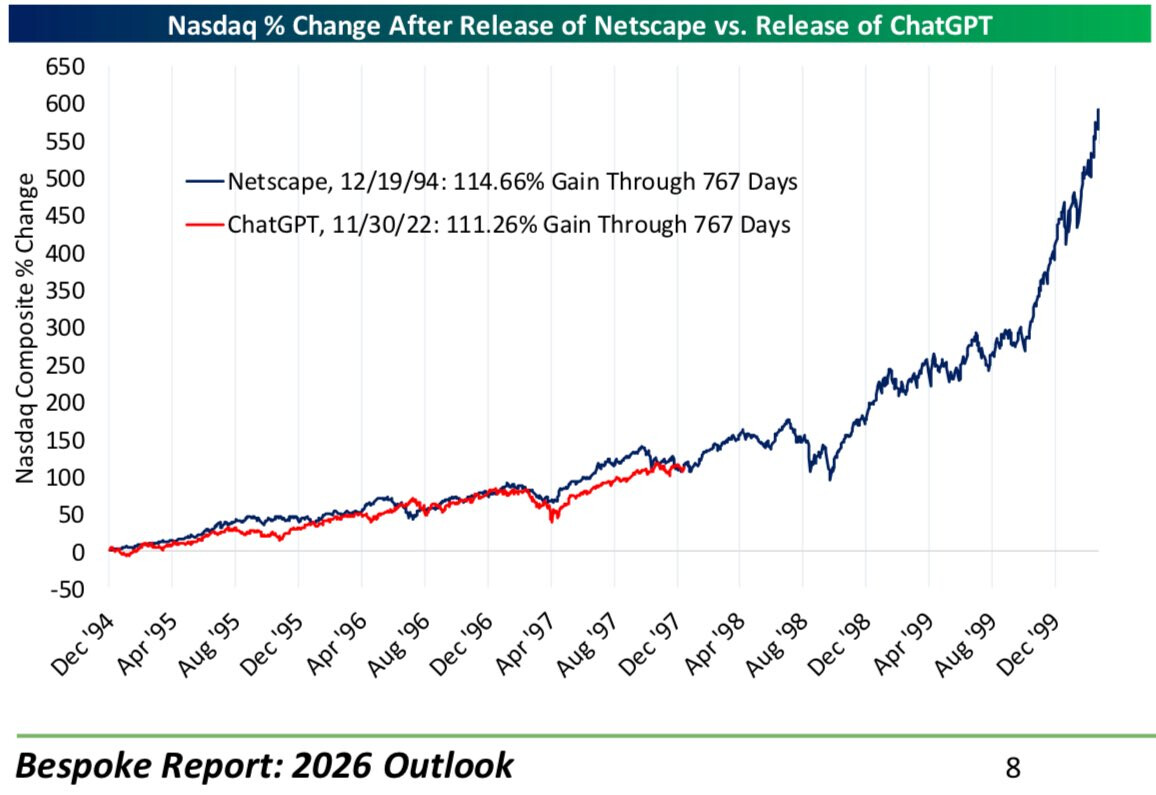
This isn’t from the aforementioned account, but from one that’s somewhat similar; this isn’t useful either, in a way, but it’s interesting and entertaining, like the previous Kobeissi one. ![]()
https://x.com/bespokeinvest/status/2002365615265423746
This isn’t from the aforementioned account, but from one that’s somewhat similar; this isn’t useful either, in a way, but it’s interesting and entertaining, like the previous Kobeissi one. ![]()
https://x.com/bespokeinvest/status/2002365615265423746
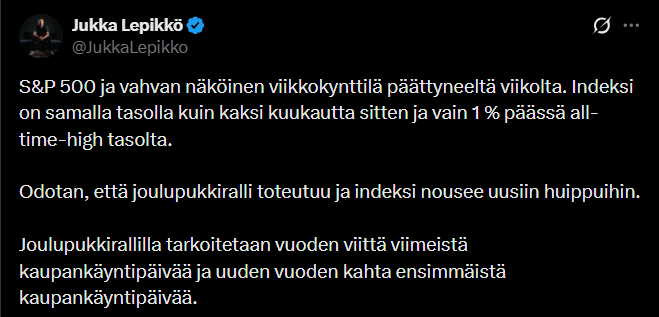
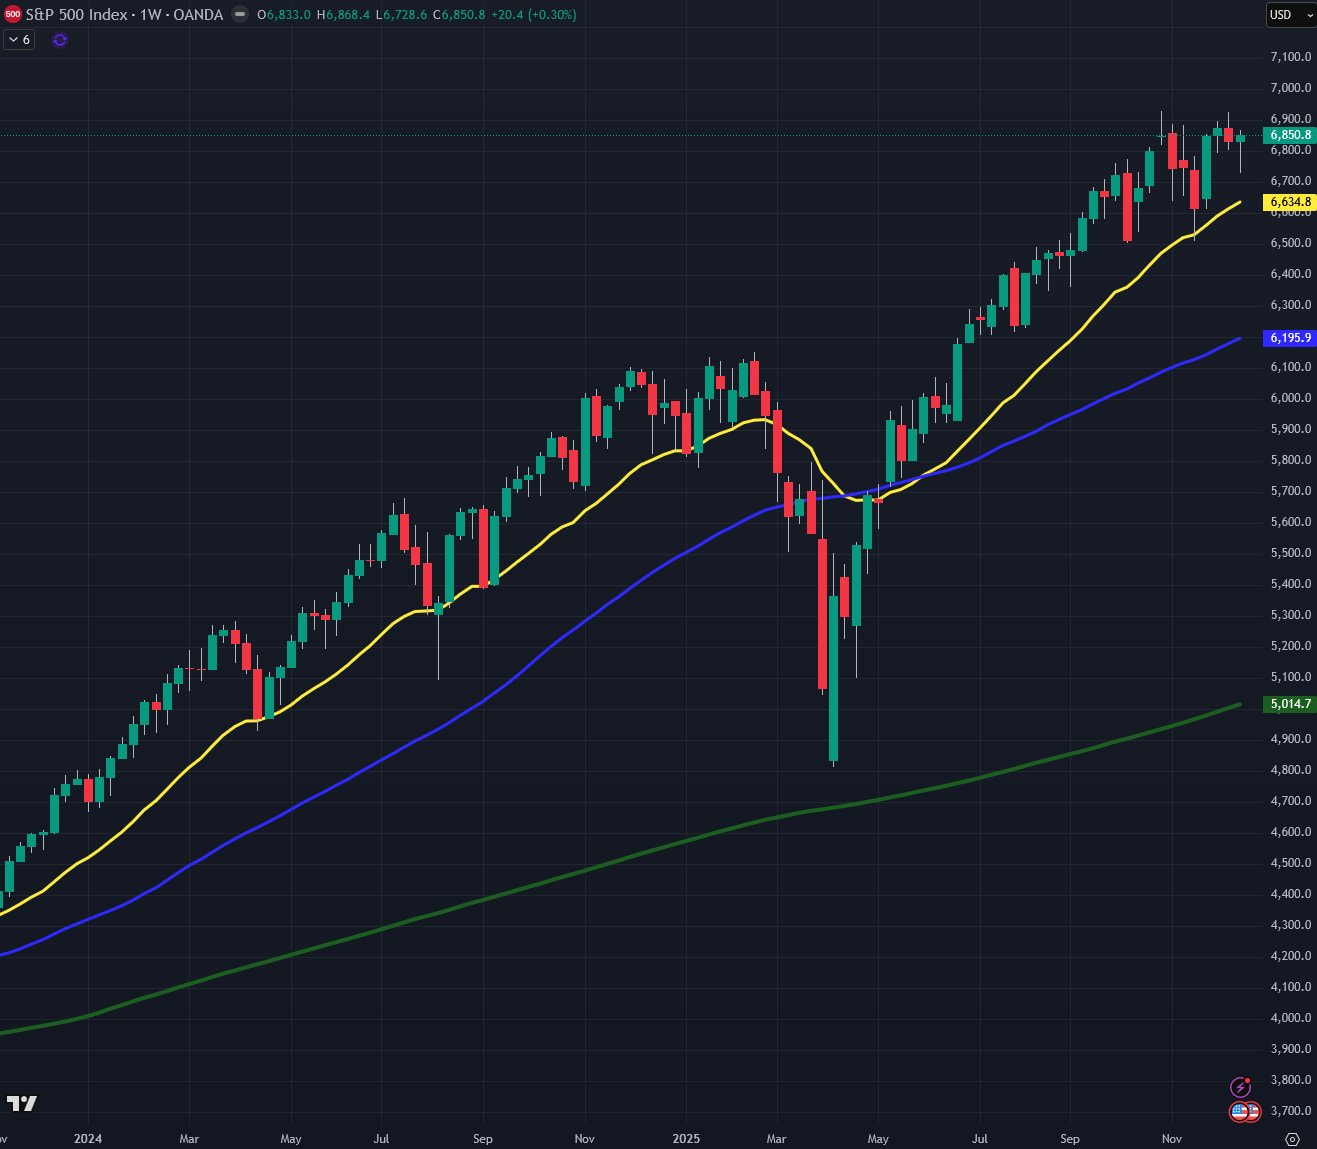
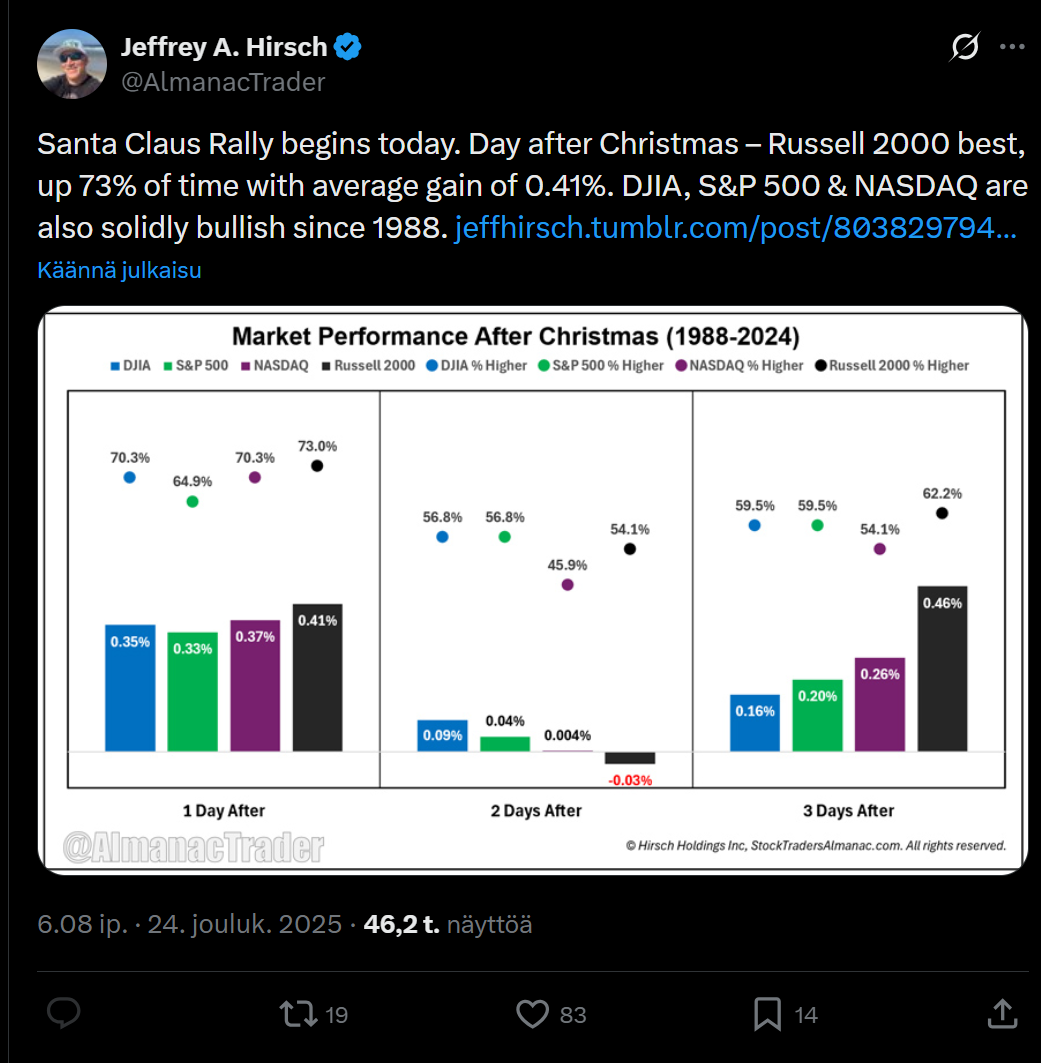
@Jukka_Lepikko, The 500 and the Santa Claus rally ![]()
![]()
https://x.com/JukkaLepikko/status/2002668578504368454
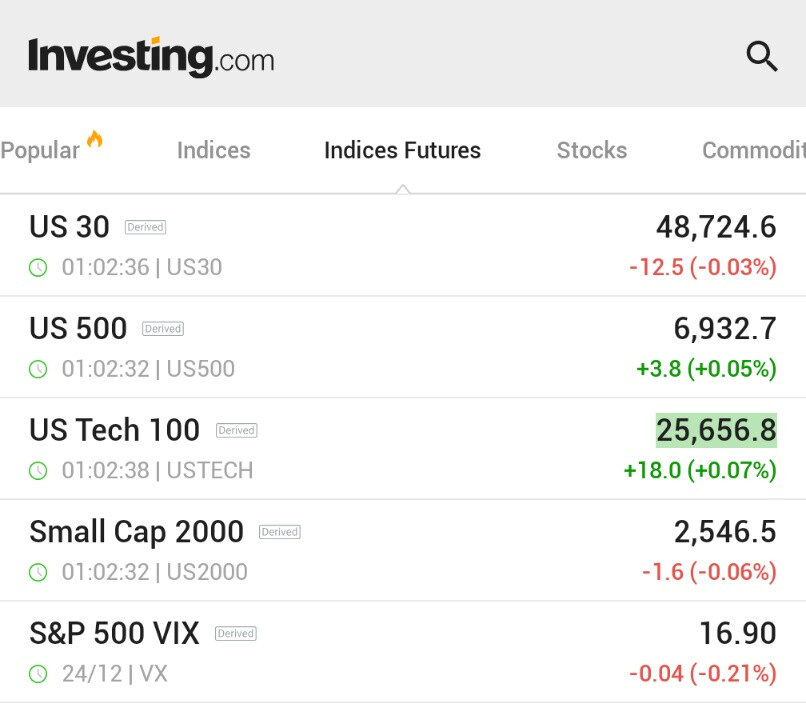
And the S&P 500, keeps going, and going, and going - keeps going one more time… ![]()

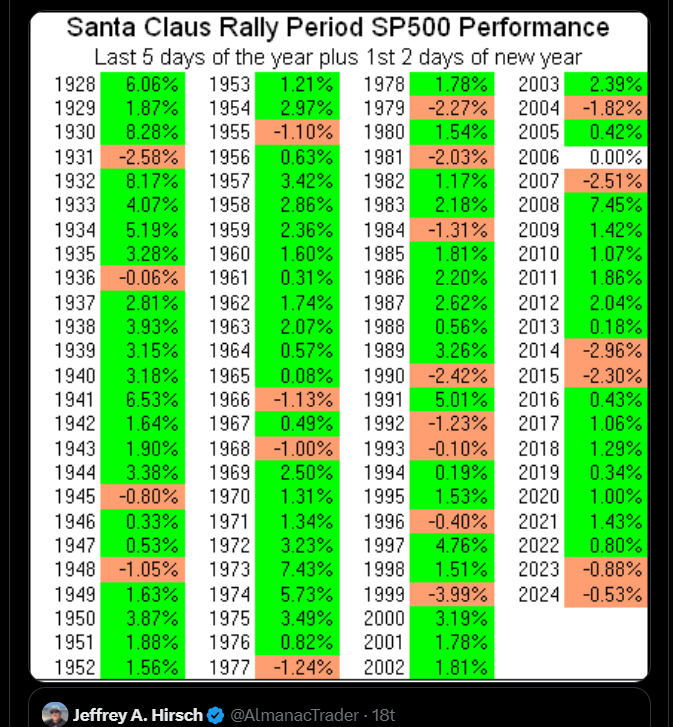
Fun and interesting data regarding the Santa Claus rally ![]()
https://x.com/McClellanOsc/status/2003873142717219239
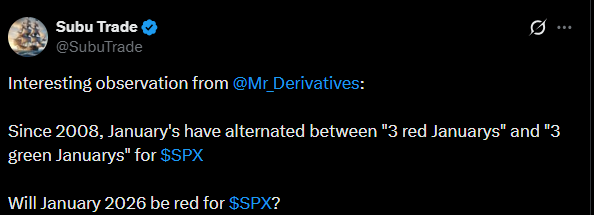
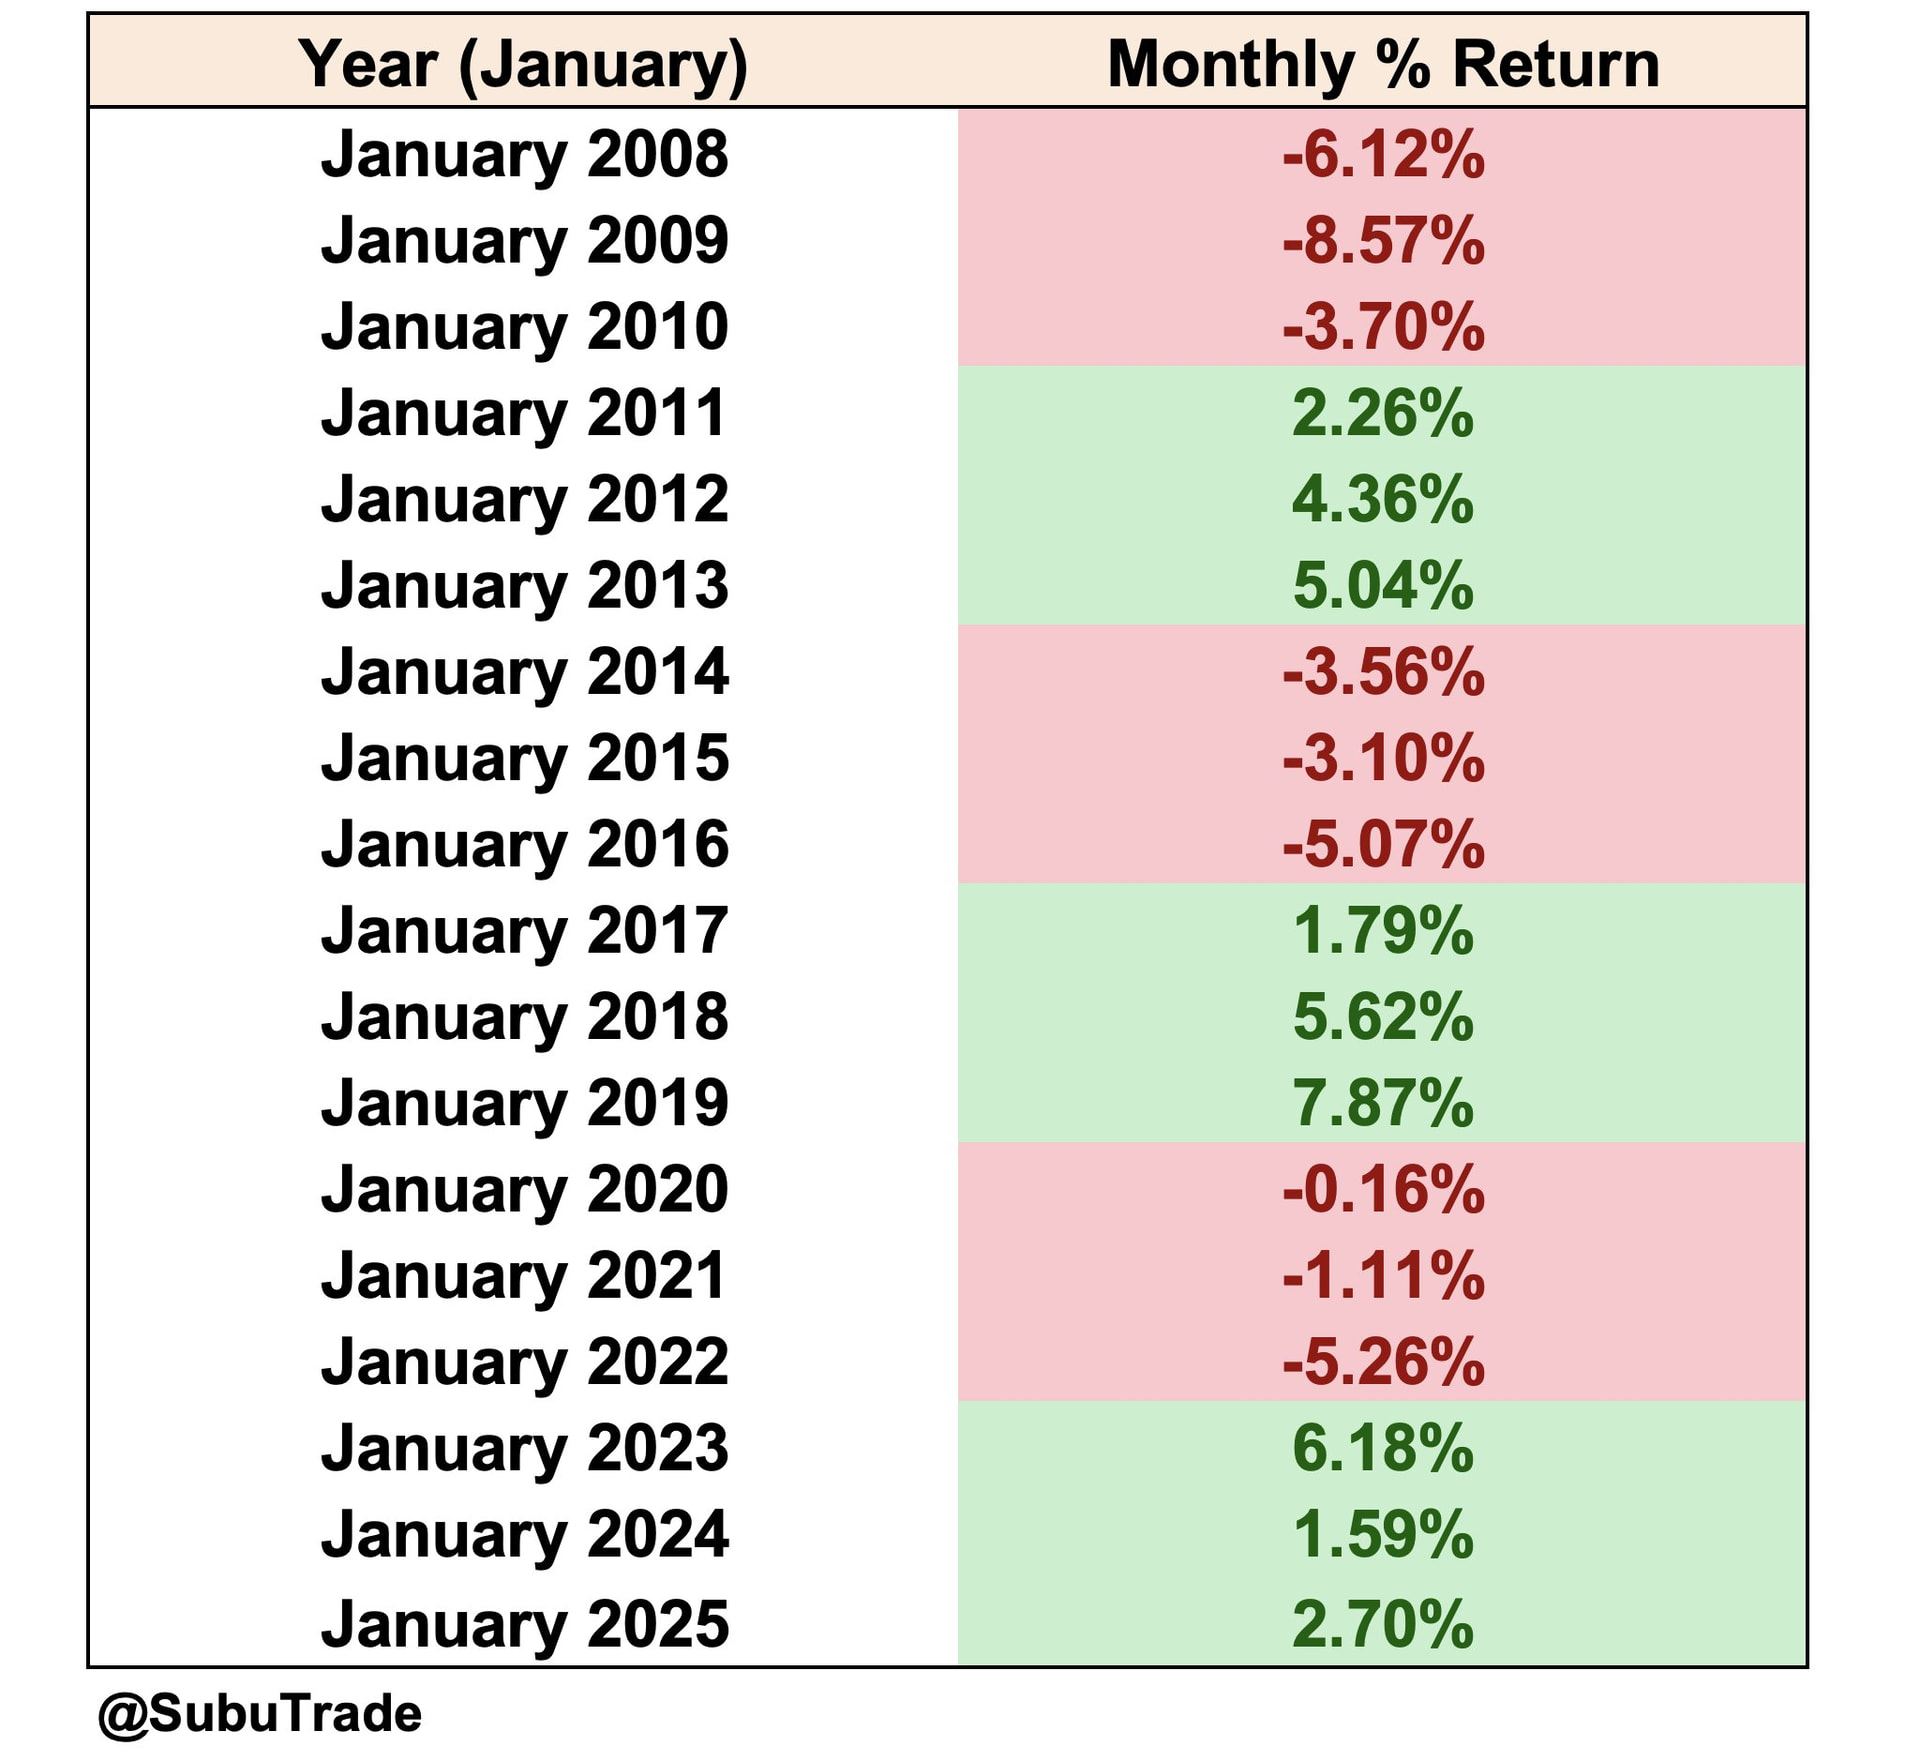
Here is a tweet about the S&P 500’s performance for January across different years; it looks like a red January is coming this year (according to this)? ![]()
![]()
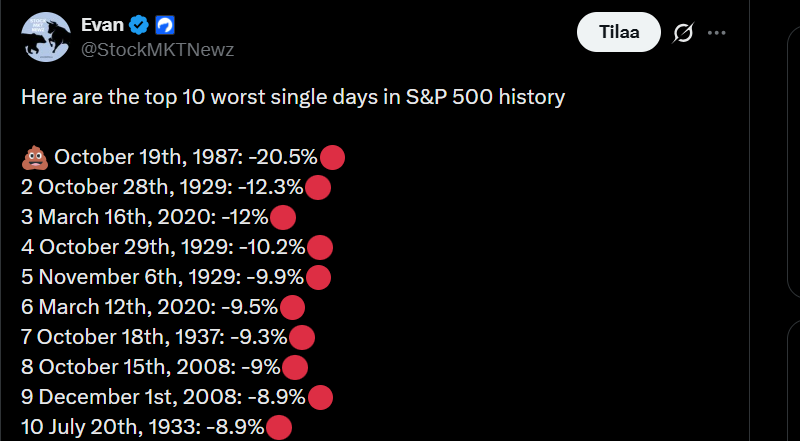
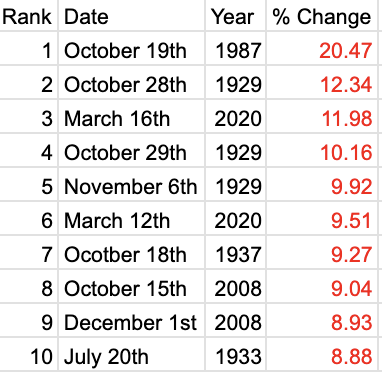
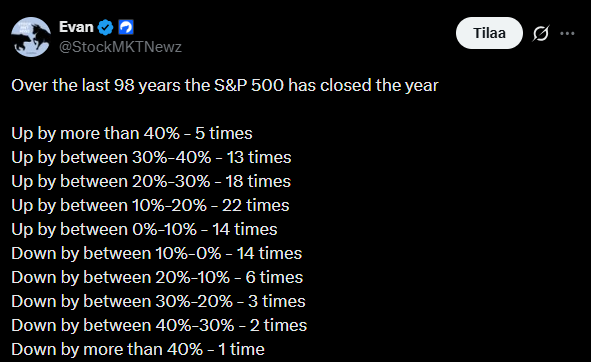
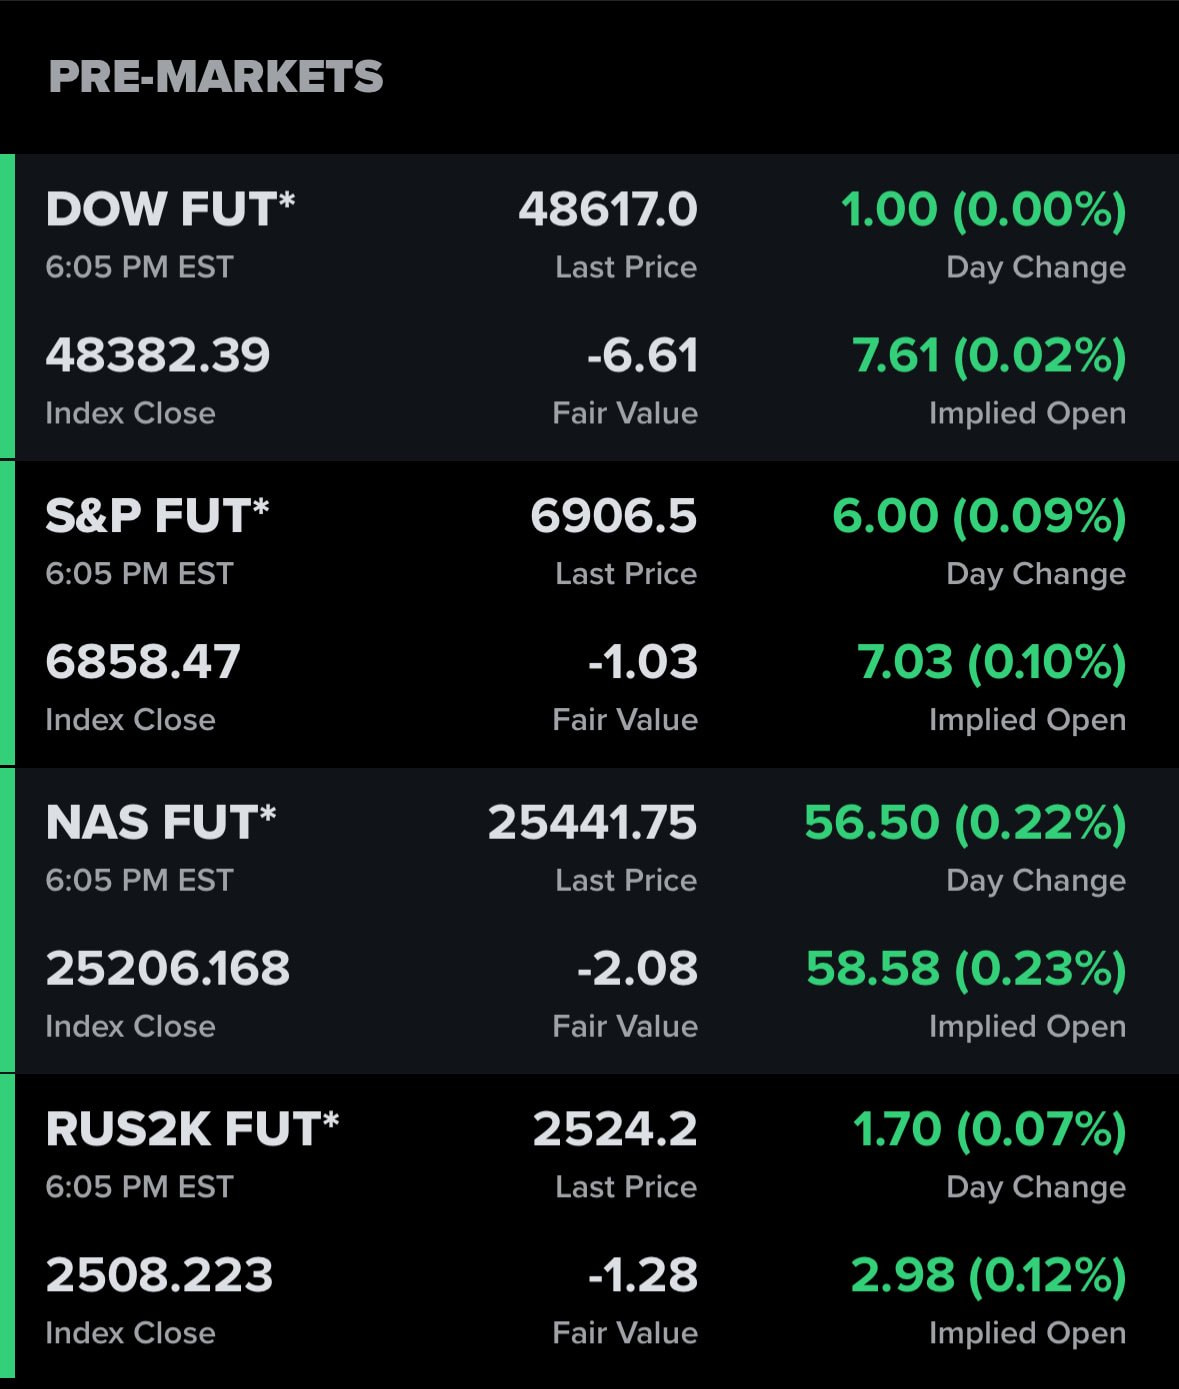
Sometimes I forget what kind of down days there have been in history. ![]()
https://x.com/StockMKTNewz/status/2005313526605230114
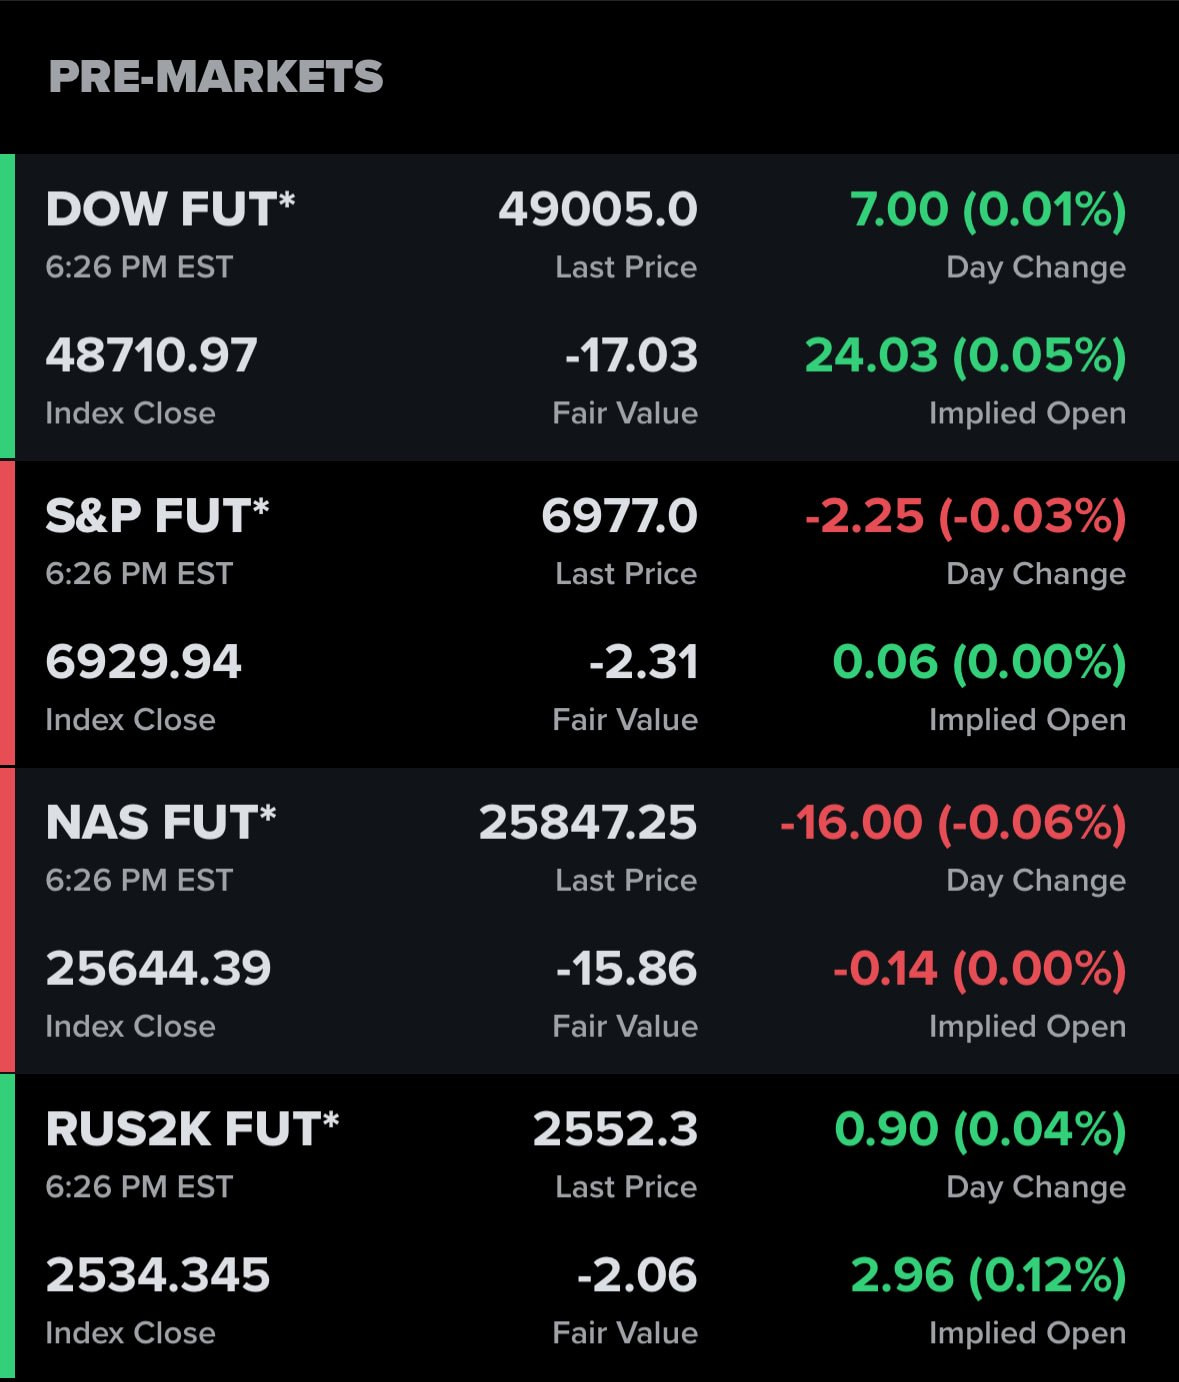
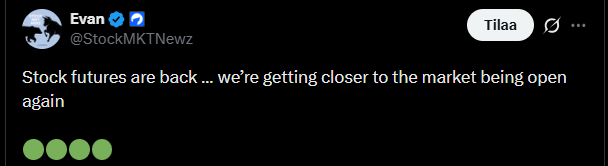
Have a good start to the week, here we go again ![]()
These are also fun to study and reflect on:
The market rose exponentially throughout the “Roaring Twenties”, with stocks increasing in value over 675% between 1921 and 1929, a period of uncontrolled growth and rampant speculation. The subsequent crash was the worst in U.S. history, with an 89% decline from peak to trough.
On July 18, 1933, the Dow Jones Industrial Average (DJIA) had doubled in value for the year, a 100% gain
The market experienced a strong bull run in the mid-1980s, peaking in August 1987 before the abrupt 22% one-day drop in October. While not a 100%+ annual gain, the rapid rise in the preceding years was significant.
The market tripled in value in the five years leading up to the peak in 2000 before the bubble burst, leading to a 75% loss in the NASDAQ index
I wonder how many crashes still result in a portfolio that’s in the green because the preceding growth was so massive? ![]()
This classic phrase actually sums it up quite well ![]()
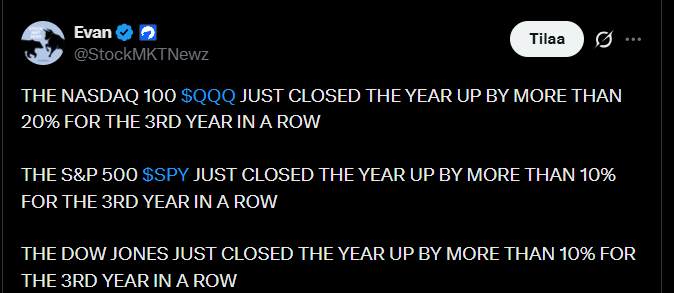
The DJ, Nasdaq, and the 500 have been doing quite nicely these past few years ![]()
https://x.com/StockMKTNewz/status/2006472391707472320
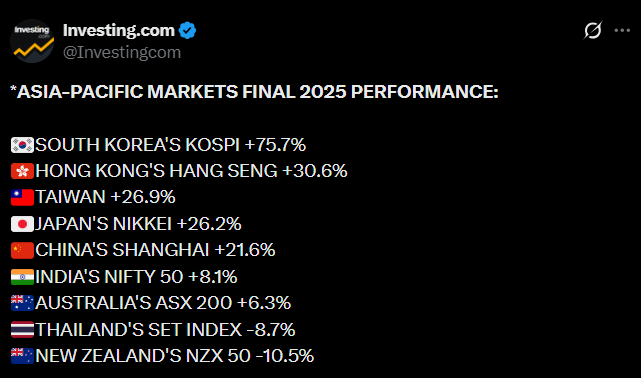
Here is a tweet about last year’s percentages for Asia-Pacific markets ![]()
https://x.com/Investingcom/status/2006685554386071809
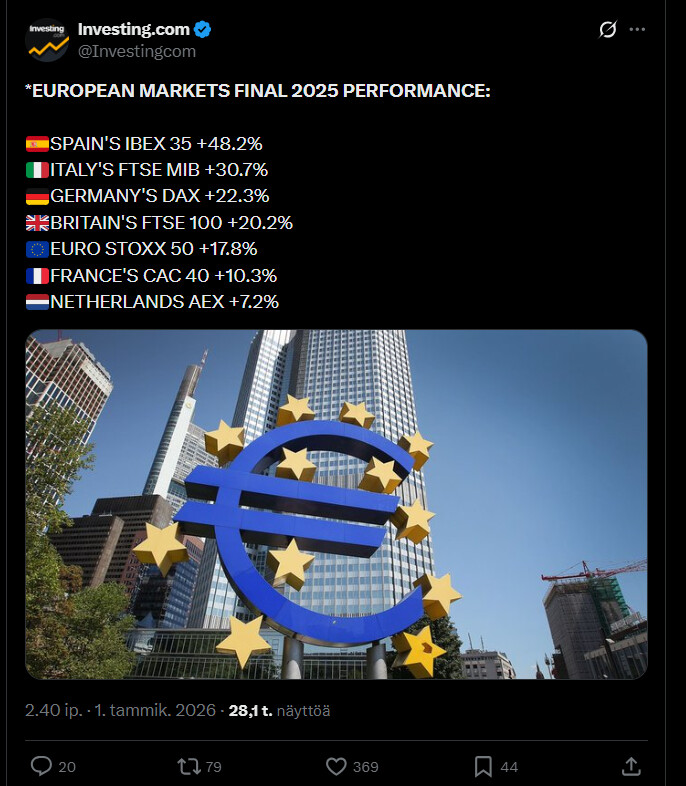
Here are the European stock market performances from last year ![]()
Both the S&P 500 and I have only managed to surge over 40 percent in a calendar year once, although it has a longer history than I do, so I get the points. ![]()
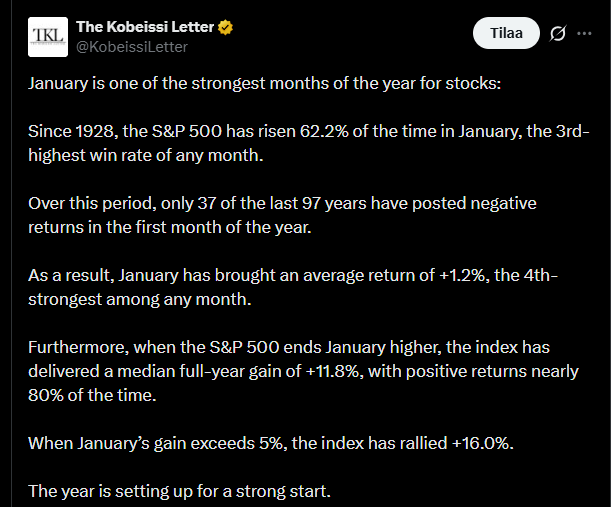
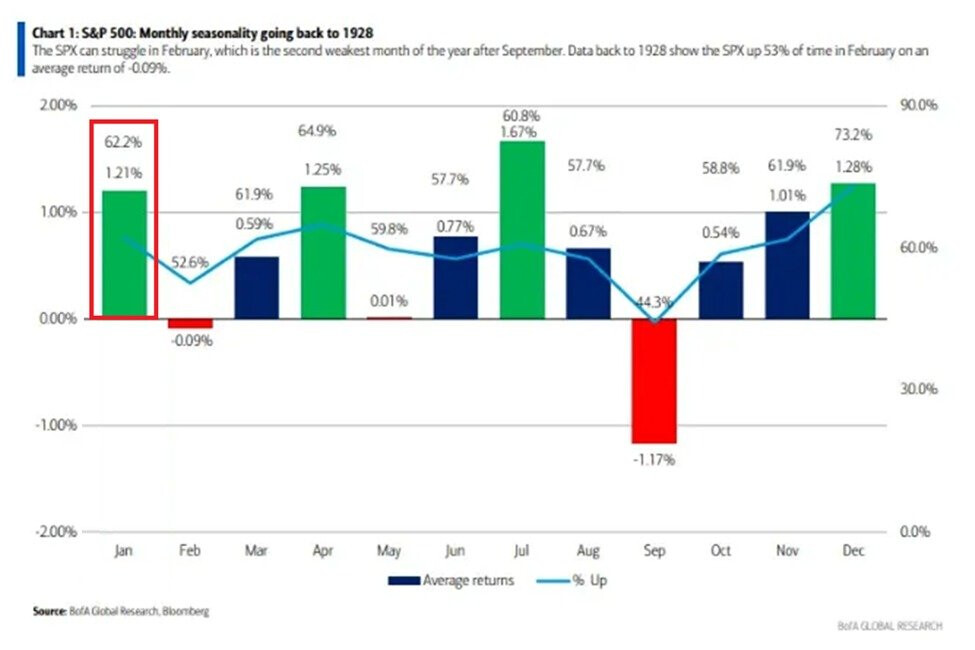
Here is a tweet about the S&P 500’s Januaries, and among other things, how the momentum has often continued after a green January. ![]()
https://x.com/KobeissiLetter/status/2008204755462410479
Soon I’ll be swept up too ![]()
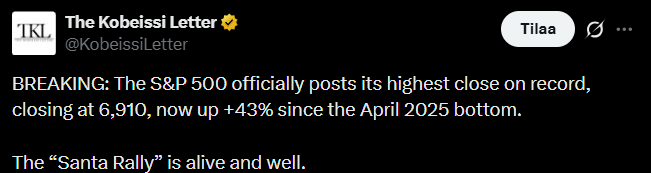
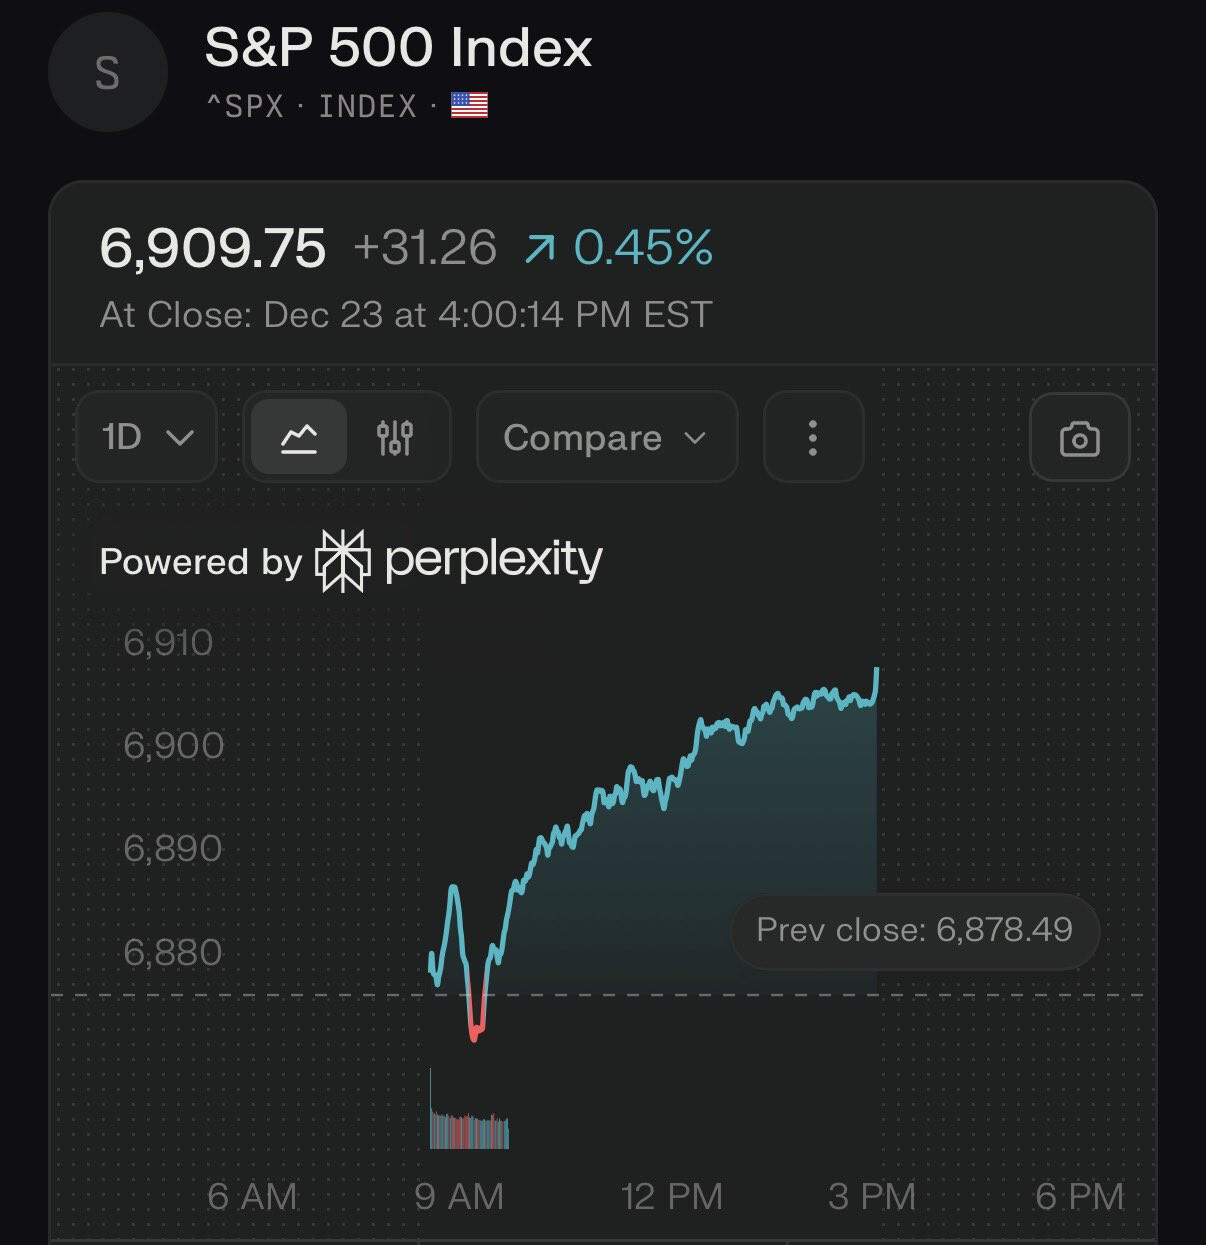
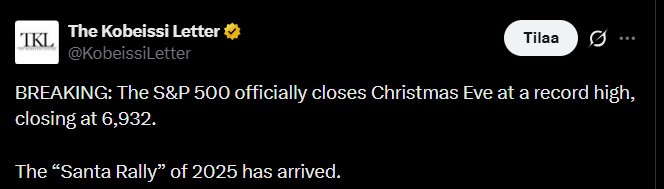
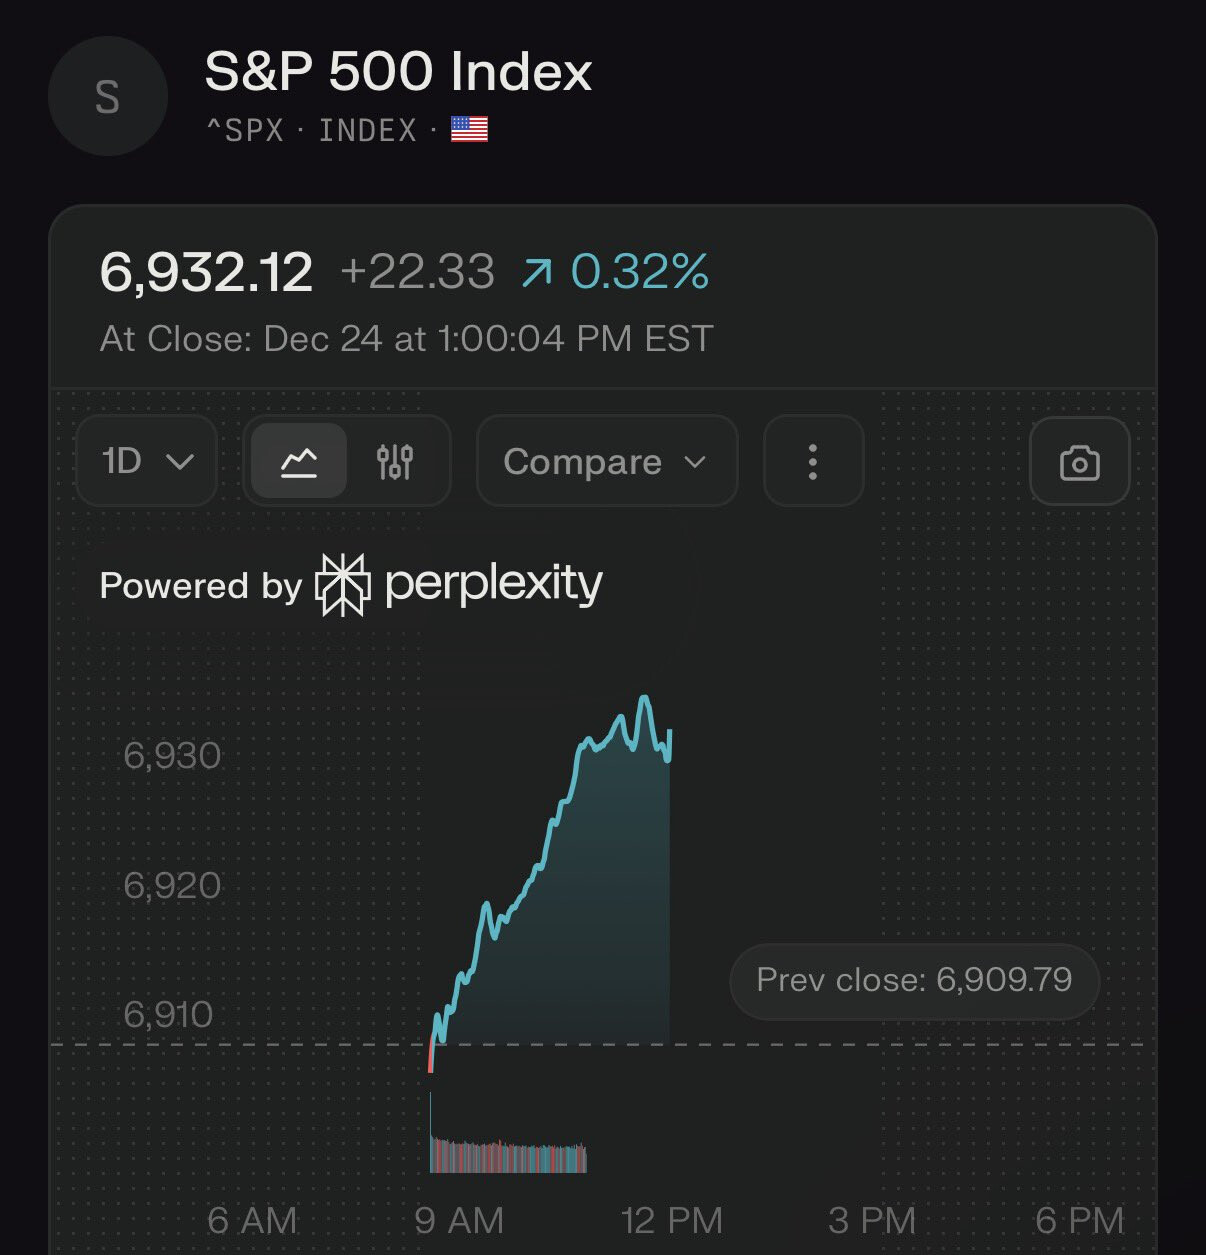
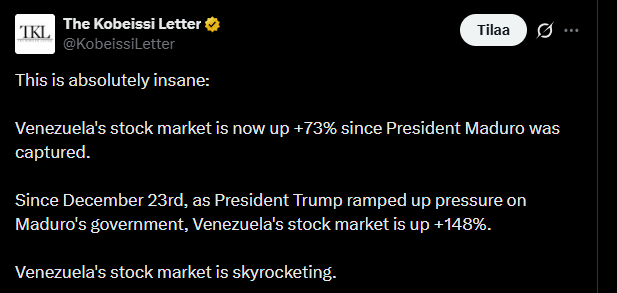
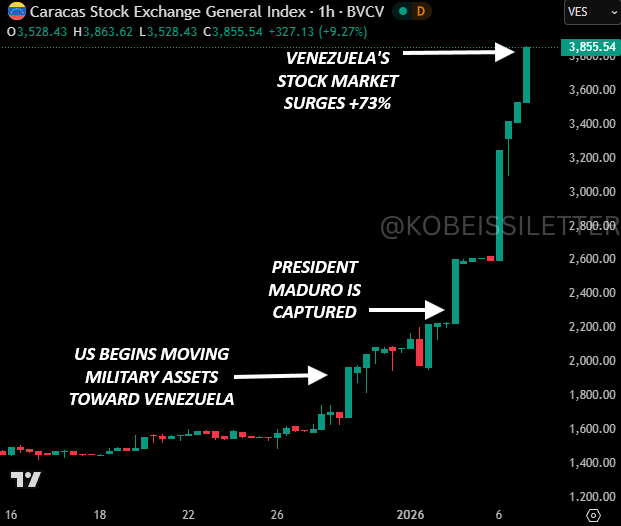
Now they’re already talking about the stock market rocketing ![]()
https://x.com/KobeissiLetter/status/2008578473133310093
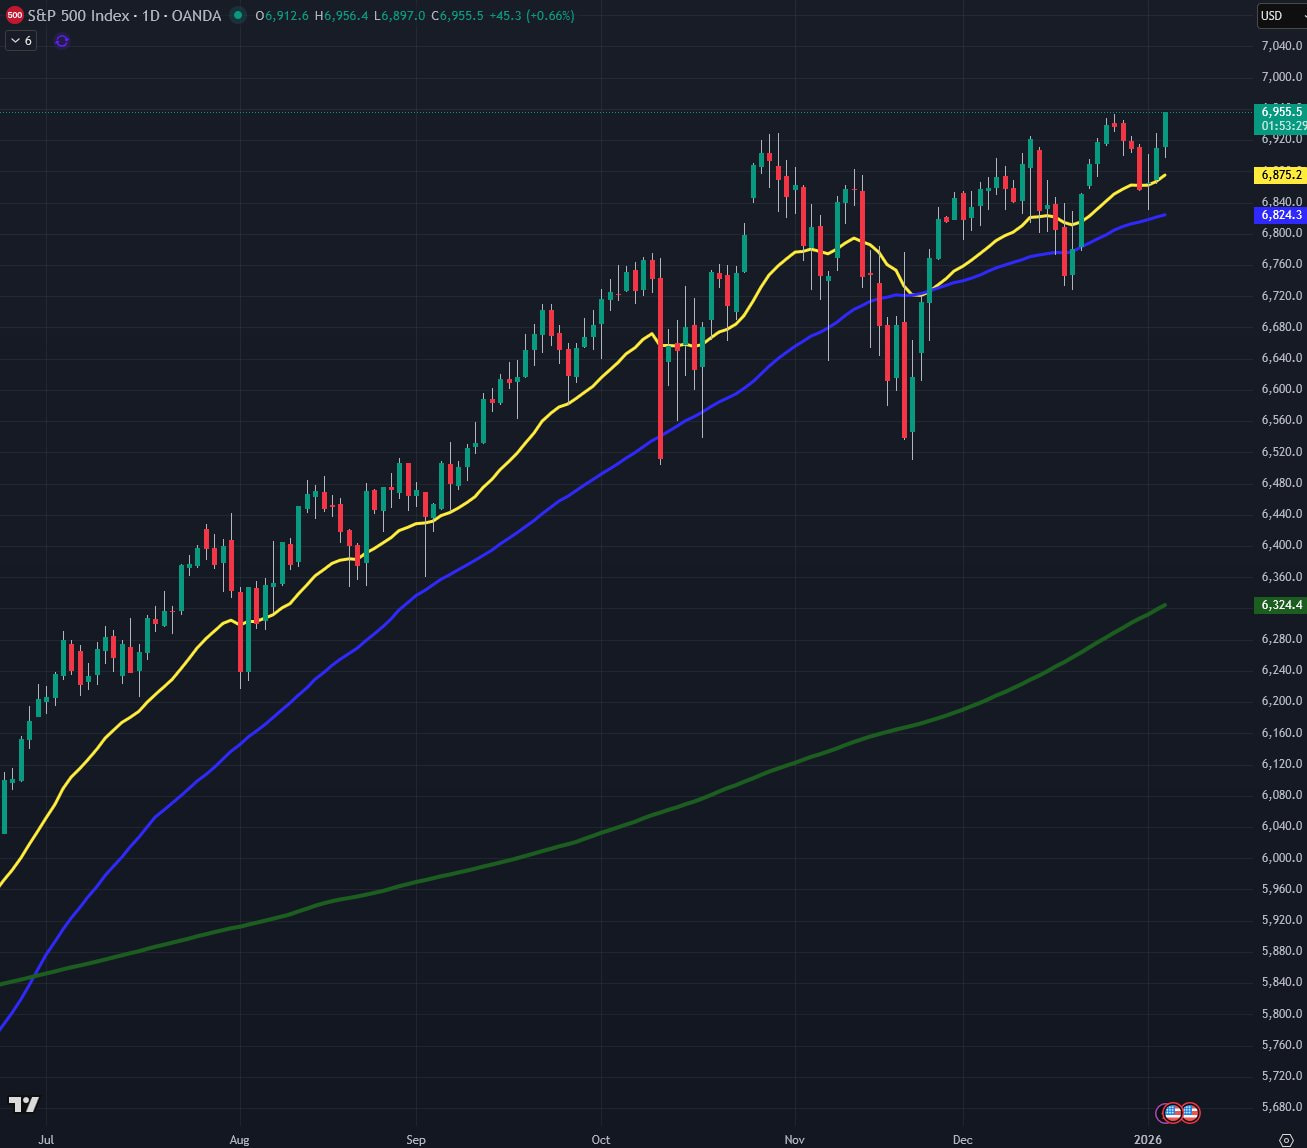
@Jukka_Lepikko and the 500’s first ATH of the year ![]()
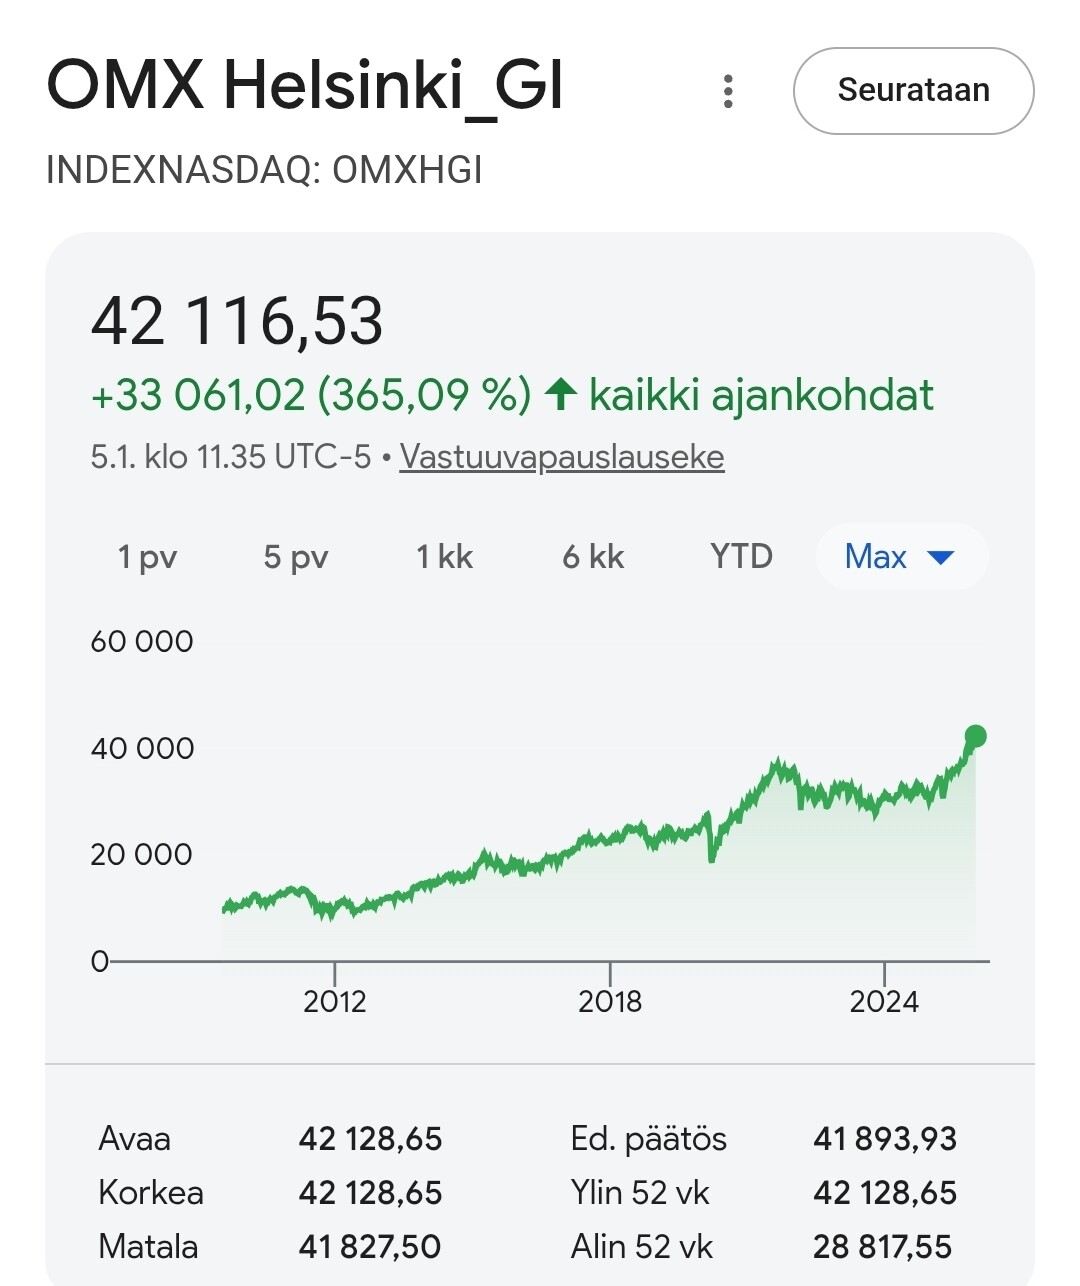
Helsinki GI and the first ATH all-time-high for this year! ![]()
Source: Google
Looks like a bit of a fever has set in, as the curve has escaped its steady rising average line (which Google’s service doesn’t provide). But no worries, this time is different and the crash won’t come until May or October 2026. ![]()