Stock Market Direction (Part 2)

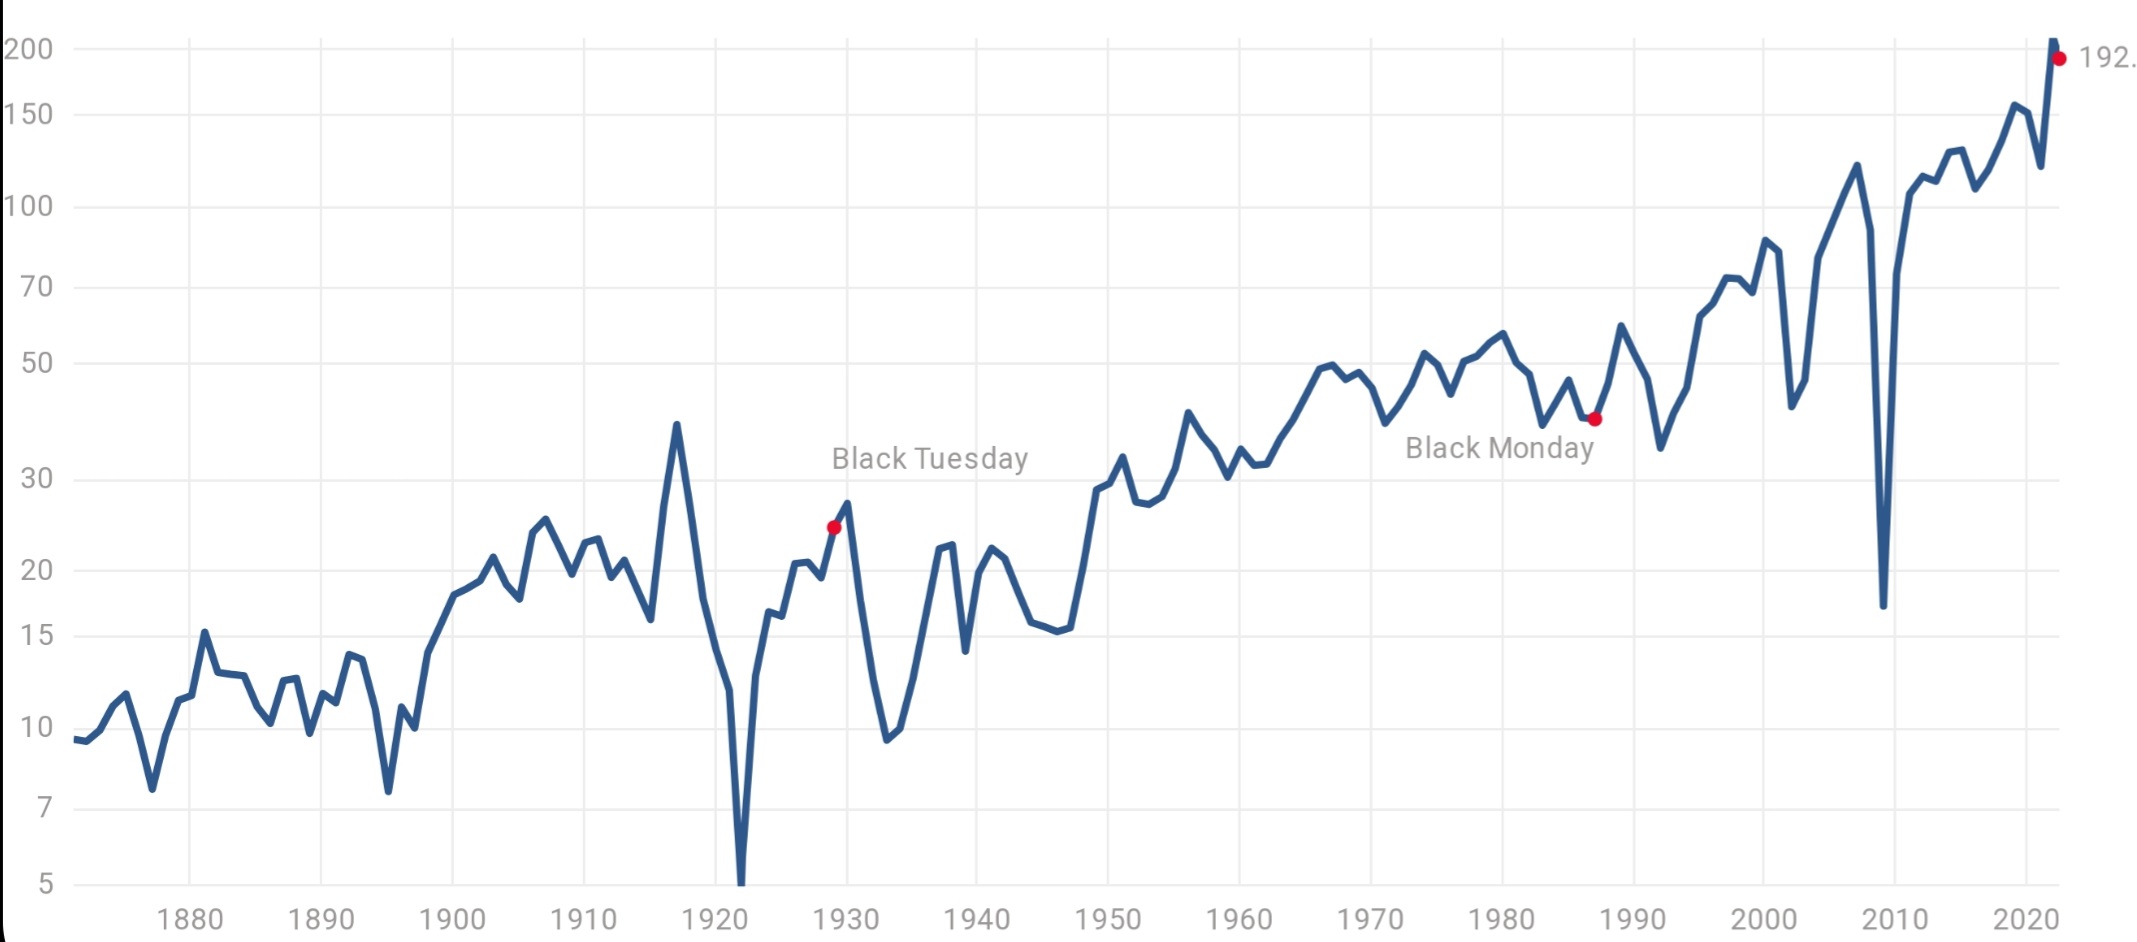
If you had considered a Shiller P/E of 20 to be a reasonable level, would there only have been investment opportunities before 1990 and at market bottoms in 2009?

The difference in valuations between Europe and the USA is explained, among other things, by the fact that the USA has relatively more technology/growth companies in its index.
Has the number of growth companies in the US index increased over the years, and would that explain the historical growth in valuation levels?

Edit Is it possible that, for example, the healthcare sector has shifted from a stable basic business to a more growth-oriented new innovation, both in the pharmaceutical industry and increasingly in companies like Nightingale Health?

Does current technology also enable industrial companies to have more characteristics of growth companies? An elevator company used to make elevators, but now IoT and applications are a key part of the business?

23 Likes

I think CAPE will continue to be a reasonable indicator of over/undervaluation, but I would be careful about drawing any hard and fast rules about what is “expensive” and what is “cheap.”

I’m not entirely sure how comparable net profits are even to the world of 20, let alone 50, years ago.

For example, how does CAPE account for the ever-growing share of intangible assets in investments? Have accounting practices remained the same over long periods? Accepted valuation multiples can also theoretically be derived from companies’ ability to create value; have returns on invested capital remained unchanged over time, or has the cutting edge of the corporate world improved in that area?

For example, while traditional factory investments appear as depreciation on the income statement over a long period, not all investments in intangibles are capitalized on the balance sheet and they appear front-loaded on the income statement compared to traditional investments.

Although the sustainability of the profitability of many S&P 500 companies can justifiably be critically examined, there are also larger and larger players whose profit levels are not yet anywhere near their trimmed potential.

These are just scattered thoughts without any firm conclusions. Except perhaps that I wouldn’t let even a high CAPE scare me away from investing in North America if I found attractive investment opportunities there.

16 Likes

Shouting from the next table, there has actually been quite a significant change here. The median ROIC (Return on Invested Capital) of the S&P 500 (according to McKinsey data) hovered around 10% for decades but jumped to over 15% in the early 2000s, where it has remained since.

I have previously talked about the “value driver” formula here. If we illustrate this change with it, assuming the cost of capital is 8%, growth is 5% (the S&P 500’s nominal earnings growth from 1945–2022 has been approximately 7%), and ROIC is 10%, then a “fair” P/E ratio would be 17x. The S&P 500’s P/E has hovered around 15, based on realized earnings, from 1945–2000, which is not an entirely unreasonable figure.

If ROIC is 15%, the fair P/E would be 22x with the same assumptions. The S&P 500’s P/E, based on realized earnings, has mostly been above 20 in the 2000s, so again, this simple calculation seems to align somewhat with reality.

However, goodwill has been removed from this ROIC. Especially in recent decades, a lot of it has been generated through acquisitions. If goodwill were included, ROIC would certainly be lower, but I don’t have data on that. McKinsey’s epic does, however, show that at the sector level, pharmaceutical companies’ ROIC without goodwill has soared to as much as 60% on average in the 2000s, but with goodwill, it’s under 20%, yet still higher than before.

All in all, it can be concluded that companies, either by improving capital efficiency and/or improving margins, are generally better than before, which, if continued, maintains a higher fair valuation level until the state of affairs changes again.

53 Likes
  • S&P 500 @ $3753
  • CAPE 27.7x
  • Inflation-adjusted average 12-month EPS for the last ten years $135.7

Let’s add a good 10% more based on a 2% p.a. growth in volumes.

So, normalized, noise-filtered 12-month S&P 500 EPS right now is $150?

  • too optimistic estimate
  • too pessimistic estimate
  • just right!
0 äänestäjää
5 Likes

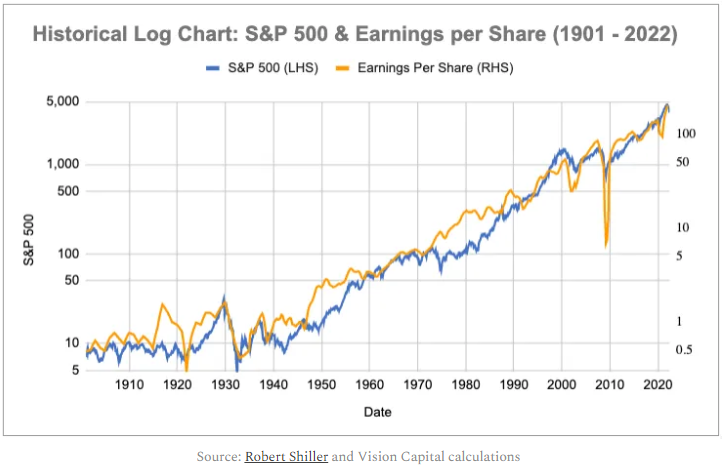
In the long run, one of the most important graphs (IMO) would be the development of the index (S&P 500) and EPS development combined in the same image. These are surprisingly rarely seen anywhere.

Please post them in this thread as well :slight_smile:

20 Likes

https://www.macrotrends.net/1324/s-p-500-earnings-history

You can easily zoom into interesting periods there.

13 Likes

Aiheeseen liittyen tässä kirjoituksessa tarkasteltu mistä TSR eli Total Shareholder Return (ilman osinkoja) on muodostunut aikavälillä 2003 - 2021. Tarkasteltuna ilman osinkoja kokonaistuotosta ~95% on vastannut EPS kasvu.

Given what we have laid out so far, you, you should not be surprised to learn that over the long-term, it is earnings growth, supported by revenue and profit growth, that drives the stock market higher, and to a much lesser extent, valuation multiples.

8 Likes

On a linear compound interest scale, that’s a bit worrying. On a log scale, something like 150-170 EPS no longer feels quite so distant.

7 Likes

Similar thoughts to those in the tweet thread below.

https://twitter.com/macroalf/status/1584236942224687104?s=46&t=AkMhzSXYu8MctmZ41WeJkQ

As a comment to another tweet thread, alternative 2, even though it’s not that popular. It’s not the tweeter’s first guess at the bottom in recent months.

https://twitter.com/jukkalepikko/status/1583850560603975682?s=46&t=AkMhzSXYu8MctmZ41WeJkQ

17 Likes

Indeed it was a sharp move.

It’s always better to look forward than backward.

But looking back at the latest data, the inflation situation is the worst in 40 years and the labor market is very tight.

The Fed whisperer’s (Fed-kuiskaajan) reflections did not fall on favorable ground in the bond markets.

10 Likes

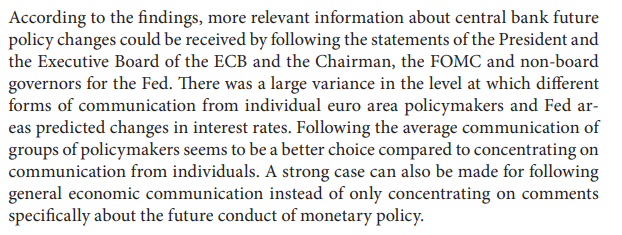
This is absolutely true. Central bank communication also contains a lot of “noise,” especially when economic uncertainty is high. In fact, I’ve researched this topic with a former doctoral colleague of mine, and a paper on the subject was recently published. In a nutshell, the results indicate that it’s worth listening carefully to governors and board members, as their “predictive power” is at the highest level (excerpt from the study below). This is especially important to remember now, as the volume of communication from central banks is increasing:

19 Likes

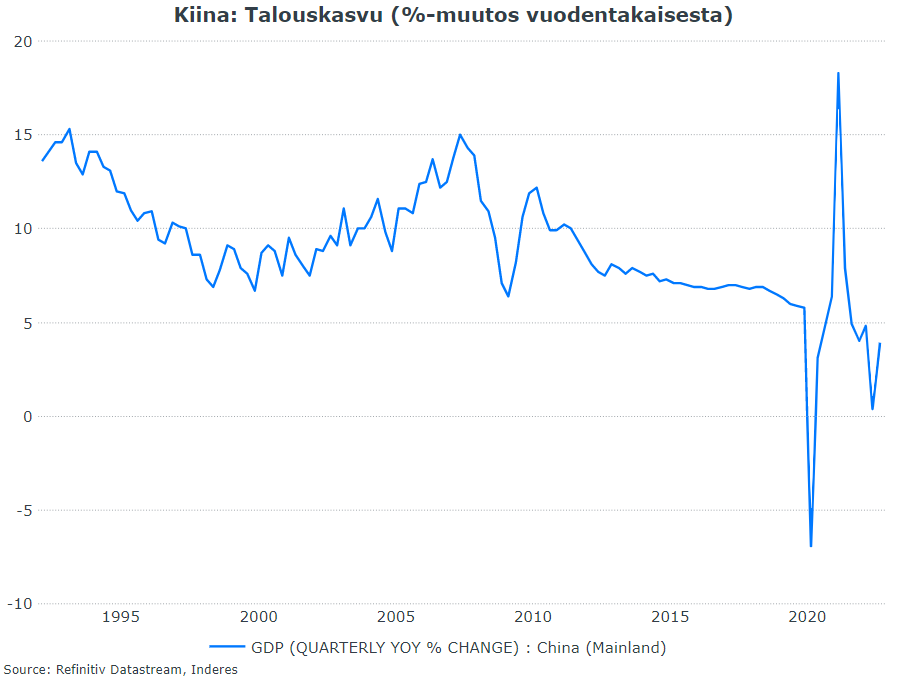
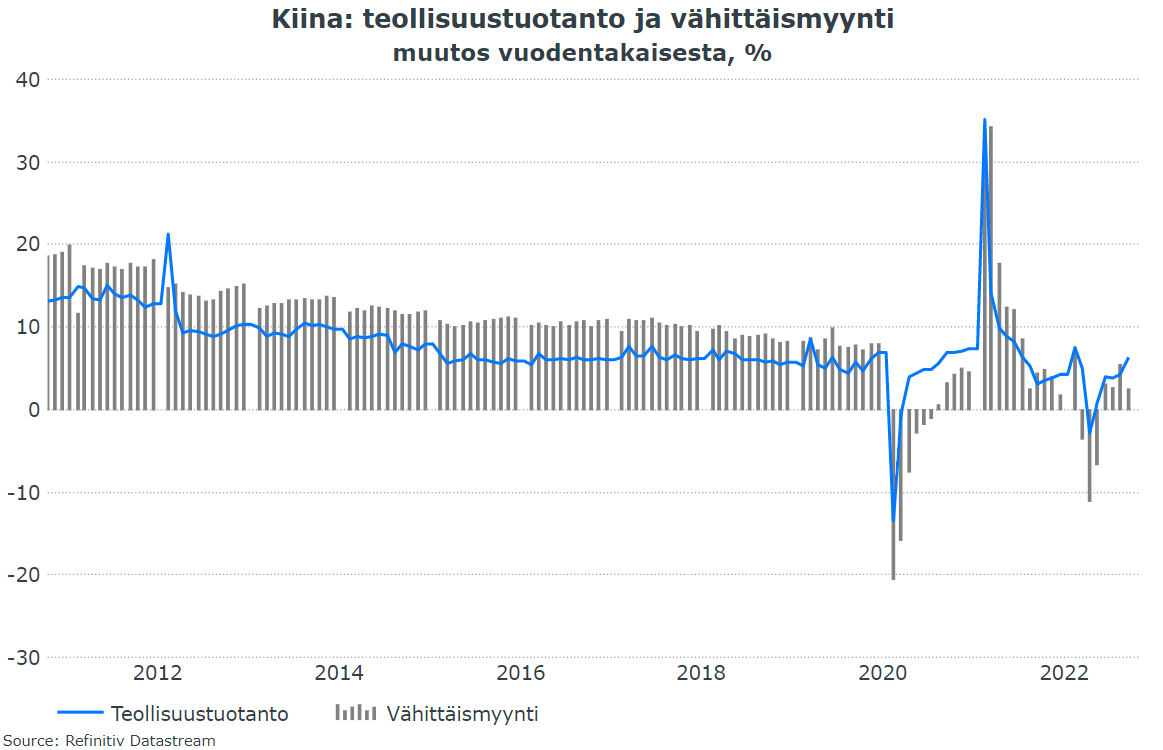
More on this morning’s macro overview. China’s Q3 economic figures were released immediately after Xi’s third term was confirmed, and the figures were slightly positive compared to market expectations. However, retail sales are still lagging, meaning consumers are cautious. Additionally, housing prices continue to fall.


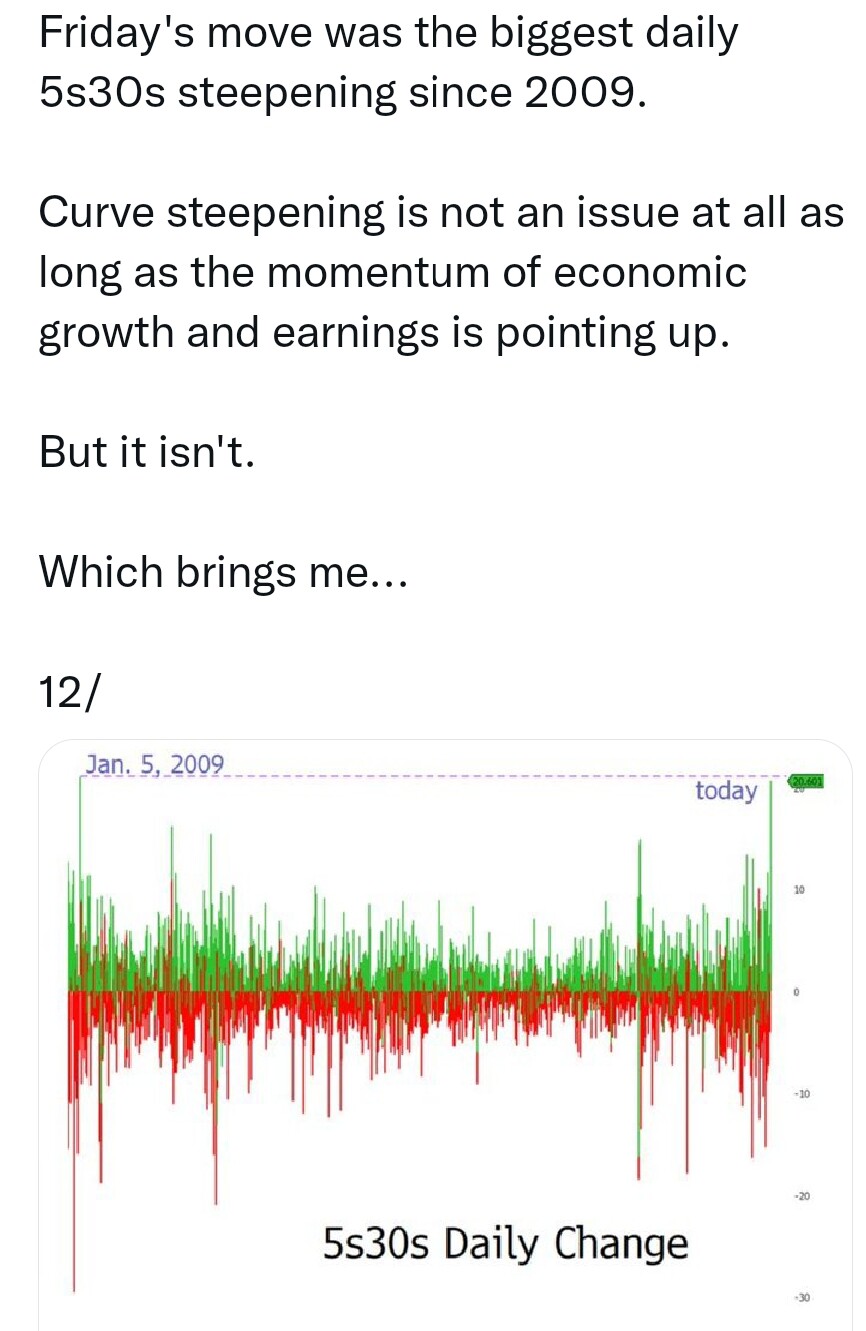
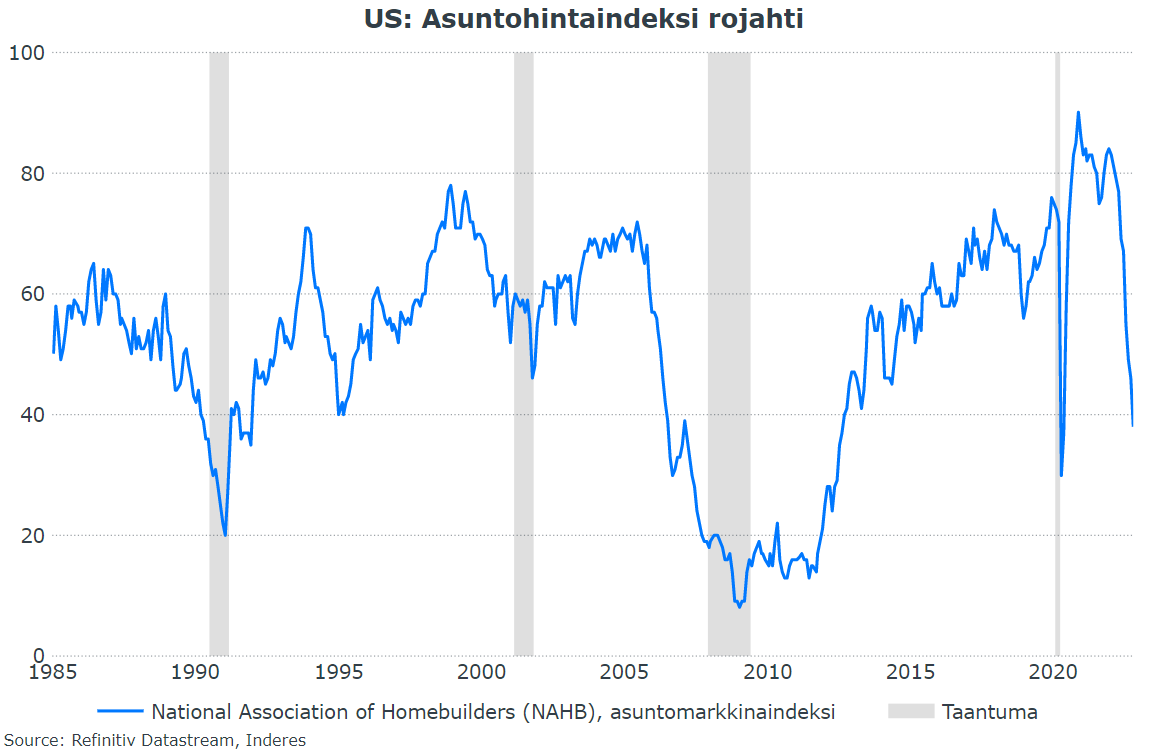
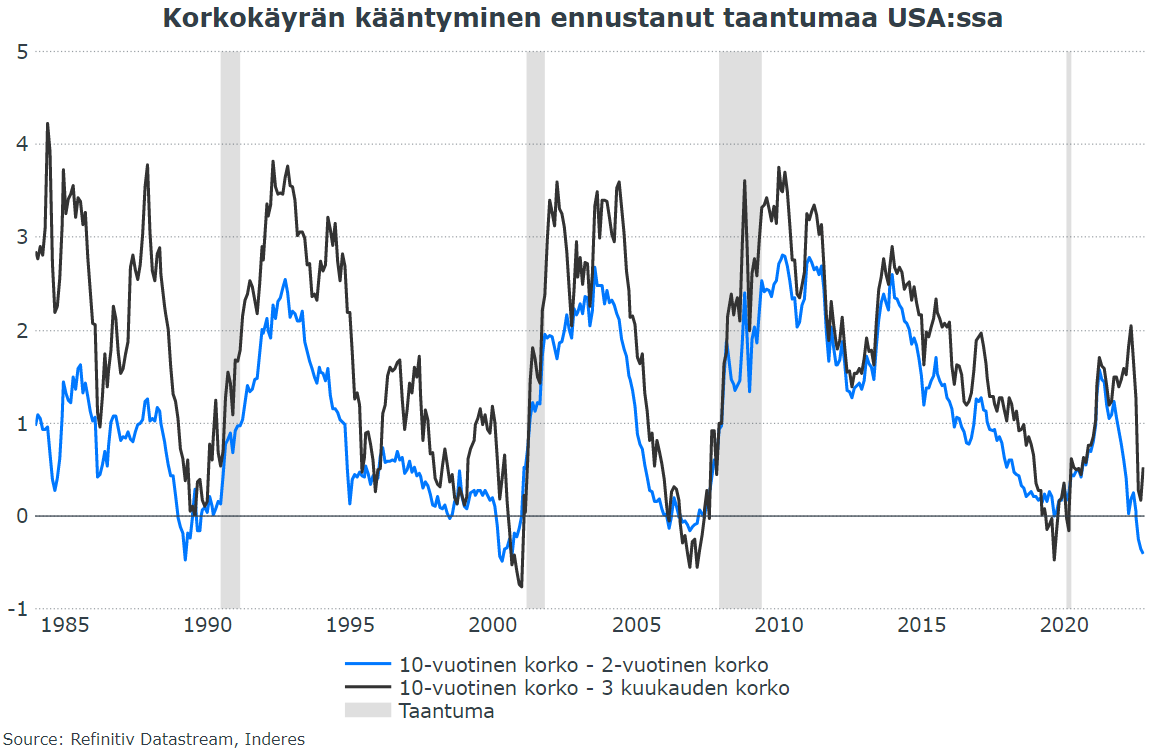
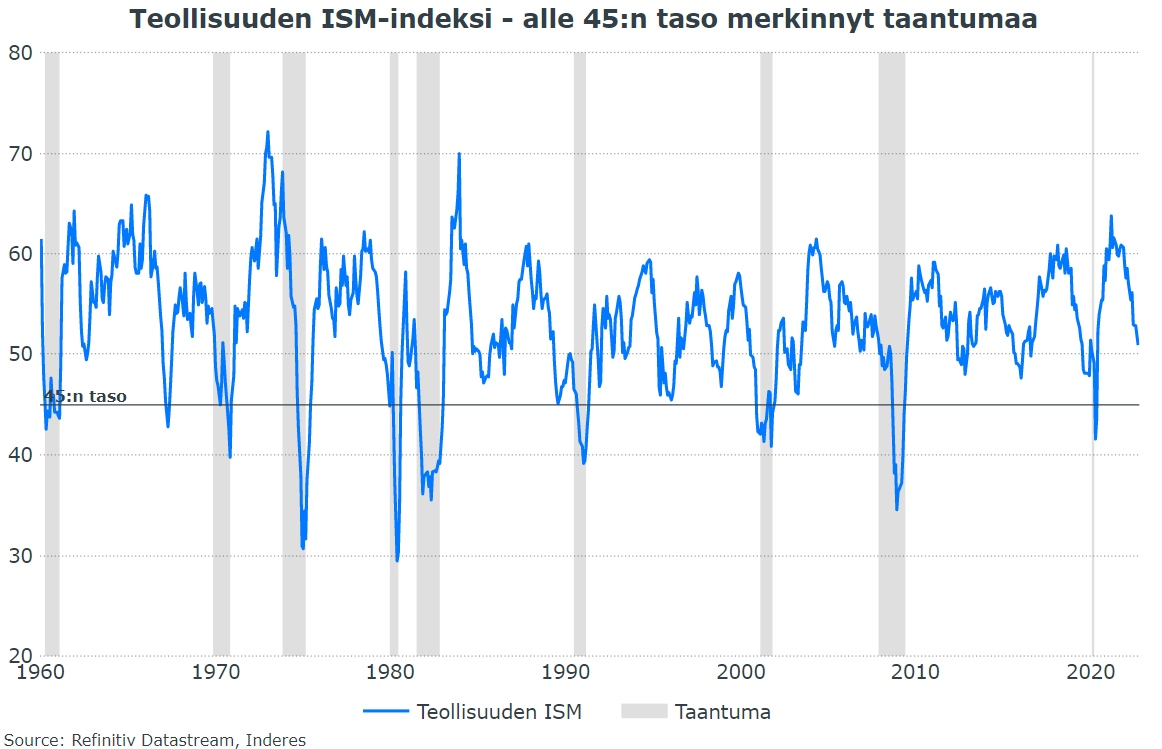
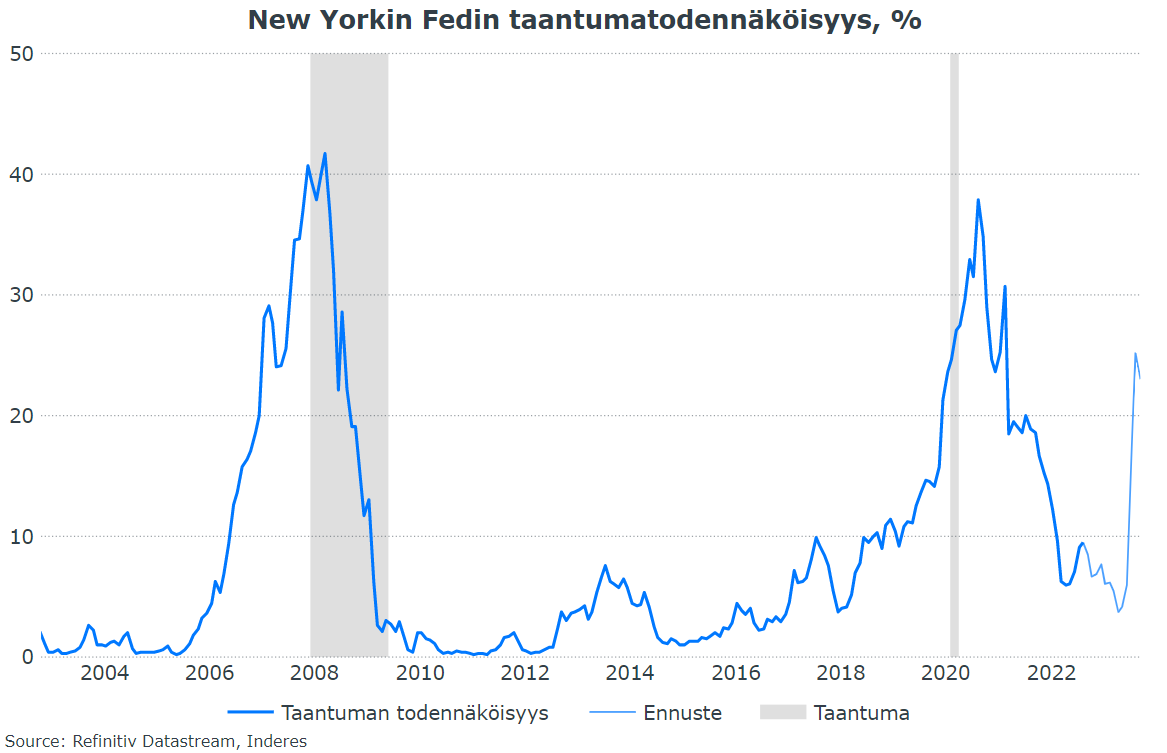
Another point relates to recession indicators, which have also been discussed here. On Twitter, there were rumors of a recession last week because the NAHB housing market index dropped to alarming levels (which have always been followed by a recession). This is an interesting signal, especially since the housing market has been the first to falter when the economic cycle turns. However, other recession indicators (yield curve, industrial ISM) are still “in the clear,” meaning there’s food for both bears and bulls. The full review can be read here.


37 Likes

Below is an article by Jukka Oksaharju on the market situation. It discusses the following:

  1. Rapid rise in interest rates, not so much the level of interest rates
  2. Rapid rise and level of inflation
  3. High starting point for the decline in valuation multiples
  4. Listed companies are not the same as the real economy
  5. The market tends to look 6–12 months ahead

The Helsinki Stock Exchange has fallen by more than 20 percent in a year. A decline of this magnitude combined with a market that has been trending downwards for about a year generally meets the hallmarks of a downtrend.

At the same time, it has become evident that this is not merely a stock market crisis. Interest expenses for (housing) debtors are also sharply rising, and the general price level is currently accelerating at its fastest pace in 40 years. The energy crisis is also likely to add its own flavor to the mix during the upcoming winter. Right now, there are undoubtedly several drivers of market change present.

https://www.nordnet.fi/blogi/kaantyiko-porssi-jo-nousuun-viisi-ajatusta-markkinatilanteesta/?utm_campaign=action_bloglinks&utm_medium=social&utm_source=facebook&utm_content=feed_jukkaoksaharju&utm_term=organic&fbclid=IwAR3hEDHCgnOKQknPhfoLyeuABUYKoOMXP0SeccyRpykJZS07f3NS4Rkm_DI

22 Likes

Here’s @Antti_Jarvenpaa’s 7.5-minute video on interest rates. :point_down:

Topics:
00:00 Introduction
01:10 Welcome back, interest expenses
03:19 The shorter, the better – or maybe not
04:50 100-year bonds
06:02 The trend of indebtedness

10 Likes

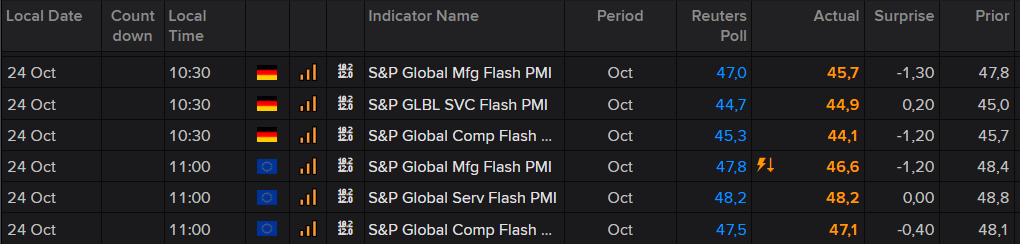
A bunch of Eurozone PMI (Purchasing Managers’ Index) figures were just released, bringing a series of negative surprises. The industrial recession is real, with service sector figures higher but weakening.

70 Likes


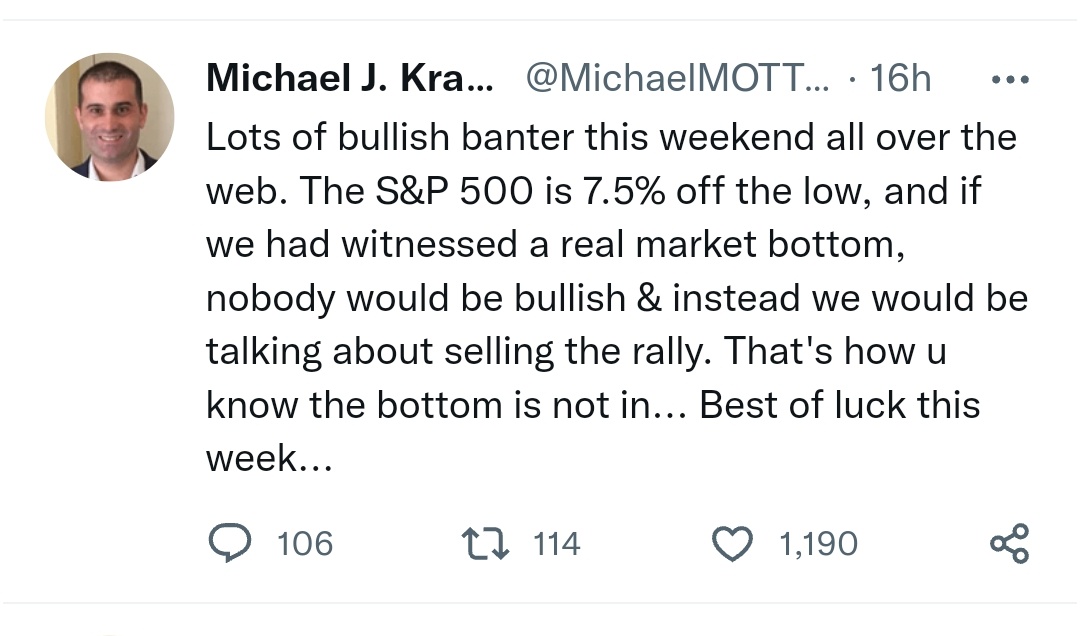
Kramer’s thoughts on Twitter about a potential market bottom.

7 Likes

Financial Sector Thread

Comments? Is there evidence for this from history?

1 Like

Yes. In addition, banks are starting to earn interest on their deposits in the money markets, which encourages them to lend less.

5 Likes

I was browsing the transcript of a small bank I follow, here’s a pretty concrete example of how the bank is in danger of being crushed between turning rates:

In practice, they are not trying to inflate their loan portfolio now, so that things don’t go awry if interest rates continue to rise on the short end.

5 Likes

The “sell everything” signal will probably never come. A market bottom is not a clear and easy event to identify at the moment it happens, when stock market movements have to be analyzed in real time. It is precisely conflicting sentiments that make analysis difficult. In retrospect, it is easier to develop a narrative as to why the market bottomed out at a particular moment.

26 Likes