The sentiment seems quite sour when people aren’t even wondering about the poor returns anymore, but have instead moved on to comparing S-Group bonus levels.
37 Likes
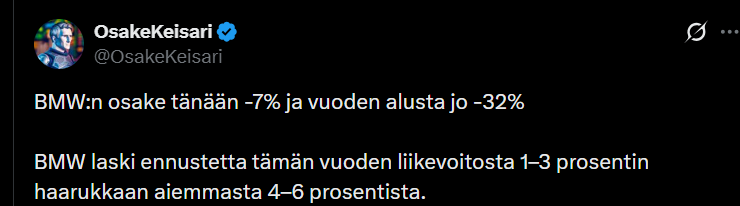
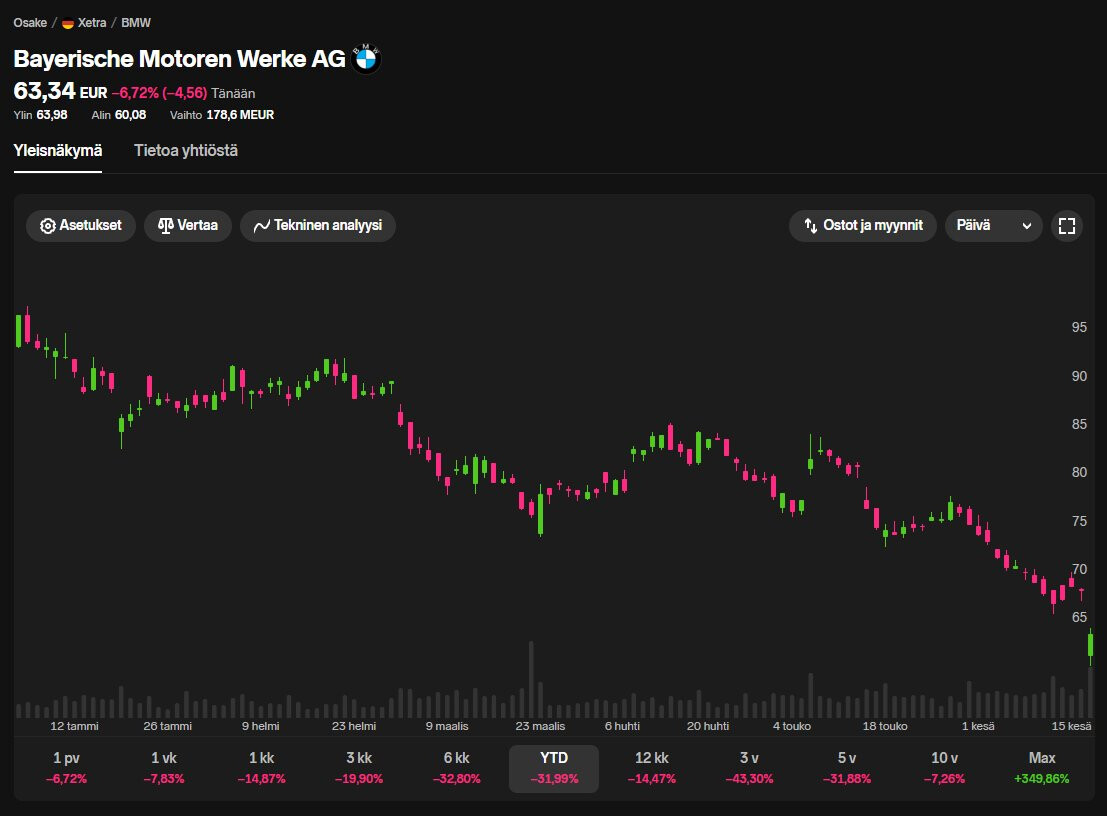
@OsakeKeisari and the Bayerische Motoren Werke share price ![]()
https://x.com/OsakeKeisari/status/2067233929401147725

41 Likes
A small comparison, Harvia’s share price and earnings for the years 2019-2025:
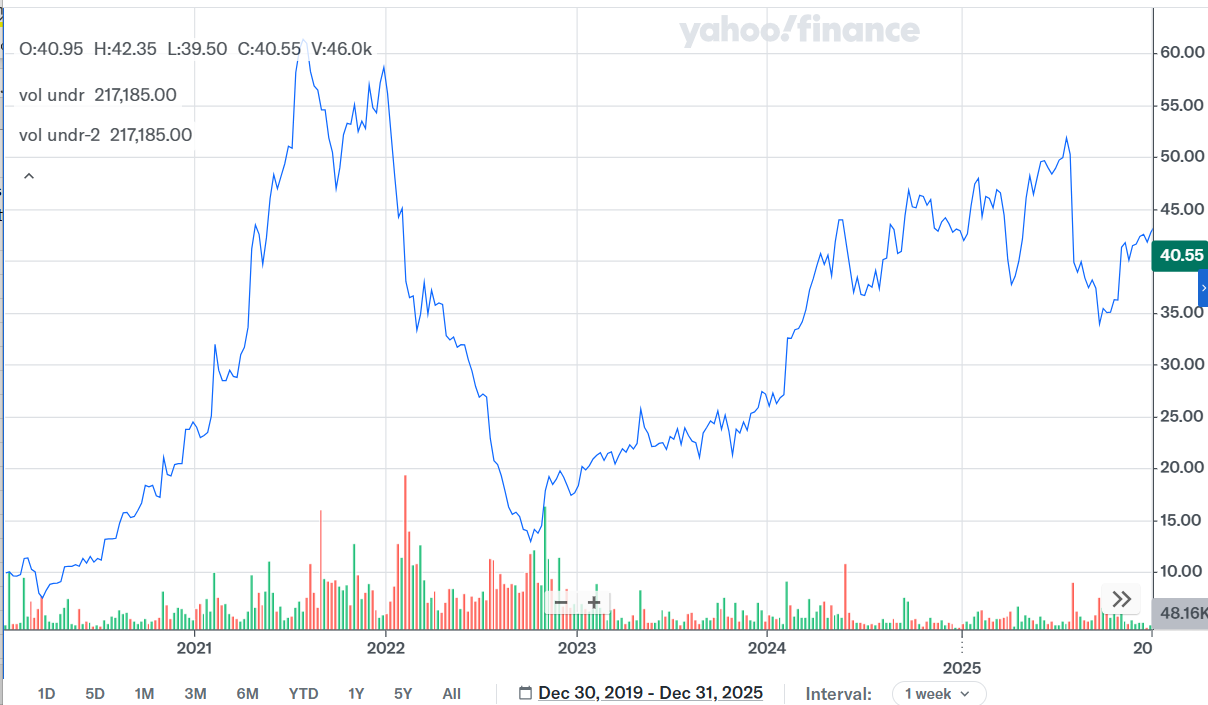
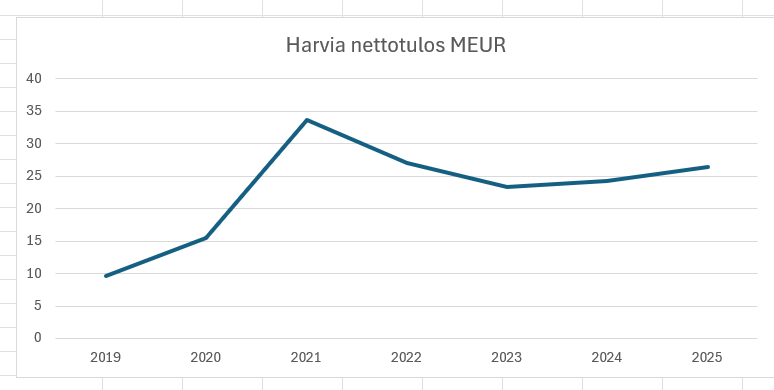
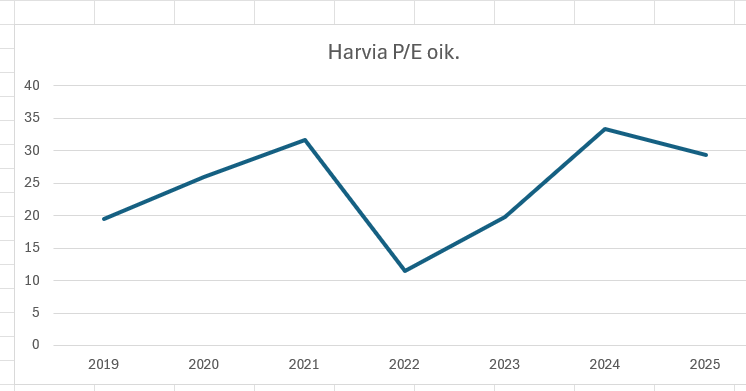
As can be seen, the share price has loosely followed the earnings trend, except that for some reason in 2022, the valuation multiple collapsed to rock bottom, causing a deep decline in the share price.
14 Likes
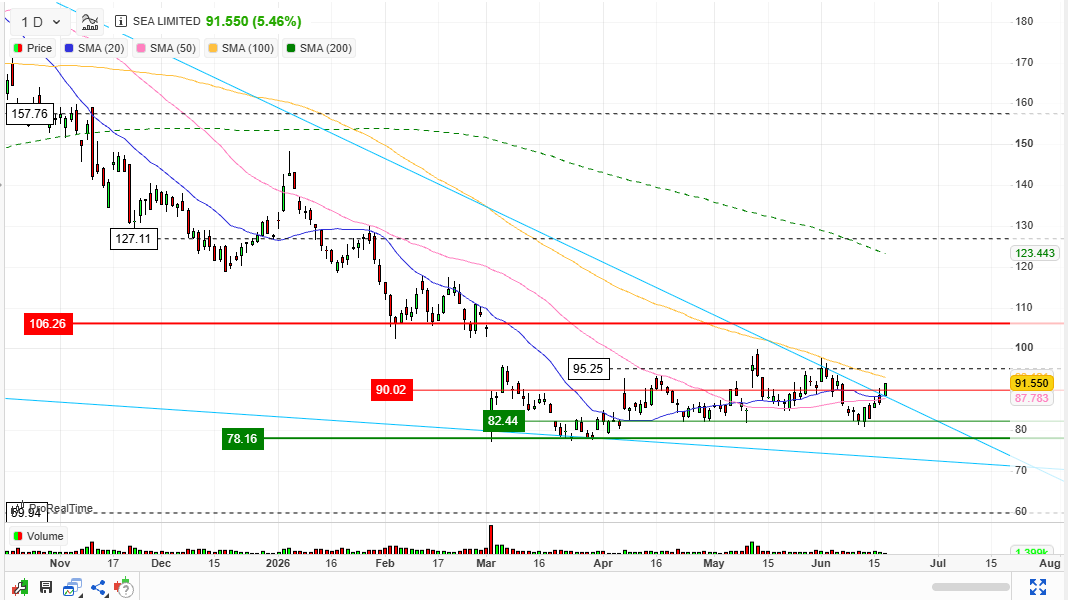
The rocket is out of order. I repeat. The rocket is out of order. Sell your grandmothers and your belongings.
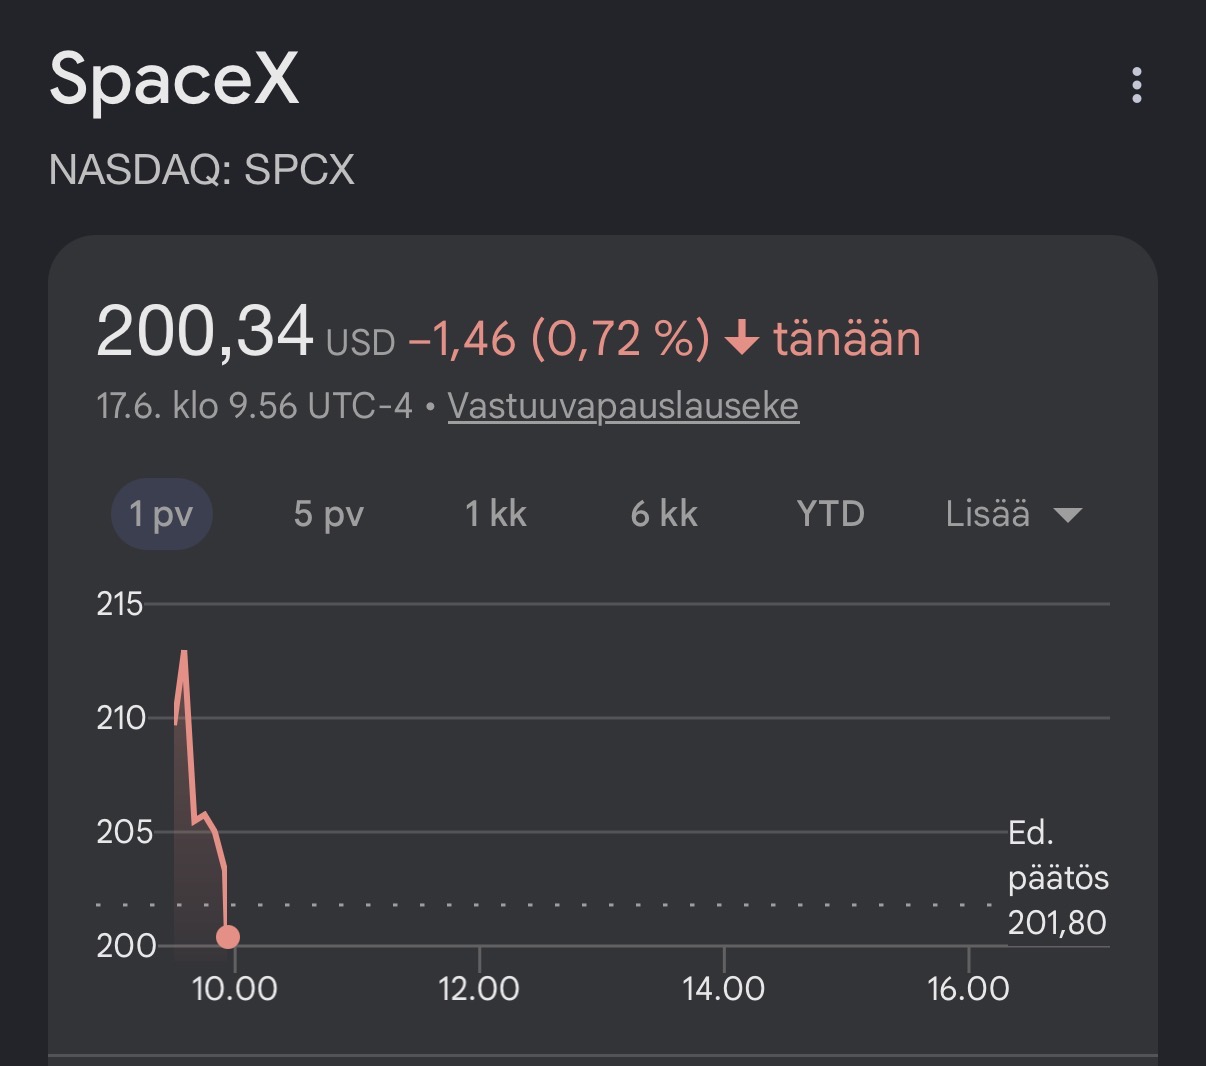
25 Likes
Any guesses on whether the “space explorer” (avaruuden tutkailija) has peaked, or was it just closing the gap before a new spaceflight?
6 Likes
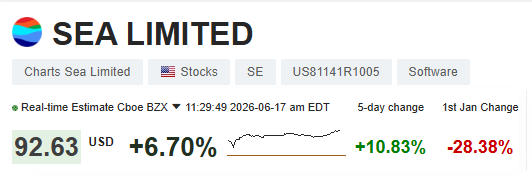
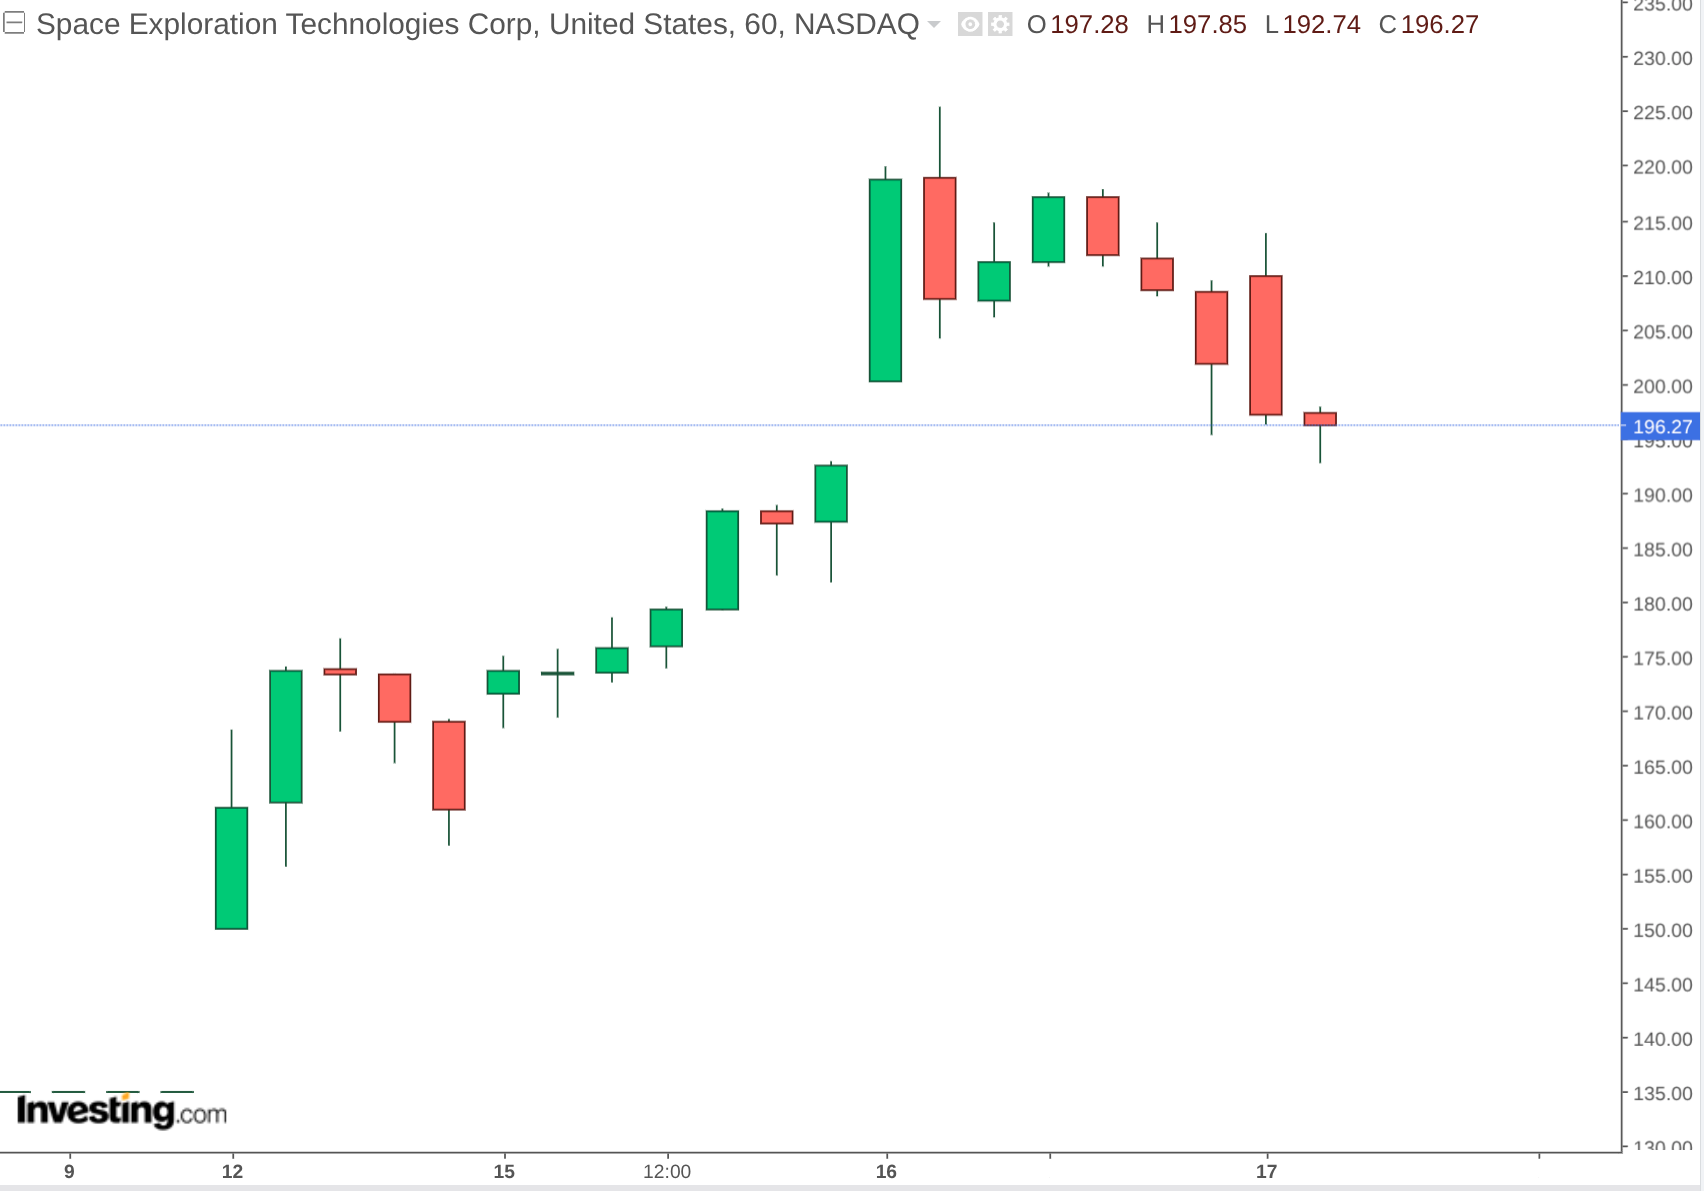
I have to admit, I’ve been pulling my hair out a bit with this one and doubting my own fundamental analysis (funda) more than with any other stock (and well, the practice continues :D). But OH MAN, it feels good to have a little break from the constant downward red surge.
I’m no expert in technical analysis, but as I understand it, breaking this downward trendline to the upside shouldn’t be a mega-bear signal for the future, at least. Let’s hope the journey continues upwards.
11 Likes
Moderna rose over 33% in a week, with today’s closing price at $61.80.
Presumably, the main reason for the rise is this Tuesday’s event: “positive FDA briefing documents eased concerns over its flu vaccine approval”.
I interpret the market’s reaction to mean that the Trump administration’s “bullying” phase towards Moderna and mRNA technology is starting to become a thing of the past. This was, of course, already foreshadowed by the dismissals of FDA big shots Marty Makary and Vinay Prasad in the spring.
I bet that Moderna’s upward trend will continue from here. We will be higher by the beginning of August.
1 Like
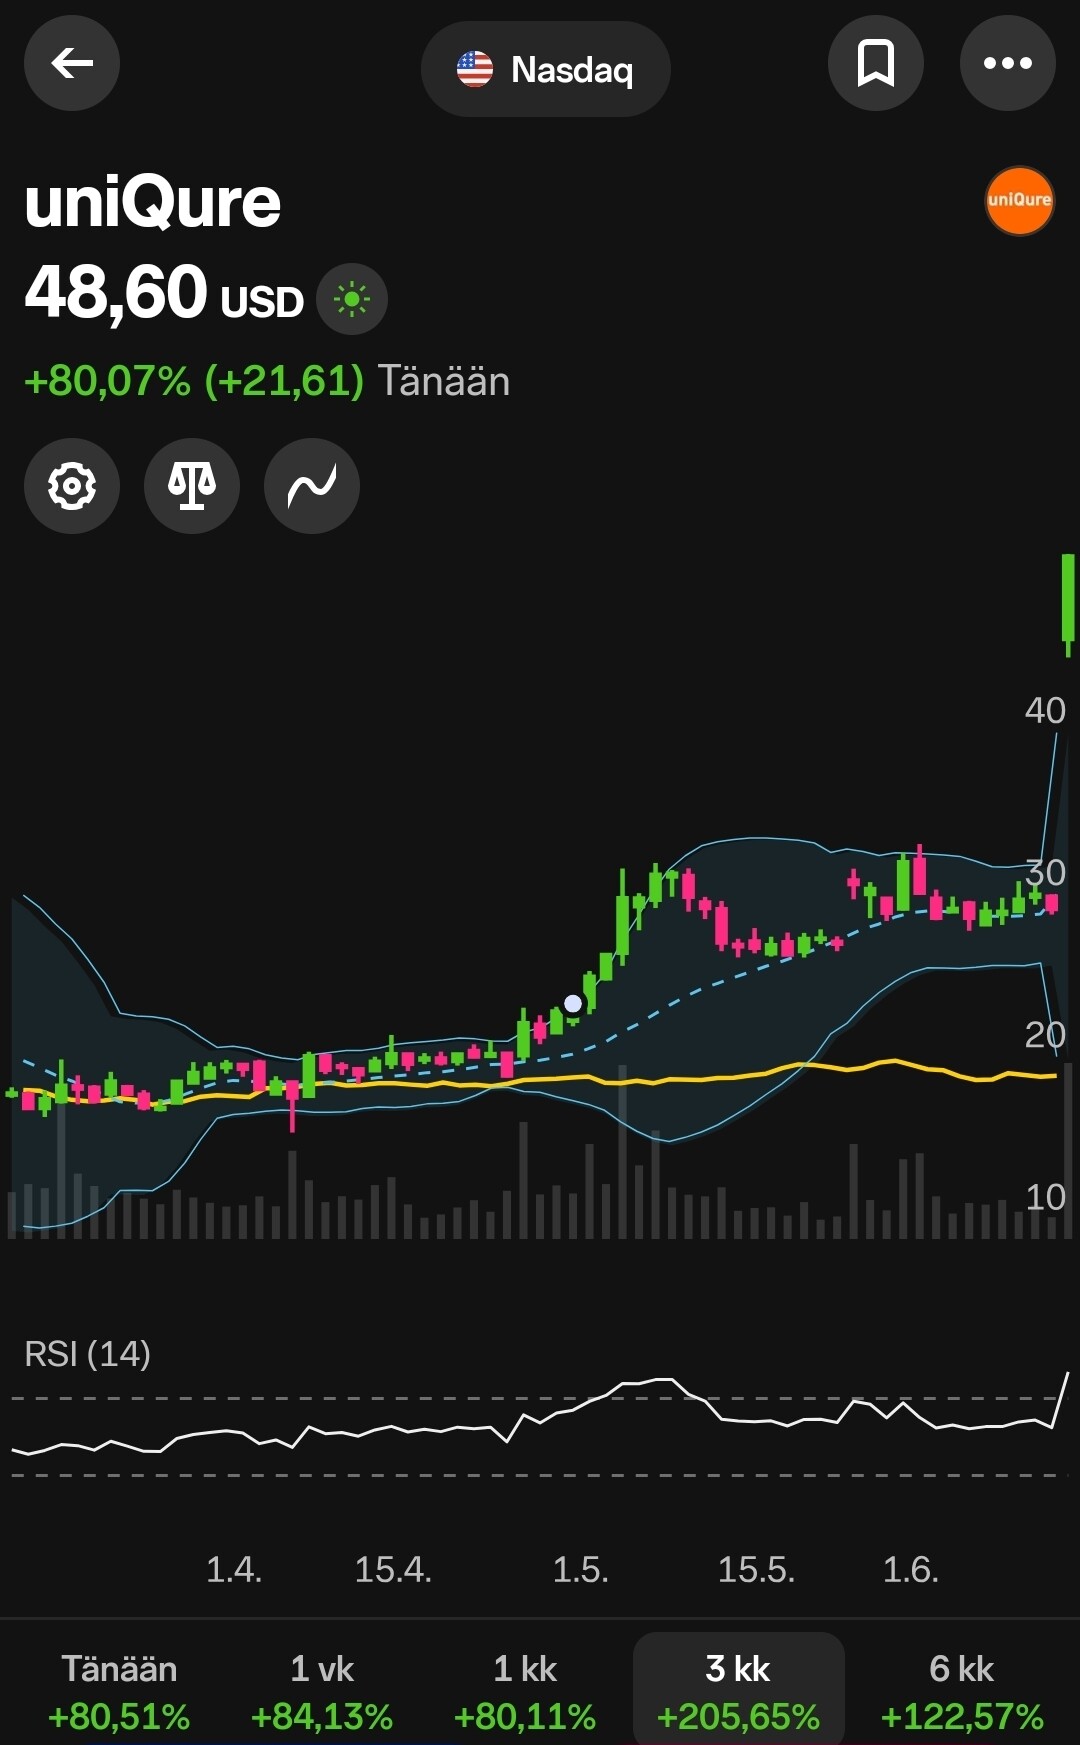
In startup investing, the rule of thumb is that returns come from a very small number of companies whose share prices multiply manifold. However, a large portion of companies either stagnate or even go bust.
My question is: how has this played out on the First North list? What is the ratio of “multipliers” versus those that have gone into a steep decline? (After all, the share prices of many firms have collapsed.) I tried to look into this but couldn’t easily find a way to figure it out.
The intention isn’t to rub salt in the wounds, but rather to get some clarity on this; there’s a lot of talk about big disappointments and the index-level performance has certainly been dismal, but it would be nice to hear about the big winners too and their number relative to the whole list. ![]()
Edit: So there are a total of 48 companies on the list. The number has certainly grown since the early days, so many companies have quite a short history.
PS. Is this the right thread?
6 Likes
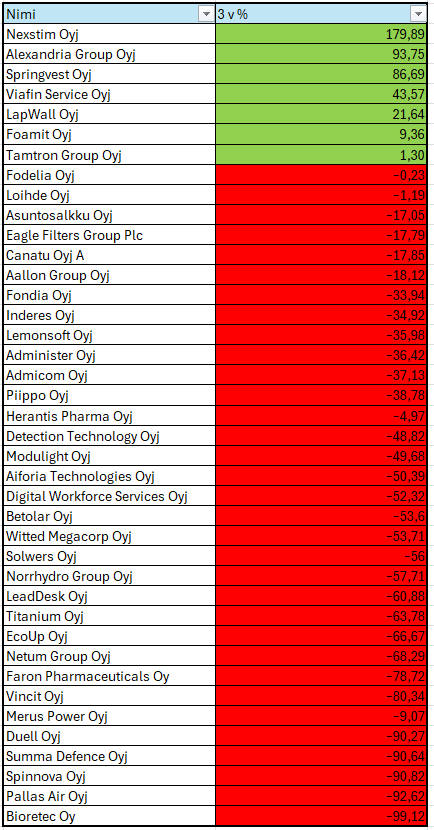
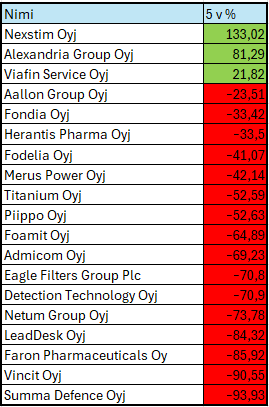
I’m not sure if these will help, but I made them anyway - hopefully, some of you will find them useful ![]()
3-year percentages
5-year percentages
10-year percentages
37 Likes
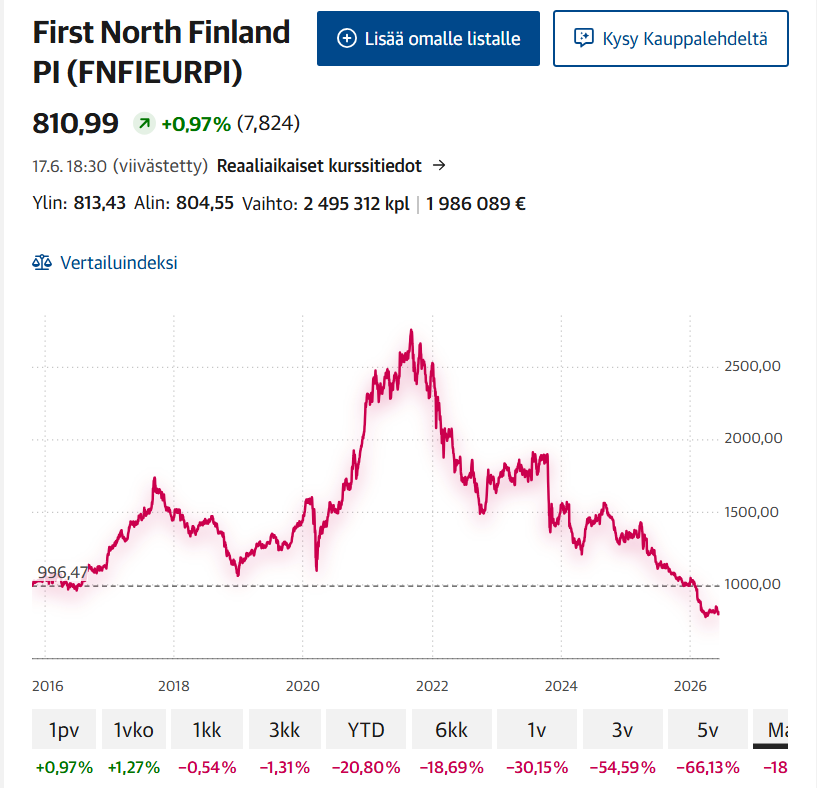
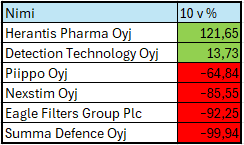
Thank you very much, this clarifies things! I’ll have to examine these more closely; I’ll quickly highlight those “10-year percentages” here:
10-year percentages
If one had invested their money in an OMXH25 ETF for 10 years, the dividend-adjusted return would have been +192%, which is better than any of those.
It’s somewhat surprising that among those inherently promising small-cap companies, so few have generated even a positive return over, for example, a 5-year period, let alone beaten the index. The same goes for the three-year period, though even more starkly, as the list of companies is longer (the observation period is, of course, too short to draw definitive conclusions). However, one would expect to find some of those growth companies that multiply in value among them.
Edit: I used that ETF as an example because return data is quickly available and it was an actual investment instrument ten years ago. The index differs slightly from that, but it gives a good indication of the order of magnitude.
12 Likes
It is also worth noting that companies have also:
- Moved from First North to the Main Market: e.g., Kempower, Gofore, Nightingale, Relais, Remedy, Toivo, Verkkokauppa.com
- Been acquired and delisted: e.g., Avidly, Bilot, and Heeros
- Relocated elsewhere: at least Nyab (to the Stockholm Stock Exchange)
- Gone bankrupt: at least BBS Bioactive Bone Substitutes
The example lists are not exhaustive.
44 Likes
As an additional example, Admicom.
Up +155% from its IPO price, even though the five-year percentage is -69%. It seems to have been listed for about 9 years, so it didn’t make the ten-year list. It would have been at the top of that list.
12 Likes
Recent IPOs and small growth companies, which are abundant on First North, are empirically proven to be trash as a group. Perhaps one shouldn’t expect much performance from this index in the first place.
It makes you wonder how exceptional that period of low interest rates from 2009–2021 really was, when the First North All Share sextupled. Maybe this “mörnintä” (sideways/sluggish movement) is actually the more normal state of affairs ![]()
9 Likes
I wonder what’s making Edenred bounce like this. Trimmed my overweight position at the same time. In my opinion, it was indeed undervalued, but a +17% jump still seems quite strange.
I personally think that so-called First North “memeing” actually covers smaller companies on the main list as well. That is, if the mcap is in the tens or hundreds of millions, it belongs to this Helsinki small-cap basket. You can find well-performing companies in this group if you look at the last 3 years, but in a 5-year review, these are scarce. The starting point for a 5-year review is the rather unfavorable bubble peak, so perhaps a 3-year review is more enlightening in this case, if one makes a few picks. But indeed, over a 5-year period, only 21 companies (+ a few that listed during the period) out of about 150 have yielded positive returns. Among these positive performers, a significant portion has not produced returns “in line with expected returns,” so the yields are weak. During the same 5-year period, 15 out of 32 Helsinki Large Cap companies yielded positive returns, so we are talking about a completely different proportion than in small (/mid-sized) companies.
Among the so-called small-cap companies over a 3-year period, the following, among others, have performed really, really well or even outrageously (percentages are rough roundings):
Sotkamo Silver (800%), Bittium (600%), Endomines (600%), Kreate (230%), Nexstim (175%), Puuilo (140%), HKFoods (110%), Componenta (100%)…
There are many that have performed pretty much “in line with expected returns,” but here are my own picks (percentages are rough roundings):
Alma Media (45%), United Bankers (45%), Viafin Service (40%), and Ålandsbanken (35%)…
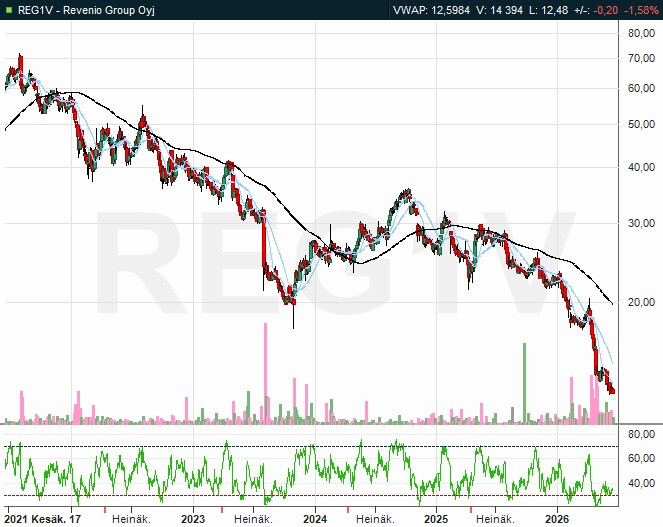
At the same time, there are naturally a huge number of poor performers. A few of my own picks from companies generally perceived as good/moderate (percentages are rough roundings): Talenom (-75%), Kamux (-70%), Revenio (-65%), Gofore (-65%), Kempower (-60%), Etteplan (-55%), Detection Technology (-50%), Boreo (-50%), eQ (-45%), Tokmanni (-45%), Remedy (-40%), Admicom (-40%), Oriola (-35%), Capman (-35%), Robit (-30%), Taaleri (-25%), Enento (-25%), Ponsse (-20%), Noho (-20%)…
Of course, there are significantly more companies offering returns between -30% and -99% than those mentioned above. At least on Nordnet’s site, you can quite handily select Helsinki Mid Cap, Helsinki Small Cap, and First North, after which you can sort by returns. Examining past returns might not be the most productive use of time from an investing standpoint, but it serves as a form of entertainment.
13 Likes
Juha Kankaanpää tweeted about Revenio’s performance ![]()
https://x.com/JuhaKankaanpaa1/status/2067529273594761252

18 Likes