This project has continued during the holidays with absolutely incredible results.
I trained an 11.2M parameter transformer with about 12 billion stock price tokens. Roughly a 3-day run on CSC’s supercomputer until the perplexity no longer dropped more than marginally, maybe once every 4-5 hours by luck.
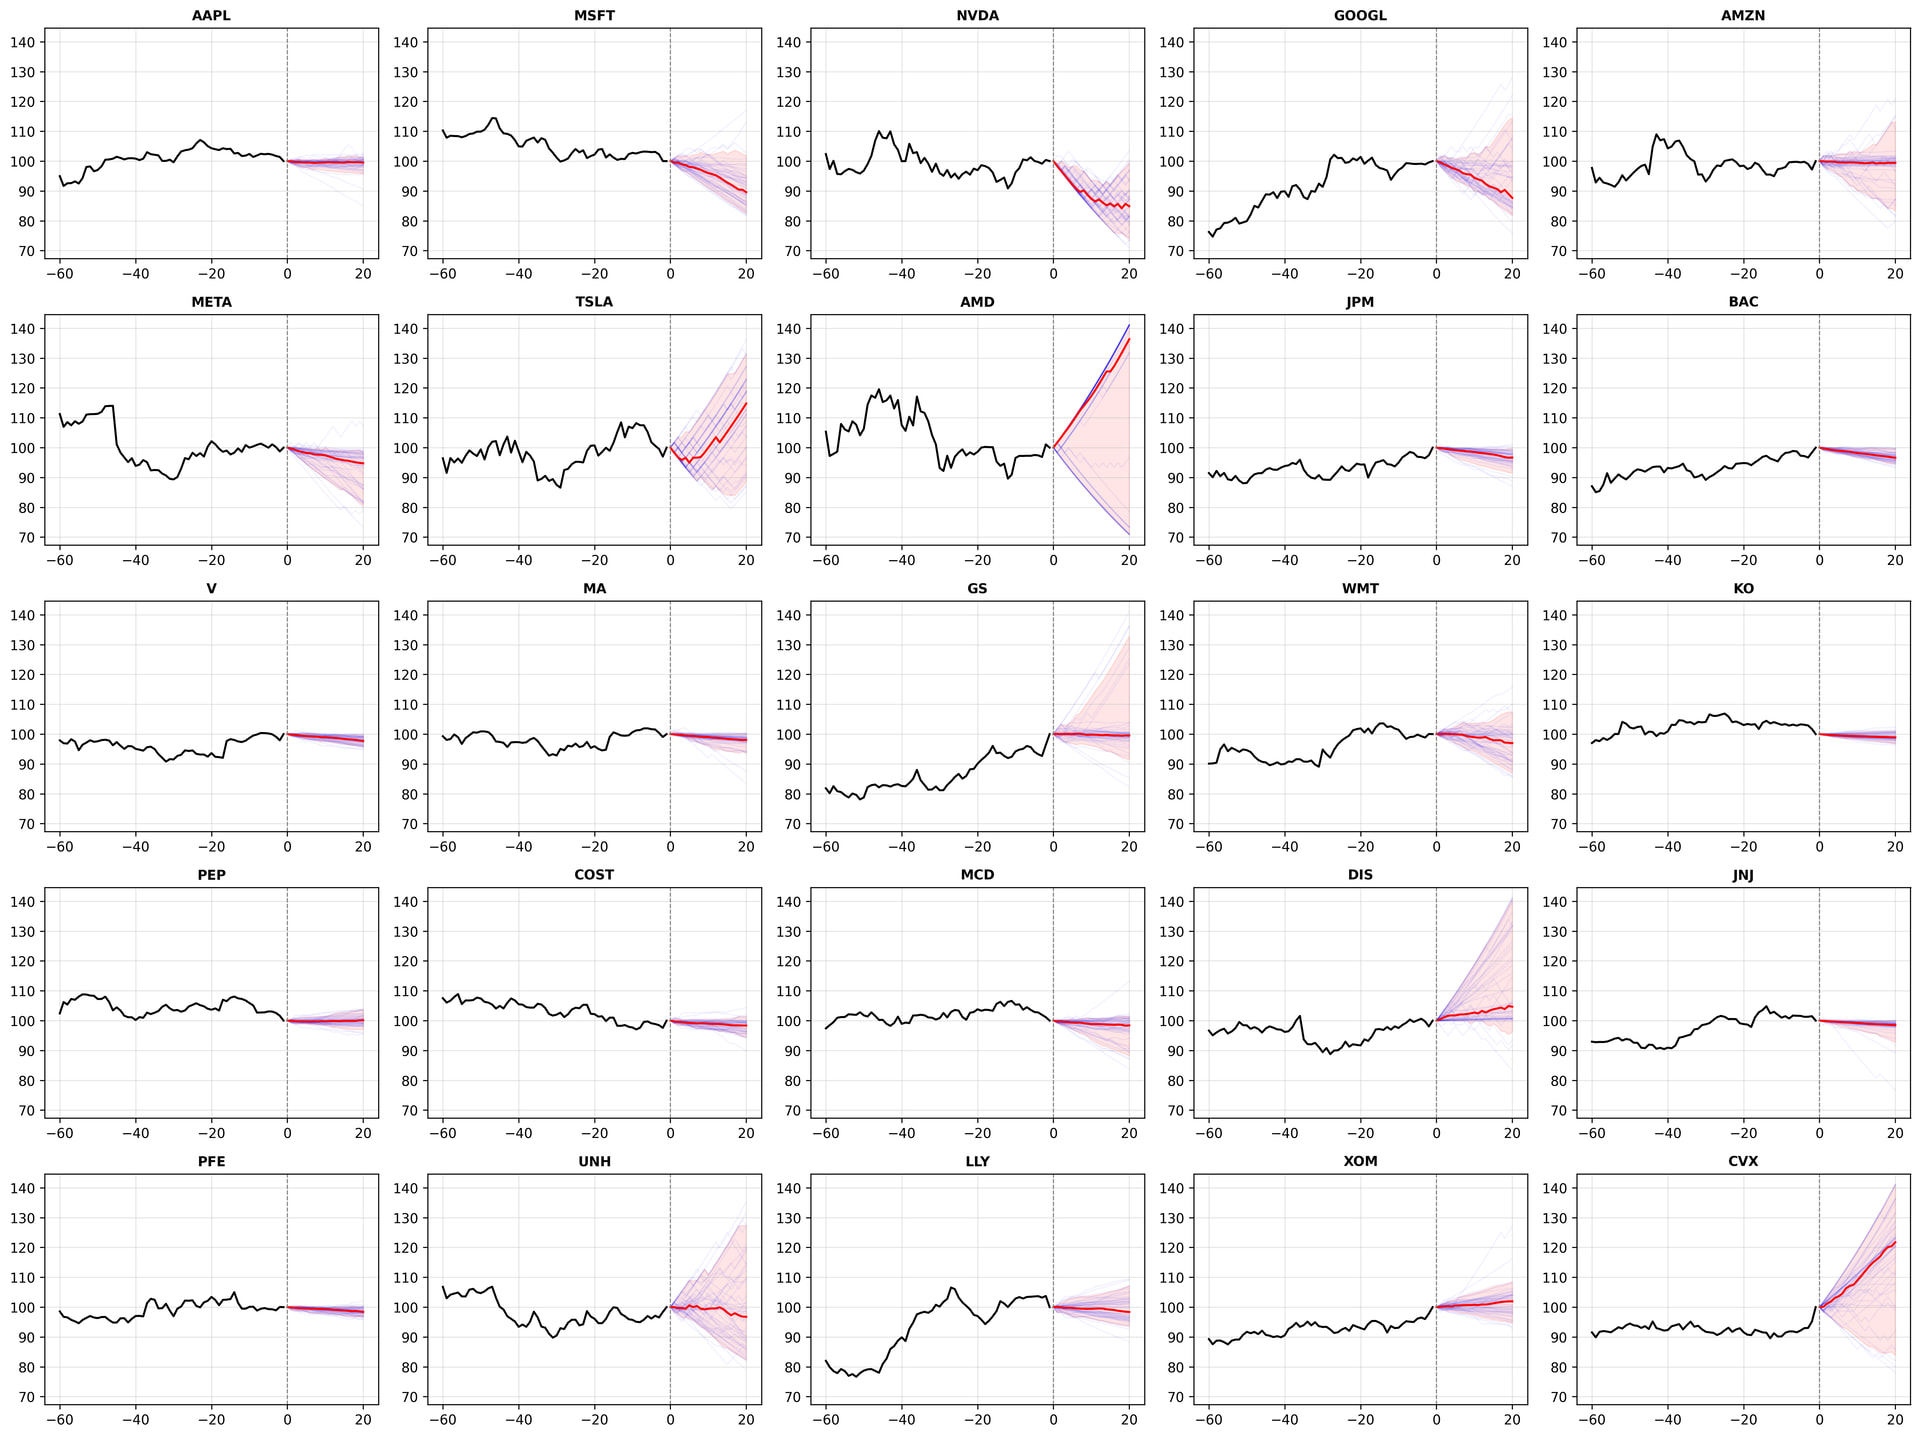
And a quick check of what the model predicts really dropped my jaw. Here are 50 t+20 predictions for each of the 25 tickers (median and 95% confidence interval - each prediction path is also shown faintly):
So the model doesn’t know at all which ticker it’s predicting - it only sees the end-of-day OHLC readings from the last 60 days. This is out-of-sample data: the model was trained on data ending in 04/20, and the prediction uses the latest price data.
The model picks up on things quite nicely:
The trend / momentum (on the other hand, it also dares to counter the trend in some places)
High and low volatility stocks (e.g., JNJ’s narrow tunnel vs. Tesla’s predictions going in every direction)
The shape of uncertainty (vs. a typical risk profile based on symmetric standard deviation)
I’ll share the code soon, if anyone wants to further develop it for their own needs.
Next, the idea is to see if this could generate returns and in what situations.
A possible further thought is to fine-tune this with reinforcement learning, so that I would actually put the model to trade and reward it for profits and punish it for losses. Let’s see when these will be finished.
A Reinforcement Learning further development project could be a very good fit here. The model would take all the stock’s forecast paths as input and predict the probabilities for Buy, Sell, and Hold recommendations based on them. Then, once the recommendation flips to the opposite side, the realized returns are calculated and used to train the model.
12 billion tokens (or more precisely 11.2 B) come from the following parameters:
689k backpropagation iterations
64 batch size
256 context window
689k x 64 x 256 = 11.2B tokens
There are about 300M observations in that dataset, so I ran the training for about 37 epochs, as the validation set loss came down nicely without signs of overfitting.
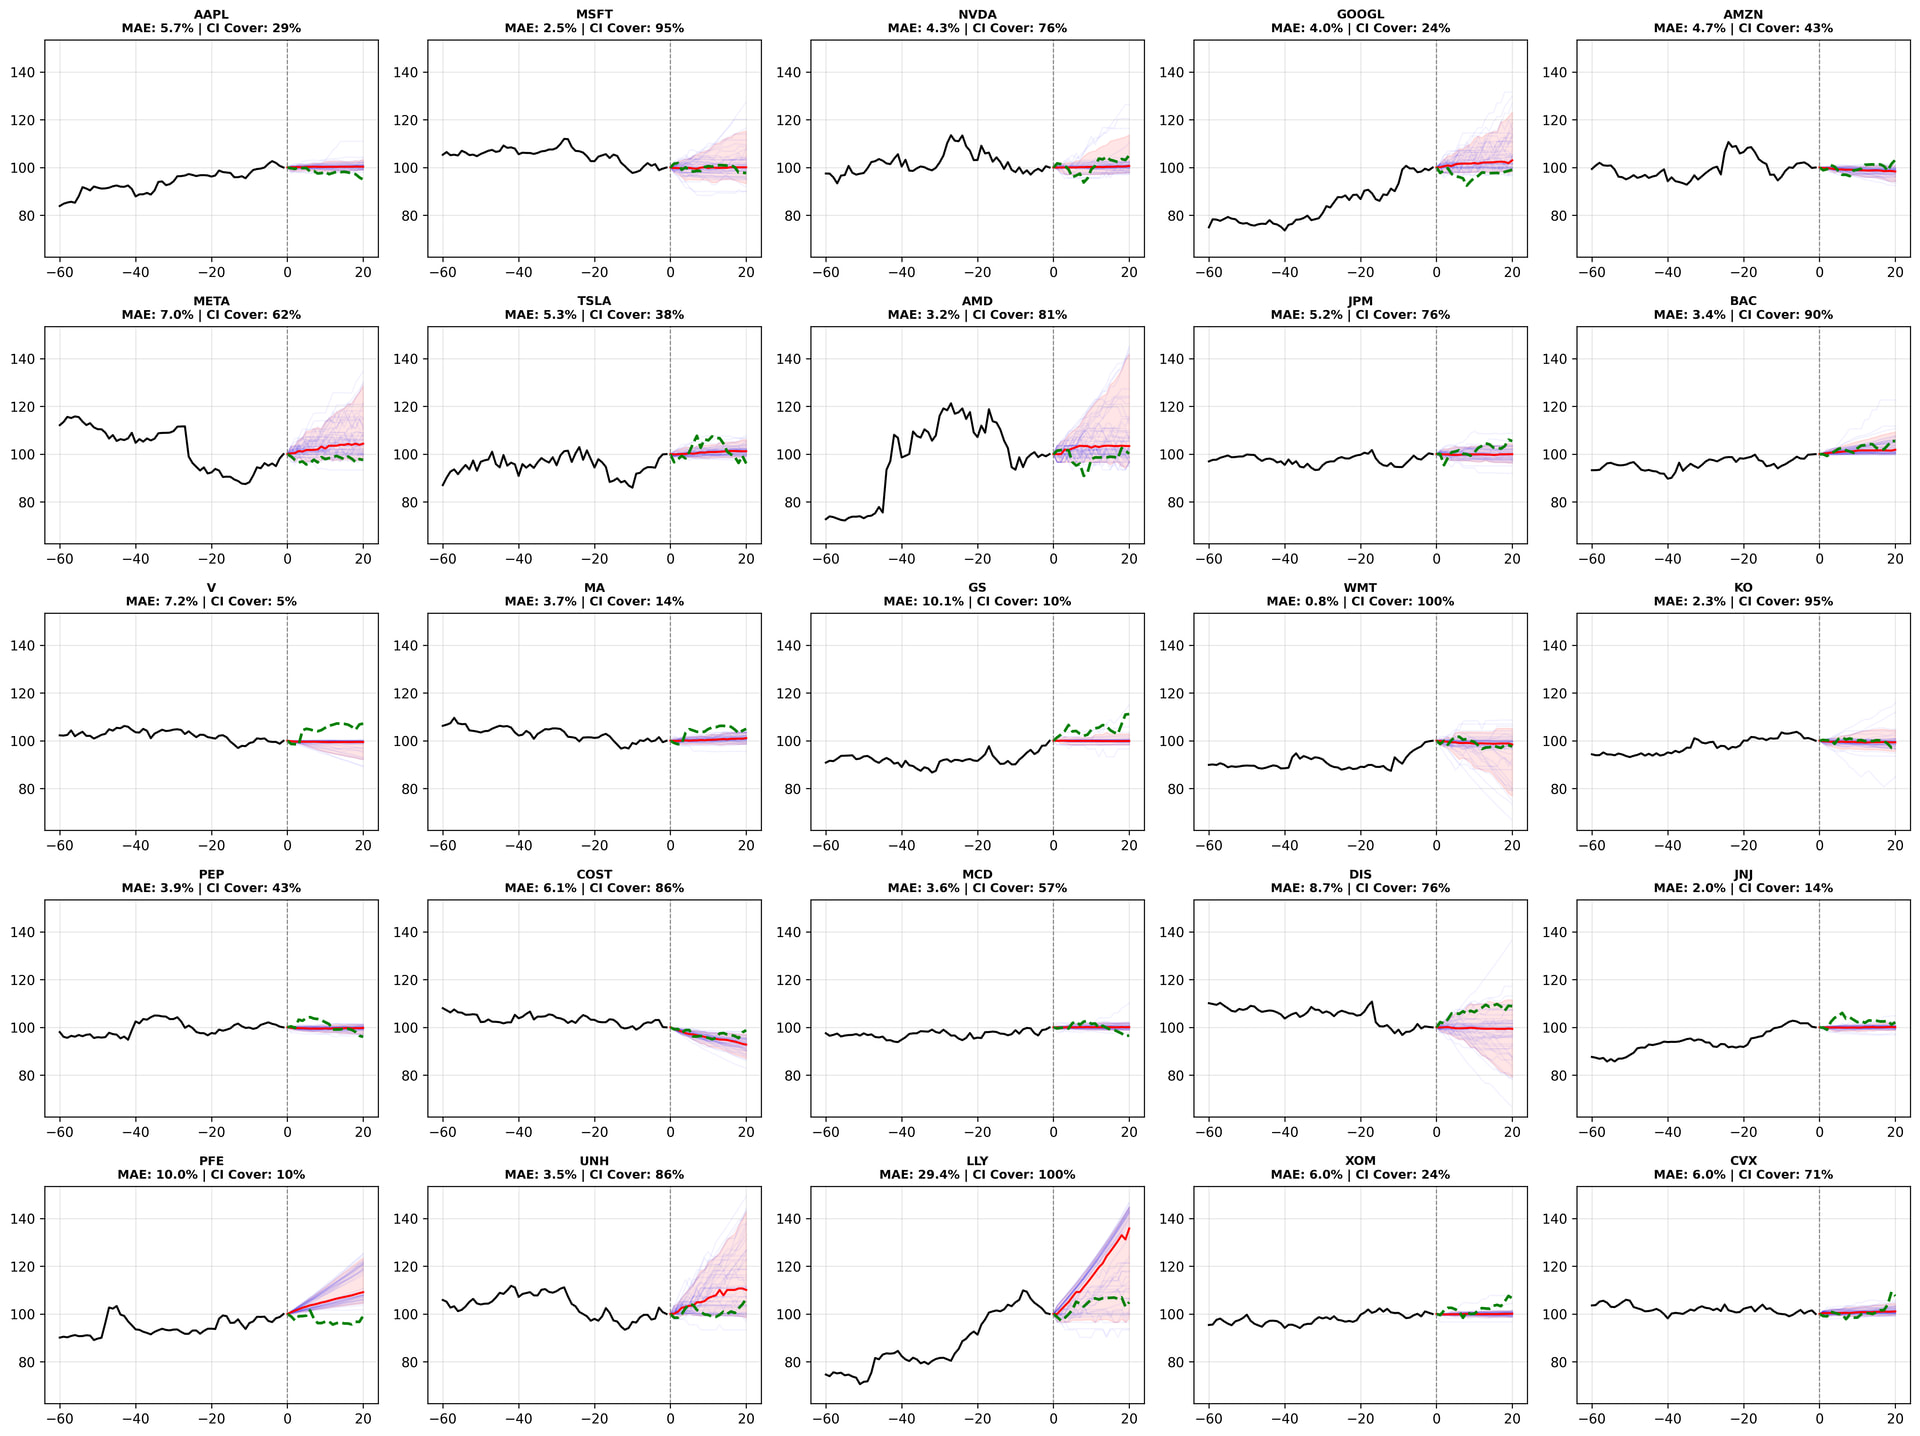
Here is a similar image to the one above, but instead of forecasting future development, we provide prices from 80-20 days ago as input and compare the forecast to the development from 20-0 days ago (green).
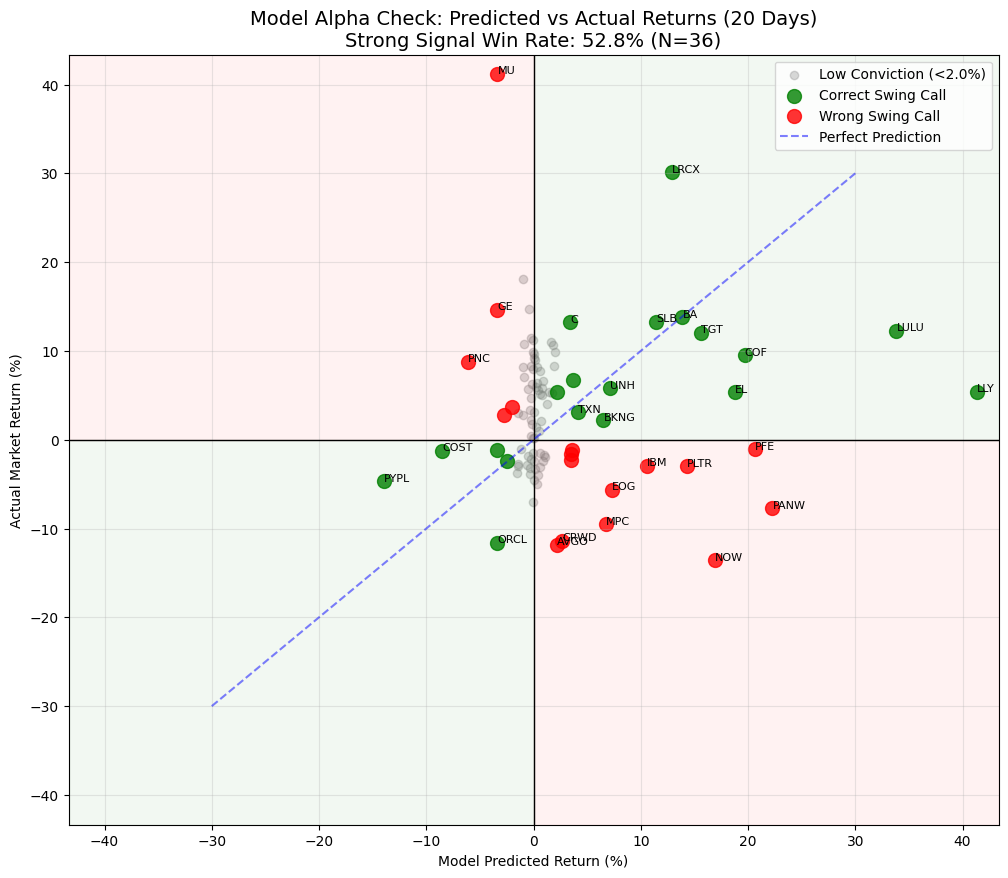
Those line charts might not be the best, so here is a slightly different cross-comparison between realized returns and predicted ones (including a larger number of tickers and only swings over 2%):
The model clearly has a tendency to produce overly optimistic developments for a 20-day period. Directional accuracy for an even larger mass of tickers over a four-year period is clearly better than a coin flip, but I still need to analyze whether this is due to this tendency, which seems to correlate with the general direction of the market.
There are a few other preliminary backtests in the code if you’re interested in taking a look. The trained model can also be found in the repo, so you can run it directly if you wish. The raw data is again so large that it won’t fit on GitHub.
PS. The repo is updating slowly as I write this - some of the files included are quite large.
The project is nearing completion. However, backtests have only been performed on about 30% of the entire 10,000 ticker space, but I think the results can already be concluded from the +10M out-of-sample data points in the backtest sample at hand. The results are:
The model can produce statistically significant alpha (I ran backtest results against, for example, Monte Carlo simulations, none of which achieved as good results as measured by Sharpe - the model produces a Sharpe ratio of >2.0 with suitable calibrations).
The model works especially well in multi-day swing trades (likely due to the daily price data used and its inability to distinguish intra-day noise from the signal without intra-day or volatility feature information - a bit disappointed I left out vol, but I no longer have enough GPU resources to run it again). In these high-confidence trade signals, the buy/sell hit rate is 52%.
I measure the model’s internal confidence (conviction and confidence) by examining the nature of the probability mass in the softmax distribution and the intensity of the logits. A great feature is that a signal given on this basis also produces a more accurate direction prediction. Thus, one can choose the most profitable trades based on expected value.
And when a so-called sniper strategy is formulated based on the above, where a) the most suitable trades are selected and b) the investment is weighted based on the signal strength, I achieve hundreds of percent per annum returns with fairly minimal drawdown using constant (could also test dynamism) stop-losses and profit-taking thresholds. For some reason, the model is particularly good at shorting and quite a lot worse in a very bullish market.
I’ve had to rub my eyes a few times when going through these results. They are theoretical in the sense that slippage, path dependency, and a couple of other real-world constraints are missing from the model. But based on this, it can probably be said that a transformer could have fairly good utility in supporting technical analysis.
The final research results should be ready in about a month.
As a comment on the lack of path dependency, have you looked into “rough paths” theory? It involves a concept called path signature, which has gained popularity in recent years specifically in machine learning circles because, in principle, it describes a path realization of a stochastic process in a very low-dimensional space. If you continue working on this after your master’s thesis, I recommend checking it out. Below is a survey paper on the topic by the developer of rough paths theory. I have personally implemented some financial applications based on these and achieved very good results. Unfortunately, those codes are the property of my employer, so I cannot share them.
By path dependency, in the context of my project, I meant that backtest results involve unmodeled intra-day sequence uncertainty or “illogical order of execution” - i.e., a lack of path dependency. In other words, when I operate with only open and close returns in backtests, it is possible that, for example, stop-losses and profit-taking thresholds would have been hit intraday in real life, which of course distorts the return figures of the strategies to some extent. I am not even trying to code this within the scope of this thesis project, although it would be possible with the intra-day High / Low features found in the data.
Rough paths theory is conceptually familiar, and I have never applied it myself - I am more of a Markovian school of thought in this type of modeling . In the securities context, it has the same application as my project - just a different paradigm.
I don’t know if this ended up in the backtest’s ticker universe by random sampling.
And I wouldn’t use this model for direct stock picking or to predict individual tickers at time X. In this genre, even a directional guess is at best only slightly better than a coin flip in a single trade.
The model works when the Law of Large Numbers starts producing results with a sufficient sample size. It’s a bit like a casino’s house edge, e.g., in roulette: at the roulette table, the casino doesn’t know where the ball will stop next, and it doesn’t even try to guess. The casino trusts that the rules are set so that after thousands of spins, the statistics turn in favor of the house.
The same applies here: the goal in my ML setup is not to be right about a particular stock, but to operate thousands of times with a statistical advantage that turns the edge in favor of the model
The research is now complete. The final model is a 3.45M parameter transformer, trained on nearly 40 billion token passes. Backtesting was ultimately conducted with approximately 7 million test trades. The model was trained on a sample of +6000 tickers using price history from 1999–2016. The validation period was 2017–2020, and backtesting covered 2021–2024 (just under 3000 tickers).
The results look quite good in the end:
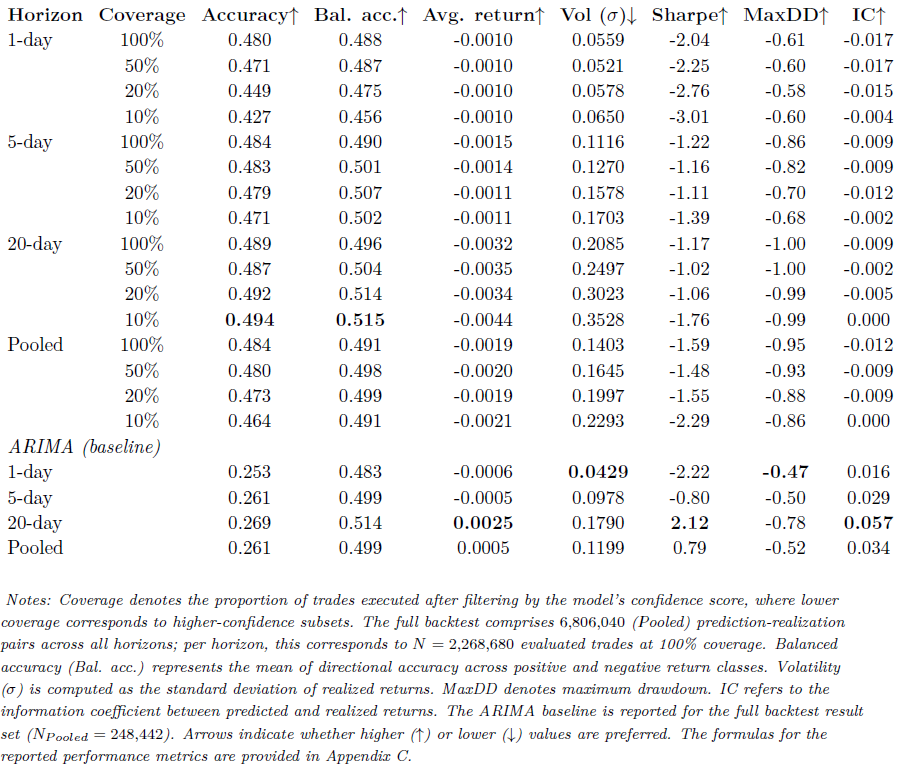
With daily data, the market is too noisy for “always-on” forecasting—without filtering, returns remained close to random. Due to the friction penalty (e.g., costs), returns for the entire sample were negative.
When multi-stage signal filtering was added (model confidence + conviction + sectors + market cap), results improved significantly.
In the filtered signals, the directional forecast exceeded the market’s 50% efficiency threshold and generated positive risk-adjusted alpha.
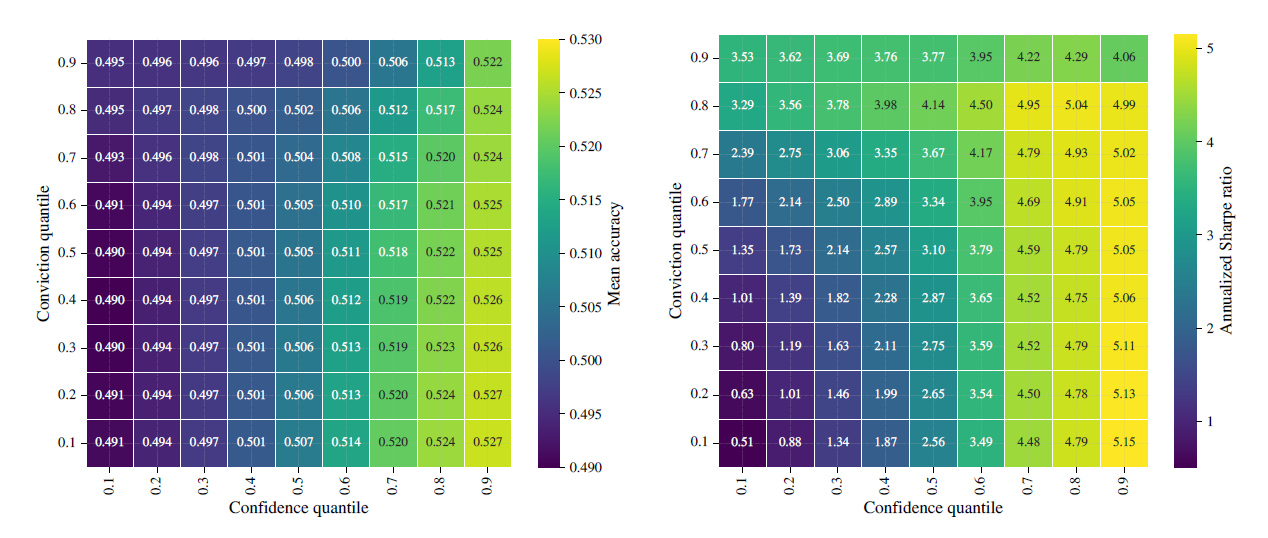
Sharpe = 3.7 and Sortino = 5.7 with Multifactor filtering (though there is a potential small overfitting trap here).
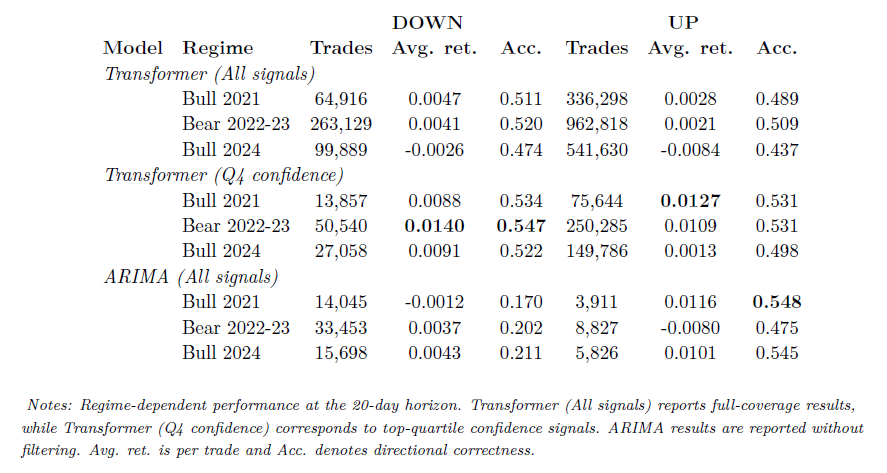
Gratifyingly, the Transformer was able to produce positive returns through both bull and bear markets (i.e., without separate calibration etc.).
Specifically, model confidence—a measure of the concentration of the model’s token prediction probability distribution—seems to be a good indicator for a profitable trade.
Conversely, conviction—the intensity with which the model indicates the direction of the trade—was a negative signal for returns. In simpler terms: the model should be certain about the direction, but not necessarily “too dramatic” regarding signal intensity.
The performance of a simple ARIMA benchmark was also surprising—especially in certain market conditions. Particularly interesting was that trading with a Transformer Multifactor + Arima ensemble yielded nearly 70% directional accuracy (20d horizon) .
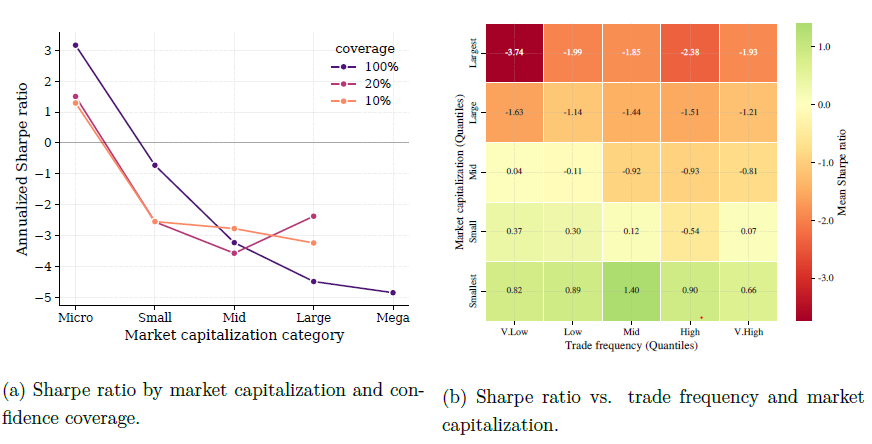
The Transformer does not, therefore, appear to be an all-knowing crystal ball (at least with this setup), but rather a tool for finding rare high-expectancy situations. It is particularly good at modeling the expected value of price movements in small (read: illiquid) stocks.
Training the model, including the architecture search, would have cost just under €5k in GPU resources under commercial terms (using CSC’s Puhti supercomputer). Backtesting inference ultimately took just under €10k. So, building this kind of setup isn’t exactly cheap. The inference setup specifically required a large memory allocation, which increased CSC resource consumption. The job would have easily fit within the specs of, for example, an Nvidia DGX Spark (price approx. €5.5k).
The results and (spaghetti) code for training and backtesting can be found here:
Aggregate results for the entire sample (100%) and selected confidence percentiles. Negative returns are indeed seen across the board when returns are penalized by friction drag. ARIMA ultimately performs surprisingly well, even though direction accuracy is poor (around 25-26%).
2. Returns relative to the market cap of the traded ticker. As you can see, returns drop rapidly when moving from micro-caps to even slightly larger companies. Apparently, the markets are reasonably efficient. In large companies, it doesn’t help no matter how confident the model is about the direction, but pleasingly, there is a monotonic correlation between the model’s confidence and the return.
3. This shows clearly how the Transformer performs quite nicely throughout the market regime (bull vs. bear). Steady performance around 0.5 direction accuracy. ARIMA, on the other hand, is a total catastrophe when it needs to predict something other than an UP signal.
5. Comparison of different types of filtering strategies. ARIMA is indeed a surprisingly tough opponent (when filtering only those trades where the model predicted the largest movement in either direction).
6. When stop-losses and profit-taking limits were set for Multifactor (using perhaps a slightly overfitted grid search to find optimal limits) and the trade size was conditioned on signal strength, quite strong returns were achieved (100k initial capital).
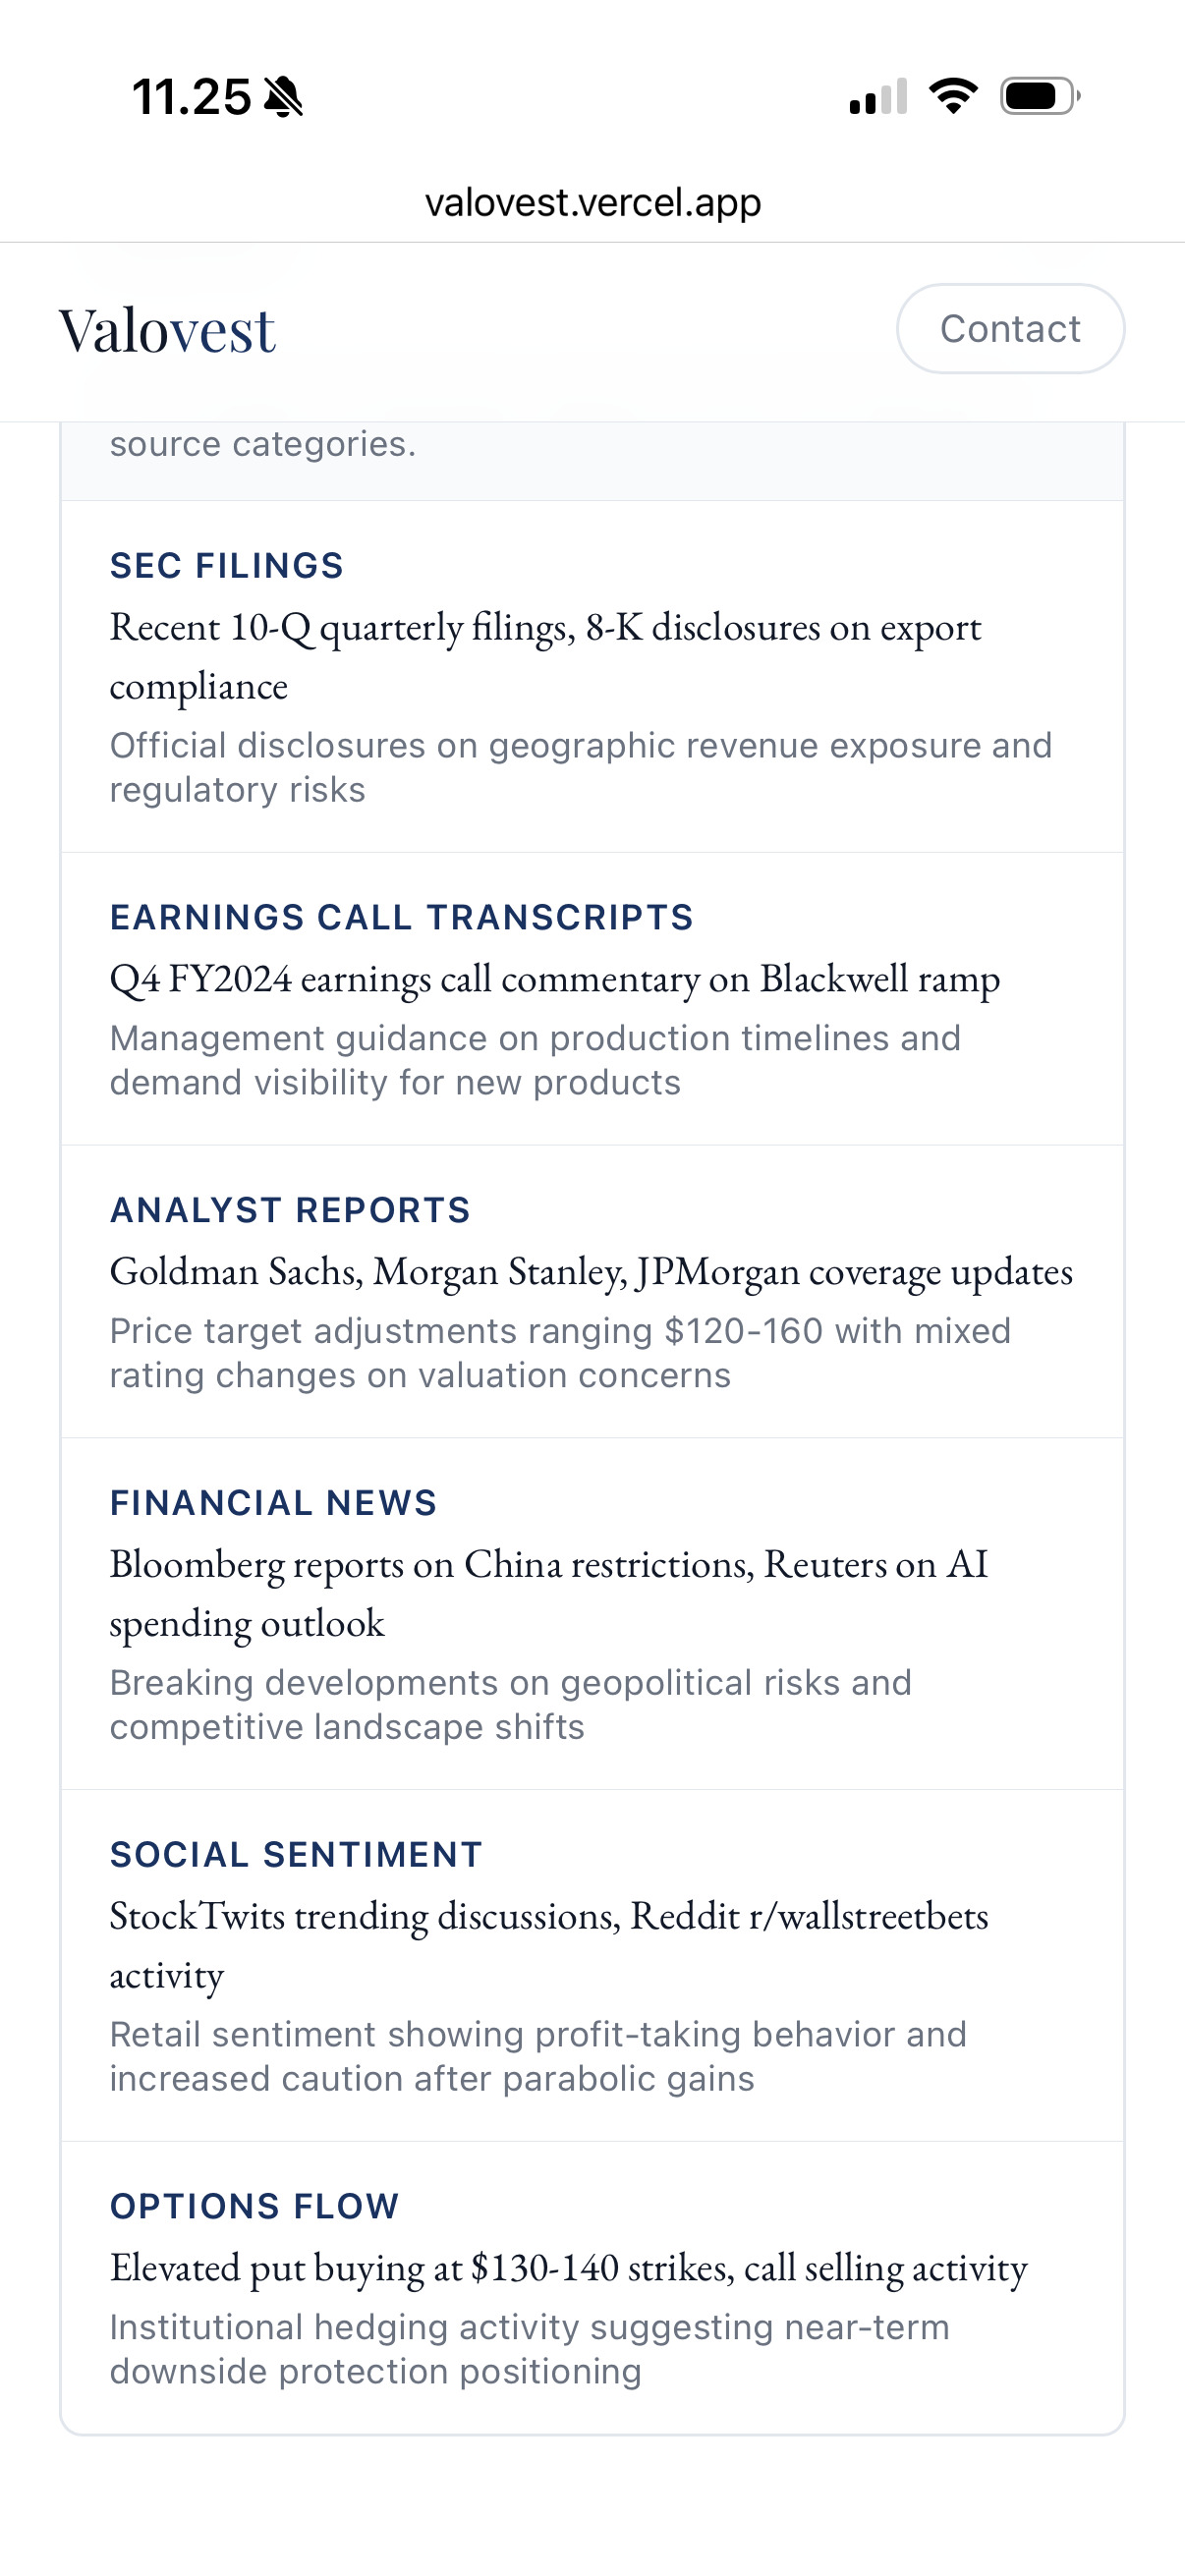
I have recently built an AI-based tool that analyzes market sentiment for US stocks. It’s not a price predictor, but rather a sentiment analysis tool. The tool scours hundreds of sources, such as analyst reports, news, and social media. From these sources, it compiles a structured summary: overall sentiment, bull vs. bear arguments, and key themes from the selected period. As mentioned, the tool currently works best with US stocks, but there are plans to expand to European markets, including the Helsinki Stock Exchange.
You can try the tool for free at valovest.vercel.app
→ I would love to hear thoughts and development ideas from other investors regarding this.
It seemed quite good, but I was left wanting a list of sources—specifically, what data was used and who produced it to reach the conclusions in these mentioned categories.
Good point and thanks for the response! The source listing is definitely on the development list — the goal in the future is to show exactly from which sources each conclusion has been drawn. Thanks for the feedback!
Update: The sources section has now been added! By clicking the “Sources” button at the end of the analysis, you can see which sources were used to create it. Thank you for the feedback; this was a great development suggestion!
Development idea as requested: This app’s analyze-endpoint seems to be accessible directly from external tools as well (I managed to extract the data myself with a simple PowerShell iwr call). If it is intended to be an internal API only, I recommend adding actual authentication (e.g., session/token-based protection) rather than relying on restrictions based on browser headers. I assume the consumption of the underlying language model isn’t exactly free, and right now it’s likely possible to fire off a massive number of requests and build a personal sentiment database on your dime or crash the service (I didn’t test any malicious looped calls, of course—so there might already be some harness in place).

 . In the securities context, it has the same application as my project - just a different paradigm.
 .