Inderes Analyses (formerly Inderes's New Recommendation Policy)

I don’t know what “tuotto-odotus” (expected return) means in the sense you’re using it. It’s not necessarily the same as the expected value of return. The expected value is obtained as an aggregate, the sum of the products of the returns of all scenarios and their probabilities. If the dispersion is large, the expected value settles somewhere between the scenarios, far from the extremes.

For you, “tuotto-odotus” might also literally be an expectation: “if everything goes as it should,” or at most with a small reservation. I interpret it now that “tuotto-odotus” is more of an (attractive) promise than a strict expected value.

By dispersion, I mean dispersion. The question is actually whether you mean a smaller risk by it.

I would understand “tuottovaatimus” (required return) through “tuotto-odotus”: “The return (expectation) on capital that is sufficient.”

Let’s imagine an example:

In a game, a die is rolled. Either a regular six-sided die or a special die with numbers 2, 3, and 4 in equal balance. Participation costs one euro, and you win a sum corresponding to the die roll.

Would you recommend investors play with the 2-3-4 die instead, because the dispersion is smaller, even though it wins less in the long run? Also, the ratio of expected value to dispersion is higher with this 2-3-4 die. That is, expected value 2, standard deviation 0.82 versus expected value 2.5, standard deviation 1.7.

There’s no need to get stuck on exact numbers here, because in reality, we only have some ballpark estimates. However, I’m trying to understand as well as possible what you are communicating with your recommendations in different situations.

So, no attempt to be snarky here, @Sauli_Vilen :smiley:

2 Likes

By return requirement, I mean the cost of equity, as this is what investors demand for the equity they invest. WACC reflects the cost of all capital (including debts in DCF). WACC ultimately doesn’t tell an equity investor much, and in my opinion, CoE is clearly more important.

2 Likes

Yeah, thanks for the clarification! :slight_smile:

1 Like

Now it’s getting a bit too much into the realm of exact science (let’s remember that analysis is closer to religion than mathematics! :slight_smile:)

For us, the basis for the expected return is our base scenario, which our forecasts also rely on. This is then weighed against the risk. For example, we don’t give a separate value to an M&A option in the target price, but we might mention in the analysis that “in addition to the expected return, investors get a positive M&A option with a positive expected value as a bonus.” For example, in the case of a financial crisis/bankruptcy risk, we, in turn, raise our required return. Of course, we also highlight if the company’s earnings potential significantly deviates from the current level so that investors can also assess the realism of this path themselves. Again, company-specific differences are very significant.

At first, I thought I wouldn’t answer that dice scenario, but I will now anyway :smiley: If we pretend that the die is a publicly traded company and its number represents the earnings for one fiscal year. Since capital destruction is not possible in your example, the recommendation for both dice would, of course, be positive. In principle, the die with the higher expected return should be more valuable, because earnings volatility is not a problem for a long-term investor per se. Even if the die with the higher expected return would make more money in the long run, I believe that the 2-4 die would be priced at a higher multiple due to its lower earnings volatility. Thus, it could well be a situation where the recommendation for both dice would be identical. However, it would again be very important to look behind the recommendations, as in the analysis we would certainly say “Company 1-6 offers a high expected return for an investor willing to tolerate earnings volatility,” etc.

Btw, I think this discussion once again clearly shows that the most important part of analysis is certainly not the recommendation & target price, but the analysis itself. The analysis offers investors the opportunity to bounce around different scenarios, while the recommendation only gives one subjective view on the topic :slight_smile: :slight_smile:

14 Likes

Ok, this answers it completely. Thank you.

By the way, I really like your answer to the dice question. You exceeded my expectations.

8 Likes

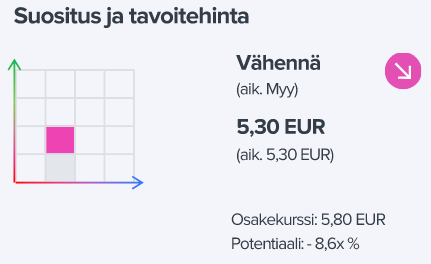
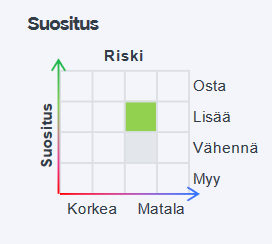
New graphics have been added to the extensive report. This might need a bit of explanation:

The X-axis probably represents risk. Does red indicate high risk and blue low risk? The Y-axis represents return potential, meaning high return with low risk is a good investment in the top right corner. The light grey box (2,1) is probably the previous recommendation.

The concept of risk can indeed be understood in many ways. If you are winning, minimize your risk and be conservative. If a loss seems certain, do something radical to change the situation (favor risk), because a conservative strategy will only seal the loss. In this sense, the strategy of heavily loss-making technology companies can be sensible. First, you need to get consumers into the system at any cost. I have seen diagrams where the valuation of stock and the profitability of the company have a negative correlation in tech companies.

1 Like

I changed the topic of the thread from “New Recommendation Policy” to “Inderes Analyses”. The purpose here is to discuss general matters concerning our analyses (not company-specific). Today, the reduction of our risk-free rate from 3% to 2% will surely generate some discussion.

The matter is discussed with Veppu in the video below: Miksi laskemme riskitöntä korkoa DCF-malleissa? - Inderes

In summary:
-Expectations for long-term interest rates have decreased => justified to revise downwards
-Mainly affects DCF
-Company-specific impacts vary greatly. For Kesko (see today’s report) and other TINA stocks, the impact significantly increases the DCF value. Conversely, for a high-risk small company, this is unlikely to have any effect on the required rate of return. Thus, one should not expect all our targets to shoot up now. DCF is ultimately just one tool behind the analysis, and in many companies, we have already stretched the multiples (=> accepted higher valuations because of zero interest rates).
-DCF and the required rate of return are ultimately the analyst’s subjective view. THIS IS NOT AN EXACT SCIENCE :slight_smile:

I’d be happy to answer any questions related to this!

7 Likes

{“content”:“Thanks for the great video! In addition to the risk-free rate, I’d be interested to know the other factors of the discount rate and how you calculate them. And have there ever been situations when doing DCF where you’ve had to weaken a variable to keep the target price in check? ;)”,“target_locale”:“en”}

For us, the parameters under the return requirement (Cost of equity and WACC) are ultimately just a means to an end. The most important thing for us is that CoE and WACC genuinely reflect the return requirement (=risk level) that the market demands from the company. We absolutely do not mechanically plug in numbers and blindly use the figure that comes out. For example, beta is manually determined by the analyst (as a rule of thumb, 1.0 is a company with a normal risk level and a range of about 0.7-1.5), and not elegantly calculated from historical stock prices. If calculated from historical stock prices, Piipo’s beta would probably be ultra-low because it trades so infrequently. That doesn’t sound very smart. Focus on the CoE and WACC end results, not the underlying parameters.

And a direct answer to a direct question, of course it has, quite often :smiley: The fact is that DCF is the “sanity check”, not a recommendation-driving factor. Of course, the DCF must be in line with the analysis, e.g., we should never have a target price higher than the DCF with a positive recommendation (it’s intellectually a bit dishonest to say “buy this company” even if it never generates enough cash flow to justify this value). In my opinion, it’s very naive to use DCF directly as a target and the only driver in a recommendation, because DCF is so incredibly sensitive to a few individual parameters, and it is ultimately just the sum of one person’s subjective opinions.

4 Likes

Here’s a story to give some perspective on DCF. I published my first analysis on Inderes almost exactly 10 years ago. In our analysis model, we forecast the first 10 years on an annual basis, after which there’s a terminal period (perpetuity assumption). The company was Rapala, and back then, over half of Rapala’s future cash flows were in the perpetuity assumption period. My first-ever analysis would have only recently entered the terminal period. However, as we know, the world has changed quite dramatically in the interim (euro crisis, Russian crisis, corona crisis, rise of e-commerce, digitalization, etc., etc.). All of this has also dramatically changed Rapala’s operating environment, and it’s clear that the assumptions behind the original view have changed significantly.

The main point here is that relying solely on DCF rarely leads to a very good outcome. DCF attempts to forecast a company’s entire remaining life, which is practically an impossible task (if any of you can do this, send in your job application!). That’s why DCF is a good tool for a sanity check, but it doesn’t work as an absolute truth.

8 Likes

That beta calculation sounds sensible! Or at least much more sensible than calculating directly from the share price.

And I agree that DCF can give almost any result. But I find it interesting to see what the result of a “mechanical” DCF calculation is. If, for example, a growth company’s DCF were 3 times the company’s market value, then that tells you that with the given assumptions, the company’s value could triple. Of course, the result is very sensitive to the discount rate and growth %, and a company’s long-term future usually involves a very wide probability distribution…

For a stock analyst giving recommendations, DCF is perhaps a slightly different tool than for an investor trying out different scenarios. In the analyst’s context, one DCF analysis must be chosen to show “look, the valuation could be based on these parameters, for example.”

3 Likes

@Sauli_Vilen

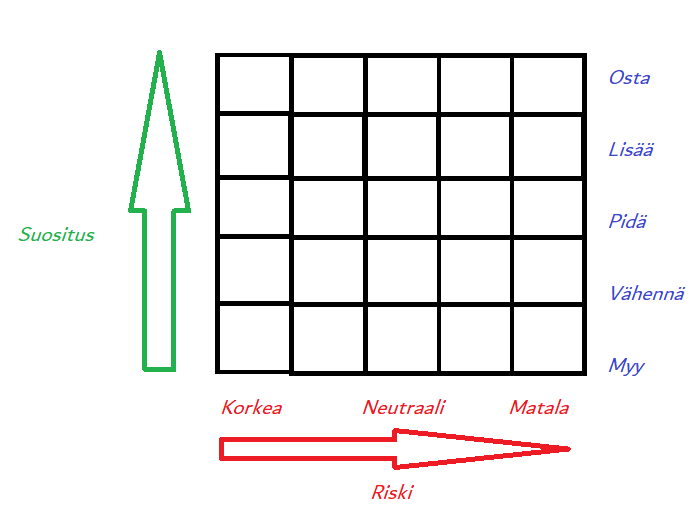
Would it be more useful if this Risk was measured on a 5-point scale?

So, quickly drawn:

kuva

In the middle, of course, would be “normalized” risk, so if it is one degree on the lower side, it differs in a different way than in the picture above (taken from Kemira as an example). The same applies if it were “slightly riskier” but not yet incredibly risky.

Then again, if it’s in the middle of the stock market, are we going over ghost limits, which way would it lean? (in the current model)

E: Or does your policy apply here too that there are no “hold” recommendations (in this case ‘average’ or something similar), but you always have to give an opinion one way or the other?

2 Likes

The idea with that scale was that it would be symmetrical with the recommendation ladder (4 levels). I understand your idea of “normal” risk, and it’s a smart thought. This risk metric is, of course, constantly being developed, but for now, we’re sticking with the 4-level scale because our risk modeling is also built on this 1-4 scale. We’ll see about changing it to a 5-level scale in the next major update :slight_smile:

5 Likes

Great! Then the next version needs to fix the unpleasantly distracting asymmetry, and all recommendations can be nicely normalized: to the center of the table.

Also, consider the positive aspects of this development. No longer would one have to ponder in the wee hours of the night what Remedy’s true valuation is. Instead, on a Friday, one could simply state: “I don’t really know, the market probably knows what it’s doing. Target price: Today’s closing price. Inderes’ new recommendation: Neutral Hold. Let’s go for a beer.”

9 Likes

I did think that the previous presentation meant a 5x5 field. In fact, we could also include a time variable as depth. So, if there’s an immediate uplift coming, like how Verkkokauppa (Online Store) is being hyped, but there’s a warning about Amazon problems coming in a few years. In that case, two different recommendations would have to be given, relative to the time dimension.

We would get a three-dimensional model that, with current technology, can be rotated by hand, that is, in virtual reality (VR). Try VR, also that state train company, but now I mean virtual reality. At least universities and polytechnics do it.

It’s already fun now and later it will certainly also be useful in other ways than from the perspective of developing spatial perception.

And so that the matter doesn’t become too simplistic, for example, the risk should be divided into at least 1 - 4 most essential ones. Likewise, the recommendation. If there were also warning colors, even better.

2 Likes

In my opinion, the readability (and comprehension) of the reports would improve and speed up if the DCF calculation had a row for the year-on-year percentage change in free cash flow, and if the growth rate for the terminal (TERM) phase was also clearly displayed. In some cases, the TERM growth rate is mentioned in the text, but one has to dig for it. A small, but easily implementable wish :slightly_smiling_face: Right now, if I want to understand what numbers these are based on, I have to copy the figures to Excel and try to match the TERM growth.

6 Likes

This is a good suggestion! I’ll add it to the worklist for the next time we update the reports :slight_smile:

6 Likes

This topic has come up before, but I’m bringing it up again in case I can create any pressure.

In my opinion, Inderes should start following Nordea. I just saw stats that show Nordea is by far the most owned stock in Finland (I think it had over 300k owners).
Following Nordea would be of significant value to the Inderes community.

You are, in any case, already indirectly following Nordea through Sampo, even if no analysis of it is published.

I understand that you haven’t managed to get Nordea to pay for this. However, I remember Inderes once declared that the community is its number one priority. This would be one of those “great instead of big” decisions.

8 Likes

We are aware of the situation and the matter is still on the table, although we haven’t been able to start coverage yet. For reasons of principle, Nordea coverage is unlikely to be held up indefinitely, but internal team resourcing and optimization of resource allocation have so far been obstacles. However, Nordea would be a demanding/laborious company to cover, and coverage should not be started without proper resources. We’ll see what we can do in the future.

8 Likes

Suggestion to include softer factors in reports / company page:

This would include, for example, matters related to management and competitive advantages. Competitive advantages are already discussed in videos and referred to in reports, but could they be presented more clearly (graphically or on a numerical scale)? Attention could also be paid to the source and sustainability of competitive advantages. Management, on the other hand, is surprisingly rarely referred to in any content overall (except when a new person is hired, an analyst’s comment might state, for example, that the matter is “positive” or “no impact on view”). Things that could be highlighted about management: historical execution of promises/strategy, industry experience, how long key personnel have been with the company, management and board ownerships, and related compensation.

There is discussion on the forum about RedEye’s analyses, and their people and business ratings contain interesting and, in my opinion, good sub-components (and even sub-components of those). I understand that evaluating such things numerically is difficult and subjective. Other ways can certainly be devised. It is likely that the evaluation of these qualitative factors has already been discussed, at least within the team, and the evaluation of management, for example, regarding compensation and ownerships, falls into the realm of “personal matters,” so I understand if Inderes has made a decision not to highlight such factors due to its position.
Finally, I’ll tag @Sauli_Vilen to this thought, as he seems to be active in this thread :slight_smile:

3 Likes