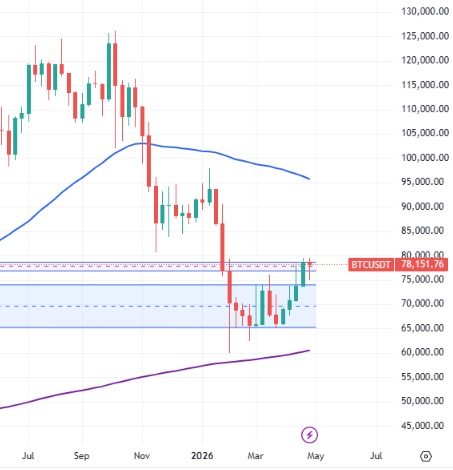
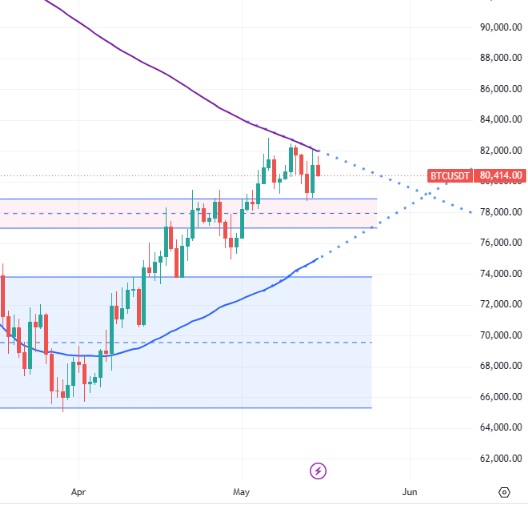
Bitcoinin kurssikehitys näyttää nyt todella hyvältä. Meno on jopa vahvempaa kuin viime viikolla, jolloin kurssi nousi ensimmäistä kertaa koko keväänä usean päivän ajaksi tärkeän 75K-vastustason yläpuolelle. Viikko päättyi kuitenkin karhujen tyrmäykseen, eikä viikkokynttilää saatu clousattua hyville tasoille.
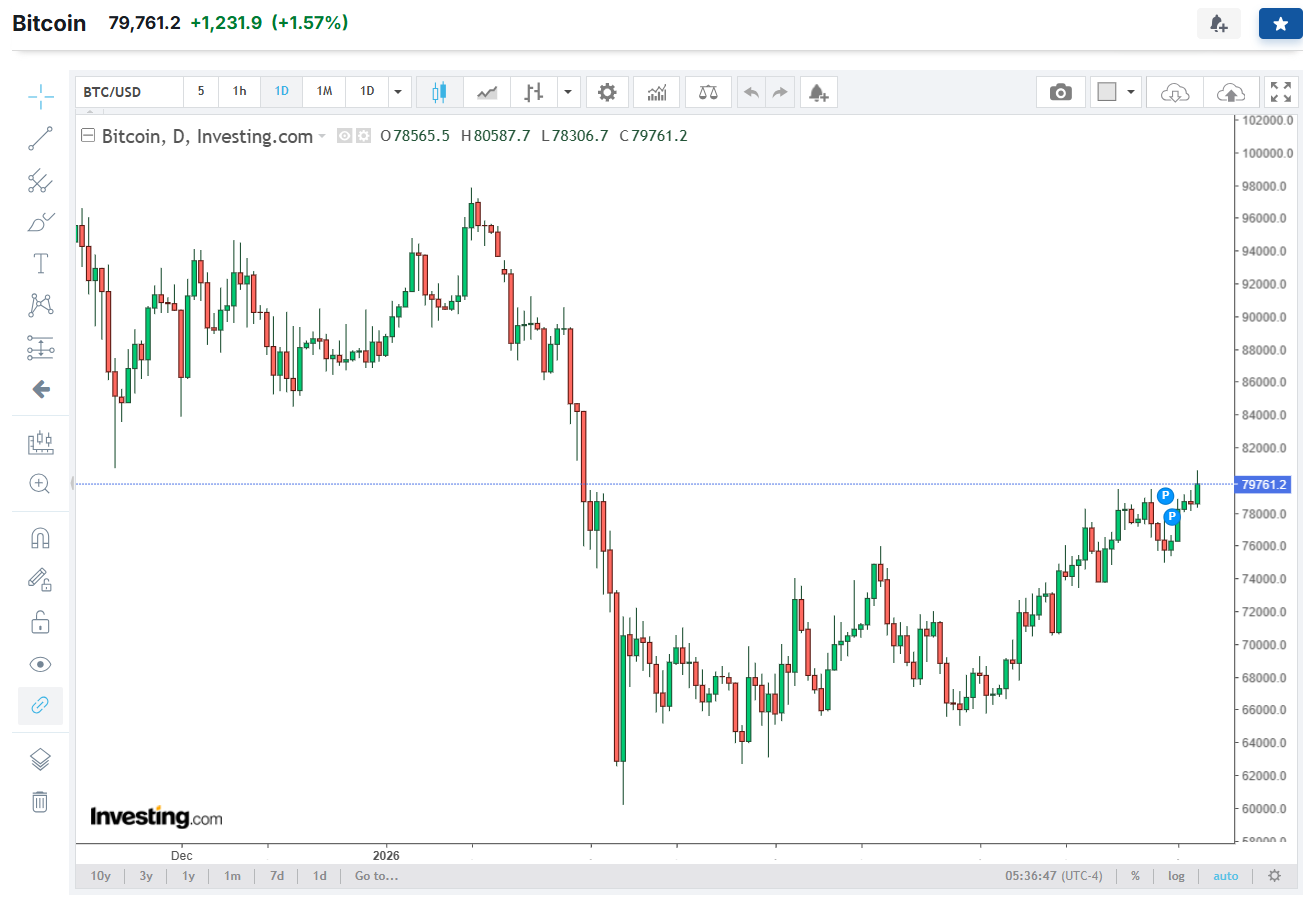
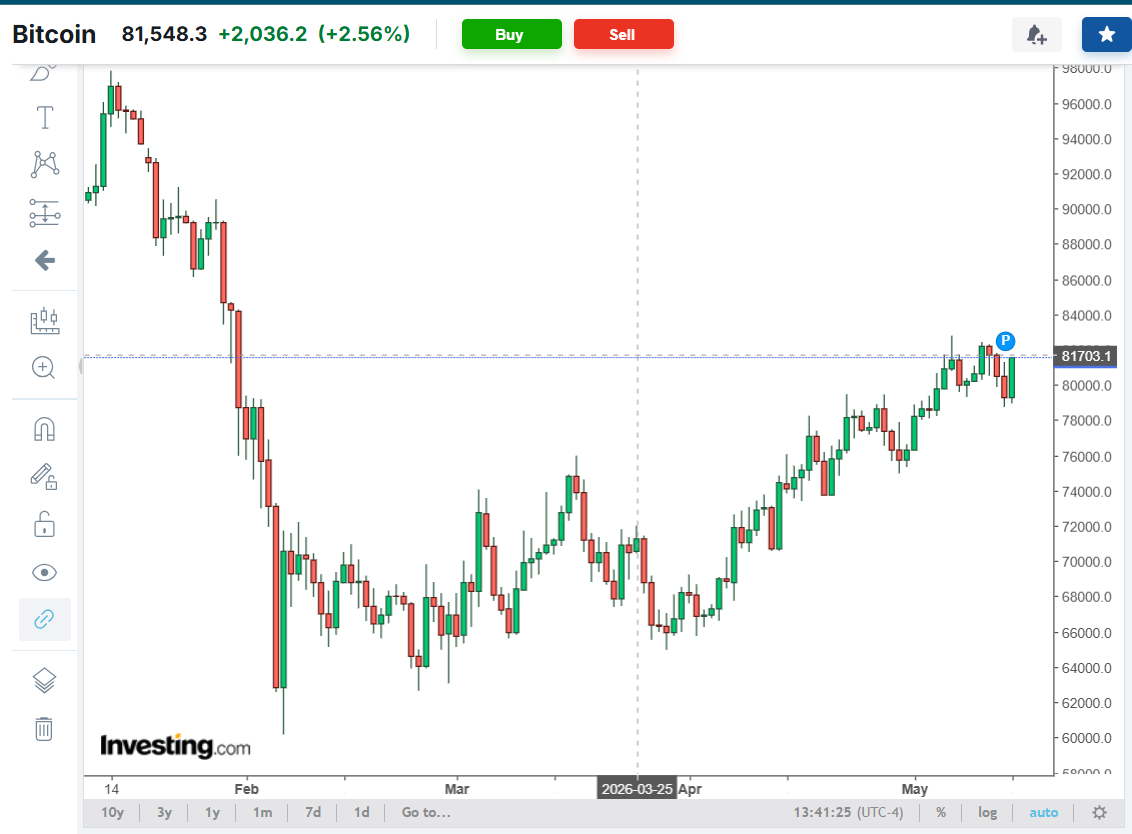
Tällä viikolla Bitcoin on lähtenyt uuteen lentoon ja noussut maanantaista lähtien joka päivä. Kurssi rikkoi tänään ensimmäistä kertaa 79K:n tason helmikuun alun jälkeen.
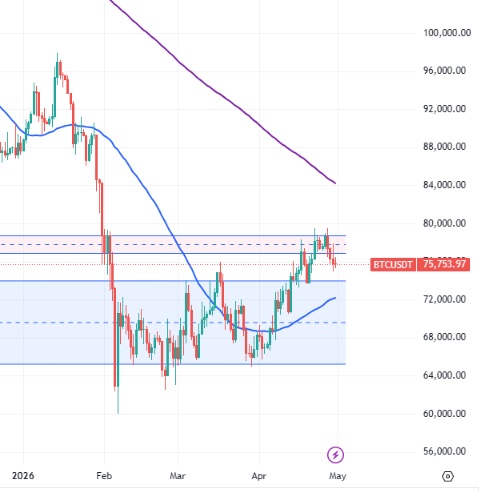
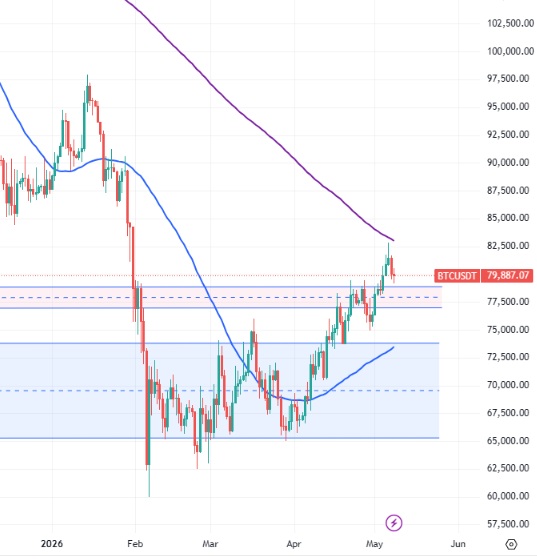
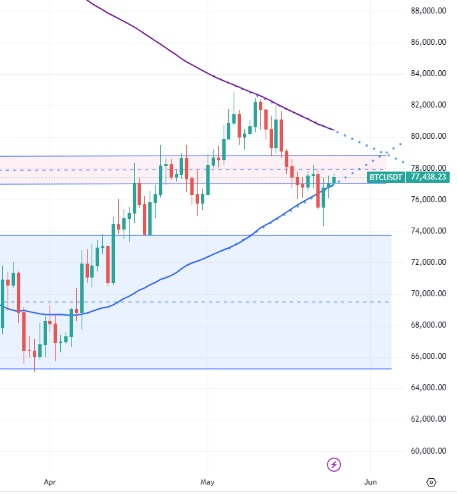
Tuossa päivächartissa näkyy hyvin, että tästä 78-79K haminoilta voidaan odottaa jotain vastusta, sillä kurssi jäi tähän sahaamaan usean päivän ajaksi tuolla tammi–helmikuun taitteessa.
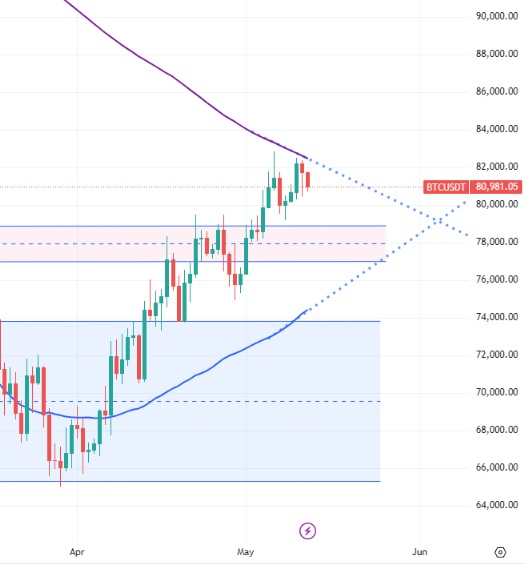
Mielenkiintoista on kuitenkin se, että Bitcoin on alle 10 prosentin nousun päässä 200 päivän keskiarvosta, joka näkyy tuossa graafissa purppuralla välillä. Kurssi ei noussut edellisissä karhumarkkinoissa kertaakaan 200 päivän liukuvan keskiarvon yläpuolelle. Kun tuo tärkeä trendilinja rikottiin, nousumarkkina alkoi.
Härkäisillä sijoittajilla on luonnollisesti riehakas meno somessa juuri nyt. Odotetaan nyt rauhassa vahvistuksia tälle nousulle ja otetaan ensin se viikkokynttilän clousaus…
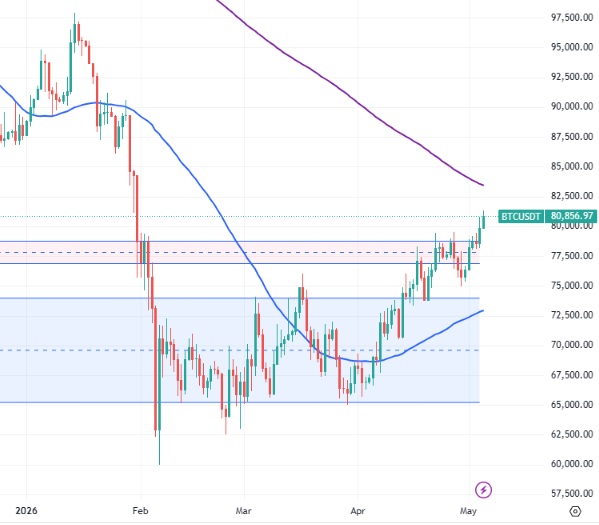
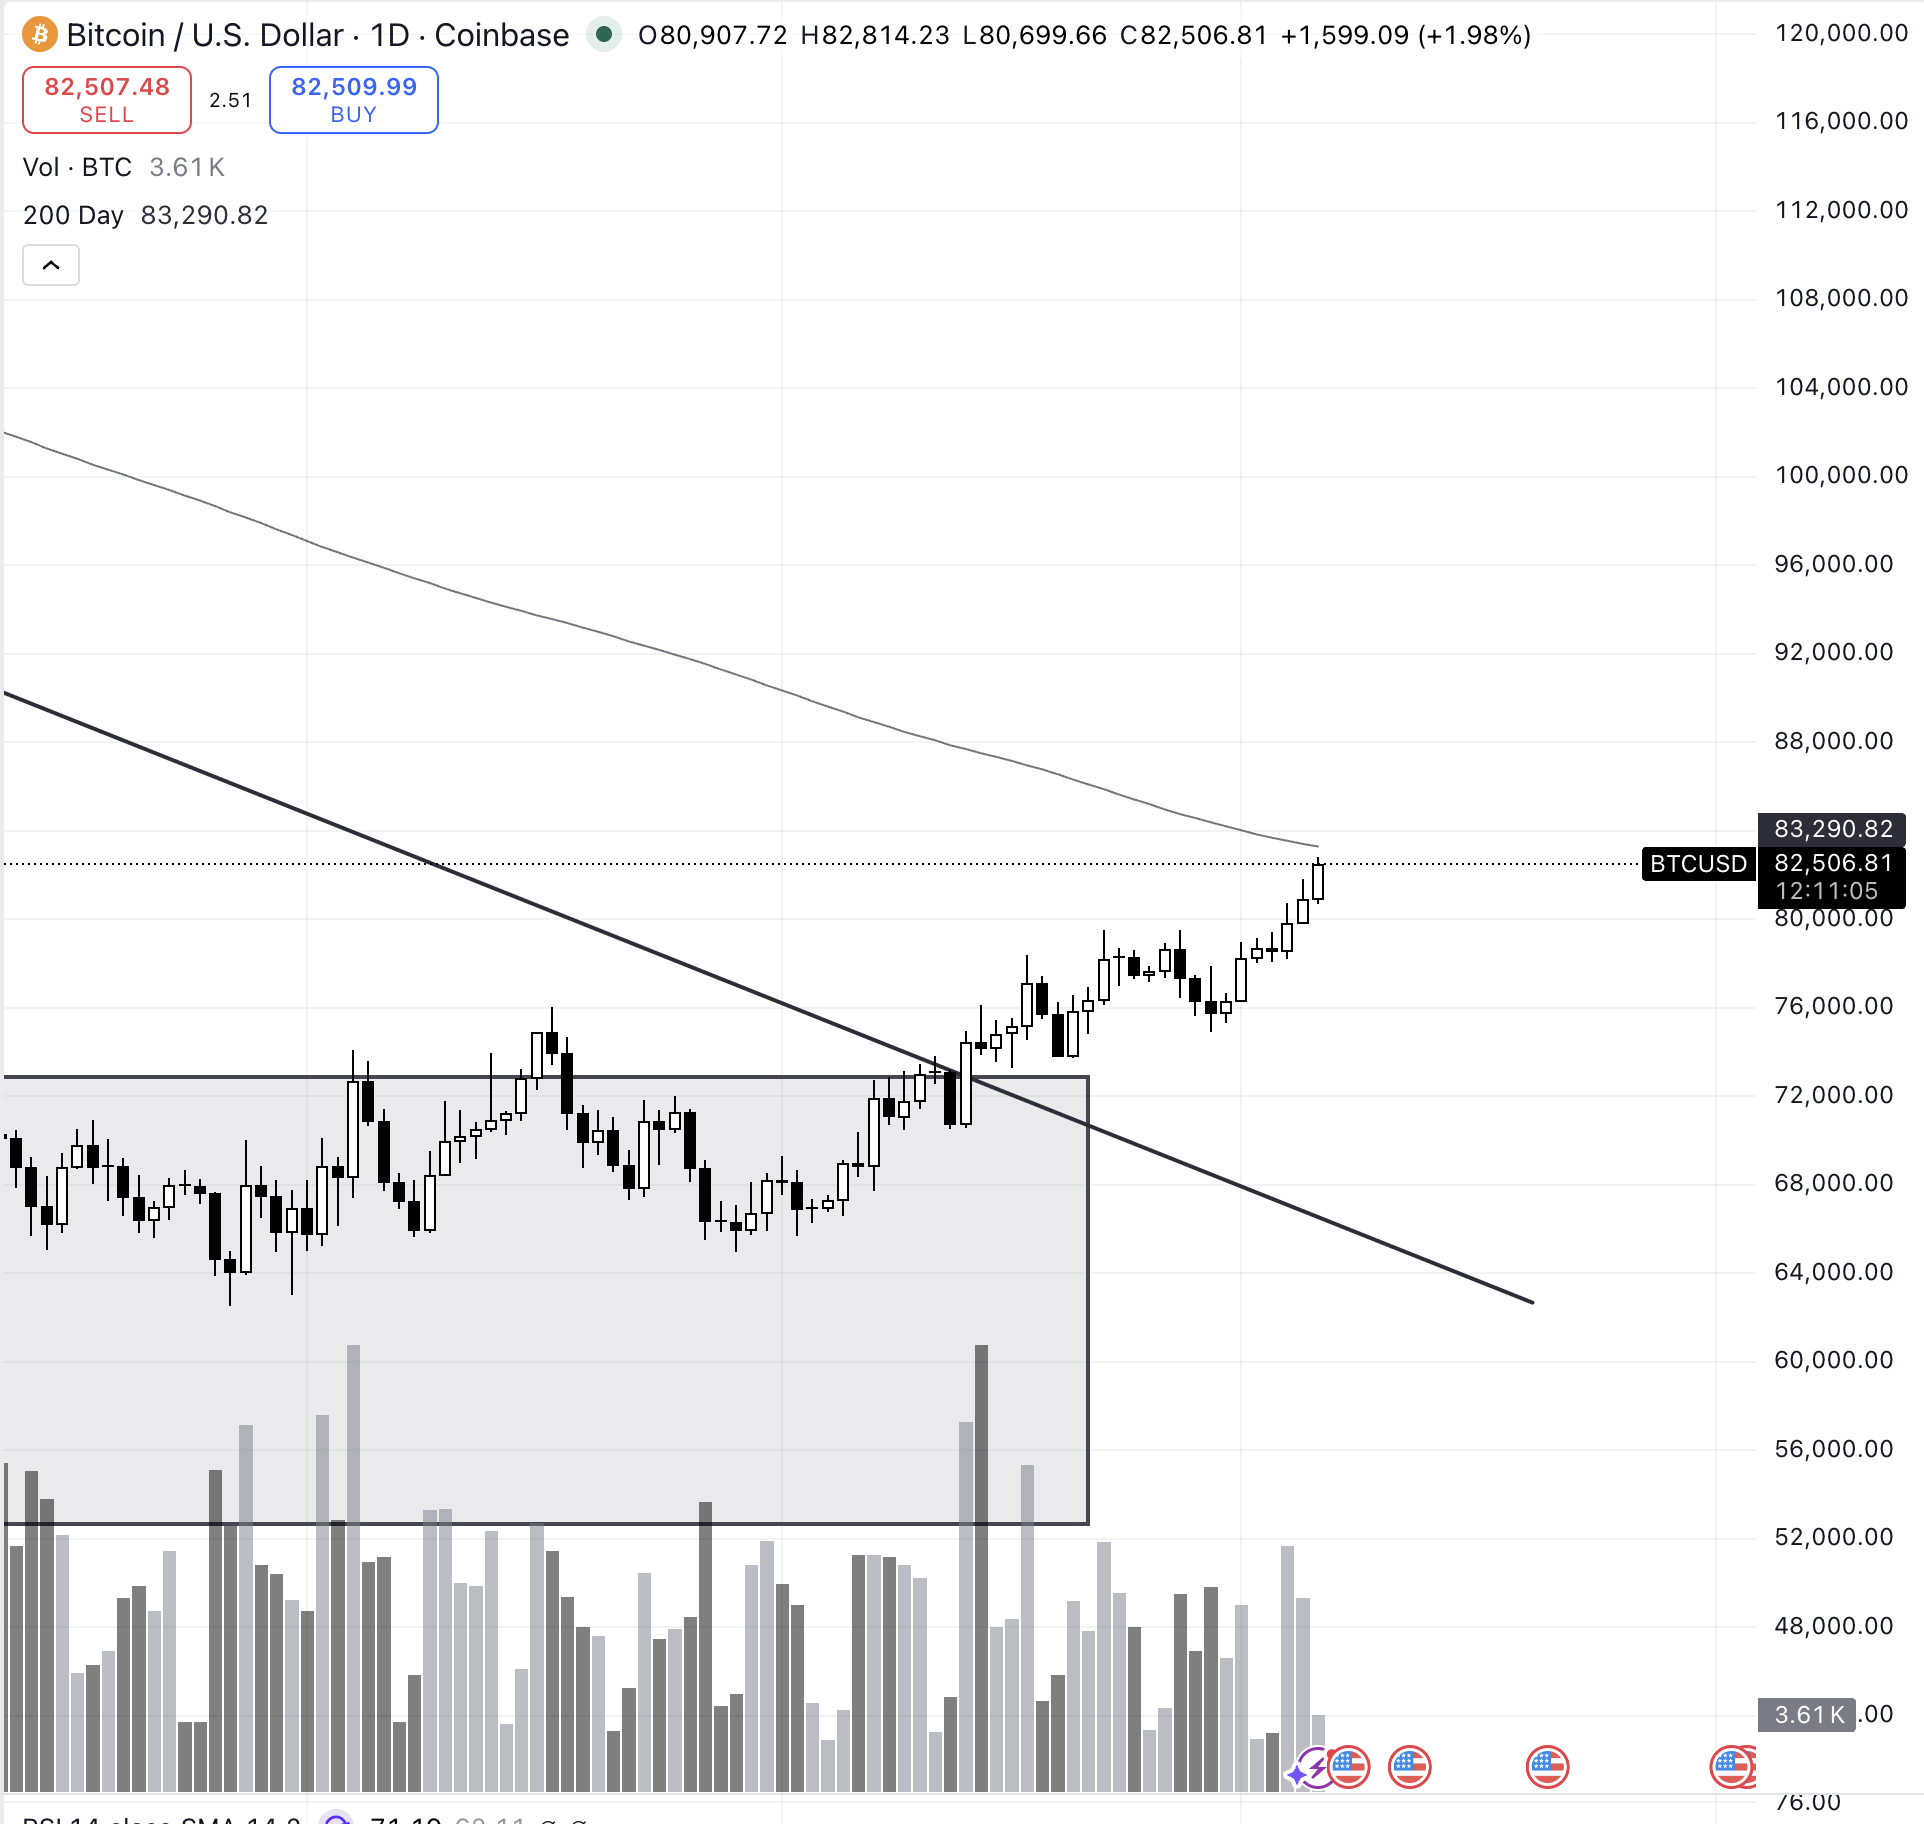
Härkäiset sijoittajat ovat olleet X:ssä hyvin riehakkaalla tuulella viime viikkoina. Positiivisuuteen on ollut myös perusteita - etenkin viime viikosta lähtien, jolloin kurssi pääsi vihdoin murtautumaan ulos kuvassa näkyvästä kanavasta.
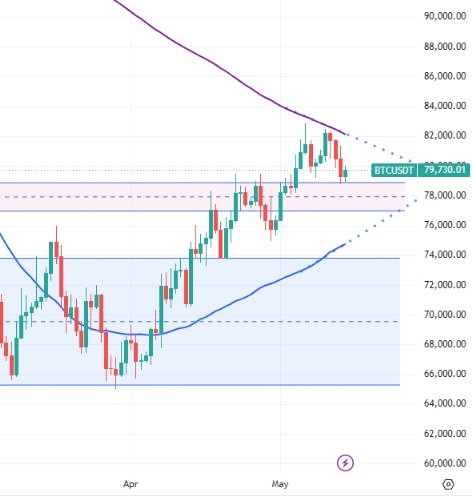
Vaikuttaa siltä, että nousuraketista loppui bensa puolivälin tienoilla. Kurssinousu pysähtyi seuraavaan vastukseen (kuvassa vaaleanpunainen alue) eikä jaksanut nousta testaamaan 200 päivän liukuvaa keskiarvoa.
Jos tämä trendi jatkuu, viikonloppuna testataan kanavan kattoa.
Tässä kohtaa on hyvä muistaa eräs asia. Toukokuu ja kesäkuu ovat olleet suorastaan BRUTAALEJA kuukausia aiemmissa karhumarkkinoissa. Vuonna 2018 pudottiin noin 10k → 6k ja vuonna 2022 noin 40k → 18k.
Esimerkiksi Ethereum teki vuonna 2022 koko karhumarkkinan pohjan juuri kesäkuussa, eikä enää laskenut sen dipin alle.
Tätä laskua seurasi sekä 2018 että 2022 useiden kuukausien sivuttaisliike, jonka jälkeen Bitcoin teki lopullisen karhumarkkinan pohjan marras-joulukuussa.
Pian nähdään, toistaako historia itseään vai onko perinteiset 4 vuoden syklit rikottu.
Katselin eilen Nordnetin Trader’s Clubia, jossa Mr. Lepikkö kertoi jenkkilän tulosennusteiden olevan 20 % luokkaa tälle vuodelle. Eli osakemarkkinalta ainakin löytyy vetoapua, eikä sitä analyytikoiden (joka viikko viimeiset 20 vuotta) ennustamaa markkinaromahdusta näytä tulevan.
Luvassa ei siis ole vuoden 2022 toisintoa, jolloin kaikki riskiassetit romahtivat käsi kädessä. Tästä näkökulmasta vuosi 2018 olisi parempi vertailukohde. Silloin S&P 500 oli nousussa suurimman osan vuodesta aina lokakuun alkuun asti. Vuoden lopulla nähtiin sitten iso romahdus osakemarkkinassa, joka saattoi antaa vauhtia myös Bitcoinin lopulliselle dipille.
Jos tänään ei nähdä yllätyksiä, tätä viikkoa voidaan kutsua torjuntavoitoksi. Koko alkuviikon jatkunut lasku pysähtyi torstaina, ja viikkokynttilä näyttää sulkeutuvan 77–79k alueelle viime viikon tavoin.
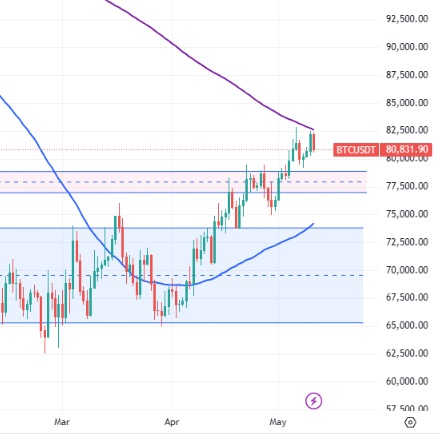
Jos kurssia katsellaan päivätasolla, niin 200 päivän liukuva keskiarvo (de facto karhumarkkinan raja) on jo hieman alle 84 000 dollarissa. Tarkoittaisi nykyiseltä tasolta vain reilun 7 prosentin nousua.
Vuoden 2022 karhumarkkinassa Bitcoinin kurssi kosketti 200 päivän liukuvaa keskiarvoa yhtenä päivänä (28.3.), mutta ei käynyt päivän sisällä sen yläpuolella. Kurssi palasi sen yläpuolelle pysyvästi 23.1.2023. Vähän myöhemmin nähtiin Golden Cross, joka oli viimeinen vahvistus karhumarkkinan päätökselle.
Vuoden 2018 karhumarkkinassa kurssi kävi muutaman kerran lähellä 200 päivän liukuvaa, mutta ei edes koskettanut sitä. Kyseinen trendilinja meni rikki 2.4.2019, ja vähän myöhemmin nähtiin taas Golden Cross.
200MA lähestyy ihan aikataulussa. Ei olis enää paljon pyristeltävää. Voi olla, että tänään jo kopsauttaa tasoa, kun Jenkit herää markkinoille tuossa neljän ja viiden välillä.
Nyt ollaan kyllä todella lähellä; kurssi kävi tänään noin 500 dollarin päässä 200 päivän liukuvasta keskiarvosta. Nyt on käynnissä ensimmäinen todella merkittävän tason testaus tämän laskumarkkinan aikana.
Karhut saivat tänään ensimmäisen erävoiton, mutta todella mielenkiintoinen loppuviikko on luvassa. 200 päivän liukuva laskee niin nopeaa tahtia, että sivuttaisliikekin riittää nostamaan Bitcoinin ko. trendilinjan yläpuolelle viikon tai parin sisällä.
Lähi-idässä vaikuttaisi tilanne kääntyvän myös parempaan, ja öljyn hinta sukelsi tänään taas alle 100 dollariin. Samaan aikaan jenkkilän osakeindeksit paukuttavat uusia ATH-lukemia. Bitcoinille on siis tarjolla myös myötätuulta markkinoilta.
Jos Bitcoin saa näissä olosuhteissa tyrmäyksen 200 päivän liukuvalta ja sukeltaa takaisin 7:lla alkaviin kursseihin, se olisi kyllä iso voitto karhuille ja todella tyly signaali. Pian nähdään, mitä käy.
Bitcoinin kurssi kävi viime yönä jälleen testaamassa 200 päivän keskiarvoa. Tämäkin yritys päättyi tyrmäykseen keskiviikon tavoin. Nyt ollaan kuitenkin hyvin lähellä, ja pian nähdään todennäköisesti 3. testaus.
200 päivän keskiarvo laskee yhä nopeasti – suurin piirtein $1000 viikossa. Se on tällä hetkellä noin 82 650 dollarin tasolla. Viikko sitten 200 päivän keskiarvo oli noin 83 800 dollarissa.
Nykytrendillä 50 ja 200 pv:n keskiarvot leikkaavat ~kuukauden sisällä. Tämä Golden Cross olisi myös hyvin “bullish” signaali.
2018 ja 2022 karhumarkkinoissa Golden Cross saatiin siinä vaiheessa, kun Bitcoinin kurssi oli läpäissyt 200 päivän keskiarvon pysyvästi ja karhumarkkina oli jo ohi. Eli kyseessä on lagaava indikaattori, joka enemmän vahvistaa trendiä, joka on ollut jo käynnissä jonkin aikaa.
2014 tarjoaa kuitenkin poikkeuksen; myös silloin nähtiin iso nousuralli juuri toukokuussa, minkä vuoksi keskellä karhumarkkinaa saatiin “feikki” Golden Cross -signaali. Tämäkään indikaattori ei siis tarkoita täysin aukottomasti, että karhumarkkina olisi ohi.
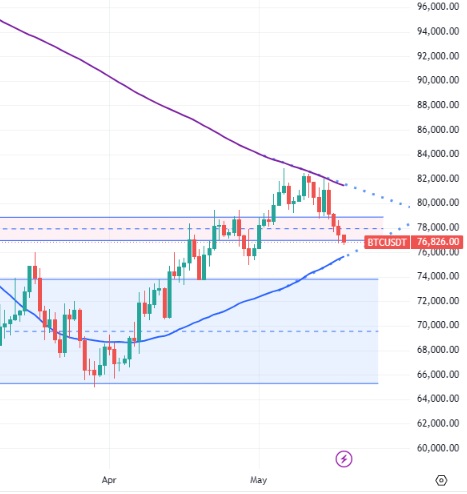
Bitcoinin kurssi on laskenut 3 päivää peräkkäin. Nyt ei olla enää 200 päivän keskiarvon tuntumassa, vaan Bitcoin on pudonnut aiemmalle vastustasolle.
Jos kurssi jatkaa laskua eikä saa tukea tältä tasolta, kuusi viikkoa kestänyt nousutrendi on kyllä uhattuna. Tämä reilu 79 000 dollarin taso toimi selkeänä vastuksena aiemmin keväällä - toivottavasti se on nyt tuki. Tästä olisi hyvä ottaa nyt pomppu ja printata pari vihreää päiväkynttilää.
Joka tapauksessa, “Golden Cross” näyttää vääjäämättä lähestyvän. Ja 200 päivän keskiarvo laskee niin nopeasti, että pelkkä sivuttaisliikekin Bitcoinin kurssissa vie sen testaamaan tuota tärkeää rajapyykkiä pian uudelleen.
Bitcoinin kurssi testasi eilen taas 200 päivän keskiarvoa. Kyseessä oli neljäs kerta yhdeksän päivän aikana, kun kurssi lähes kosketti tätä tärkeää trendilinjaa.
Toistaiseksi kurssi ei ole käynyt edes hetkellisesti 200 päivän keskiarvon yläpuolella. Tänään uusi testaus?
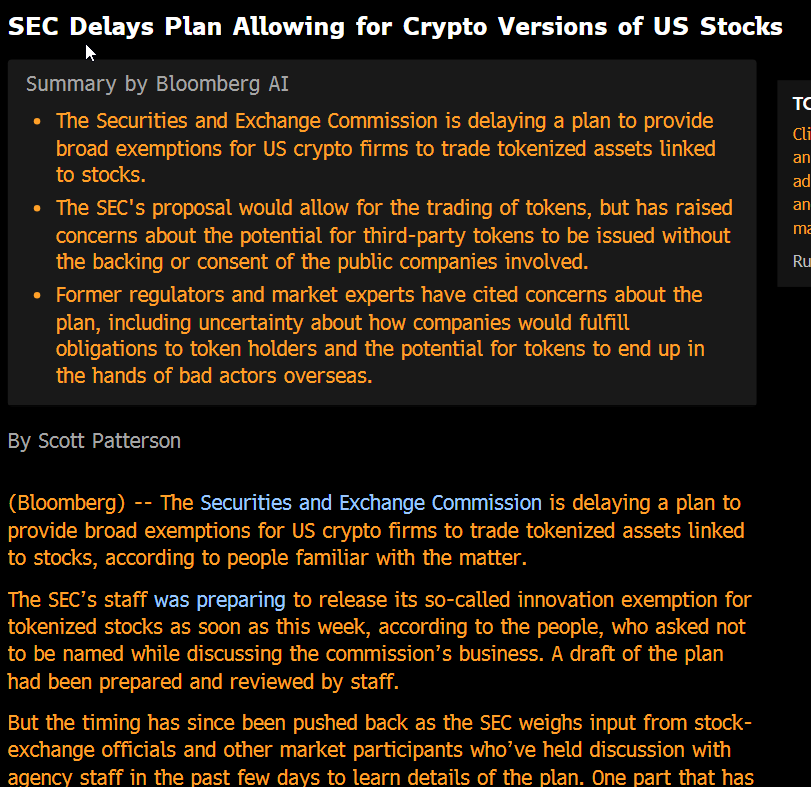
Bitcoin oli eilen laskussa kohti 79 000 dollaria, mutta kurssi kääntyi nousuun positiivisten uutisten vuoksi. Pitkään hiottu Clarity Act eteni Yhdysvalloissa Senaatin pankkikomiteasta eteenpäin. Nyt lakiehdotus menee seuraavaksi senaatin ja edustajanhuoneen äänestykseen.
Bitcoinin kurssikehitys ei näytä tällä hetkellä hyvältä. Takana on selkeä laskuviikko (5,8 %), joka on pahin lasku viikkotasolla noin 2,5 kuukauteen. Kurssi laski kaikkina muina päivinä paitsi torstaina, jolloin nähtiin voimakas nousu.
Bitcoinin kurssi kävi kokeilemassa 200 päivän keskiarvoa viitenä päivänä, mutta epäonnistui joka kerta. Kurssi ei päässyt kertaakaan aivan 200 päivän keskiarvolle. Olisi ollut kiva nähdä edes puhkaisu päivätasolla, puhumattakaan clousauksesta ko. trendin yläpuolelle.
Jos kurssi clousaa päivätasolla huhtikuun pohjien eli 75 800 dollarin alapuolelle, maaliskuun lopulla alkanut nousutrendi on ohi.
Somessa on ollut ihmettelyä siitä, miksi Bitcoinin kurssi laskee, vaikka tärkeä Clarity Act “meni läpi” Yhdysvalloissa. Sitä on hehkutettu jo kuukausien ajan todella tärkeänä virstanpylväänä.
Clarity Act pääsi eteenpäin vasta senaatin pankkikomiteasta ja etenee seuraavaksi kongressiin, jossa siitä äänestetään. Mitään lakia ei siis ole lyöty lukkoon. Tämän lisäksi osakemarkkina on ollut laskussa perjantaista lähtien ja futuurit näyttävät yhä punaiselta.
Iranin tilanne on yhä sekava ja inflaatio hermostuttaa Yhdysvalloissa, eikä Fedillä näytä olevan juuri mahdollisuuksia koronlaskuihin. Keskiviikkona saadaan Nvidian tulos, joka voi heiluttaa myös markkinoita.
Voi siihen lisätä vielä kesän, sekä lomakauden tulon, jolloin instikat keventää todennäköisesti positioitaan muutenkin. Eli siis perus sell in may and go away. Riskiposition päällä istuminen lomilla voi tuottaa merkittäviäkin tappioita.
Viime viikon maanantaina alkanut laskutrendi on jatkunut myös tällä viikolla. Bitcoinin kurssi printtasi punaisen päiväkynttilän sekä maanantaille että tiistaille. Kurssi putosi eilen lähes 76 000 dollariin ja oli hyvin lähellä 50 päivän keskiarvoa.
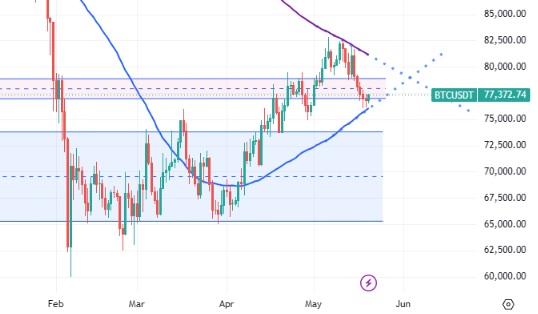
Bitcoin on palautunut yön ja aamupäivän aikana 77 000 dollarin yläpuolelle. Ostopainetta näyttäisi löytyvän tältä tasolta, joka tarjosi hetkellisesti tukea myös helmikuussa, ennen kuin kurssi romahti 60 000 dollarin pohjiin.
Päivägraafi näyttää edelleen mielenkiintoiselta. 50 päivän keskiarvo trendaa yhä vahvasti ylöspäin toukokuun laskusta huolimatta ja vaikuttaa leikkaavan vääjäämättä 200 päivän keskiarvon kesäkuun aikana. Tämä tarjoaisi klassisen Golden Cross -signaalin.
Se on kuitenkin todettava, että Bitcoinin saamat tyrmäykset 200 päivän keskiarvolta olivat heikko signaali. Tilanne on huomattavasti heikompi kuin kaksi viikkoa sitten, ja X:n todella bullish sentimentti on myös kadonnut toukokuun edetessä. Voidaan todeta, että 4 vuoden teoriaan uskovat karhut ovat taas pienen tauon jälkeen vahvoilla.
Oma näkemys pysyy edelleen samana: mä varaudun siihen, että historia toistaa itseään, kunnes saan riittävän vahvoja todisteita päinvastaisesta. Eli karhumarkkina kestää sen ~12 kuukautta ja pohjia ei ole vielä nähty.
200 päivän keskiarvon vakuuttava rikkominen olisi ollut ehdottomasti todiste tätä historiallista kehitystä vastaan, mutta se jäi nyt saamatta.
Markkina vaikuttaisi muuten olevan aika odottavissa tunnelmissa. Syynä tähän on tietysti Nvidian tulosjulkistus, joka saadaan myöhemmin tänä iltana.
Mielenkiintoisena yksityiskohtana voidaan mainita myös valtiolainojen korkojen nousu. Yhdysvaltain 30 vuoden lainan korko nousi eilen jo 5,2 %:n tasolle, mikä on korkein noteeraus sitten vuoden 2007. Perinteisesti korkojen nousu on ollut myrkkyä riskiasseteille, mutta viime vuosina tästä ei ole kyllä tullut merkittävää hidastetta.
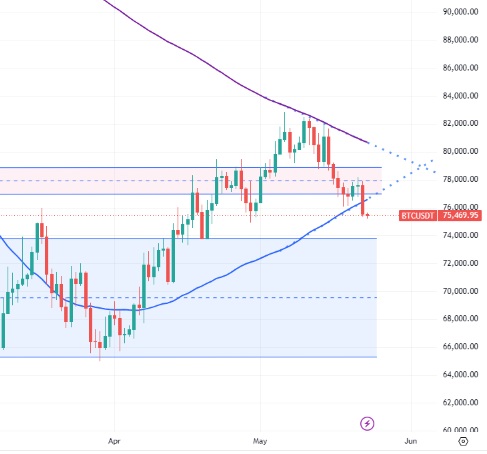
Bitcoinin tilanne heikkeni merkittävästi yön aikana. Kurssi putosi tukitason ja 50 päivän keskiarvon alapuolelle ja clousasi päiväkynttilän alle huhtikuun pohjan. Maaliskuun lopulla alkanut nousutrendi on nyt siis ohi.
Tämä tapahtui lisäksi samaan aikaan, kun kaikki USA:n osakeindeksit rikkoivat ATH-lukemia. Tästä graafista ei saa positiivista, vaikka olisi miten härkäiset lasit.
Tilannetta ei varsinaisesti auta se, että Iranin sota voi käynnistyä uudelleen. Jos näin tapahtuu viikonlopun aikana, kryptomarkkina sukeltaa taatusti entistä syvemmälle.
BREAKING: President Trump is preparing for possible NEW military strikes against Iran, according to CBS News.
President Trump has now returned to Washington, after CANCELING his Memorial Day weekend plans in New Jersey.
According to CBS, multiple U.S. military and intelligence officials have ALSO canceled their holiday plans and are now on standby.
No final decision has been made yet, but something major may be imminent.
Bitcoinin kurssi clousasi sunnuntain ja samalla viikon hieman yli 77 000 dollariin. Tämä oli erittäin positiivinen päätös viikolle, sillä kurssi nousi takaisin tukitason ja 50 päivän liukuvan keskiarvon yläpuolelle.
Tämä oli todella positiivinen lopetus viikolle synkän perjantain jälkeen. Kurssi toipui lopulta perjantain isosta laskusta jo lauantaina. Sunnuntaina saatiin myös pientä nousua, ja Bitcoin laski lopulta viikkotasolla vain 0,5 prosenttia.
Lähtökohdat tähän viikkoon ovat siis varsin positiiviset. Samaan aikaan 200 päivän liukuva (purppura trendilinja) on laskenut edelleen todella jyrkässä kulmassa. Kuten aiemmissa postauksissa on todettu, tämä trendilinja on toiminut historiallisesti karhumarkkinan rajana.
Bitcoinin kurssi ei clousannut päivätasolla kertakaan 200 päivän liukuvan yläpuolelle 2018 tai 2022 karhumarkkinoissa. Tällä hetkellä Bitcoinilta vaadittaisiin vain 4 prosentin nousu tuon trendin rikkomiseksi.
Samaan aikaan 50 ja 200 päivän liukuvat kehittyvät yhä siihen suuntaan, että ne leikkaavat toisensa reilun viikon kuluttua. Tästä muodostuisi hyvin positiivinen Golden Cross -signaali.
Lähi-idän tilanteella on varmasti iso merkitys osake- ja kryptomarkkinan kehitykseen tällä viikolla. Viikonloppuna on saatu taas signaaleja Iranin ja Yhdysvaltojen välisestä diilistä. Juuri nyt näyttää kuitenkin siltä, että mitään diiliä ei todellisuudessa ole eikä tule.
BREAKING: Two sources close to Trump’s negotiation team say Trump is now completely backing away from the US-Iran deal, under “extreme internal pressure from Israel and its US domestic allies,” urging him not to accept Iran’s terms. After this, Trump posted an image of Mark 84 bomb on a fighter jet, with his signature “Thank you for your attention to this matter” catchphrase stenciled directly on the bomb, on Truth Social.